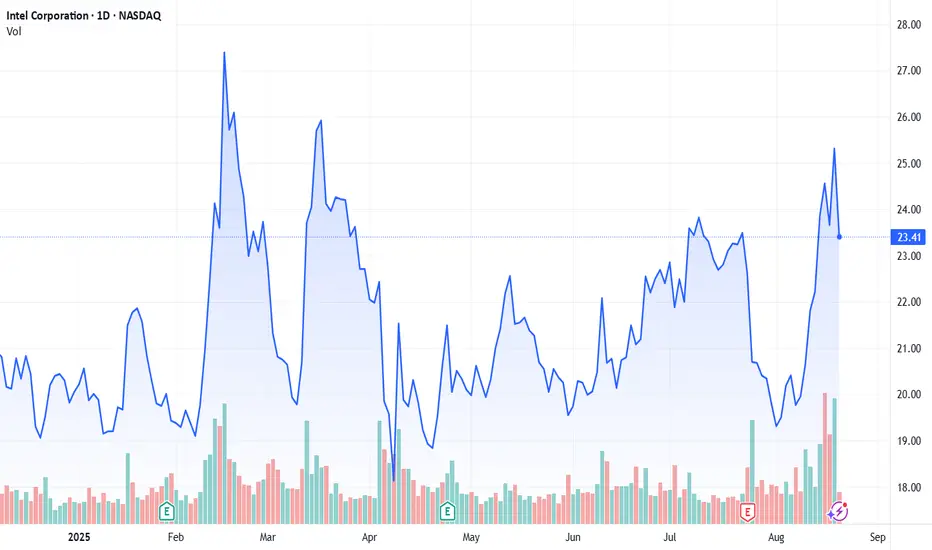
Intel in 2025: The Pre-Boom Echo of Early Nvidia?In 2018, Nvidia (NVDA) was trading at a fraction of its current valuation, largely overlooked despite its cutting-edge GPU tech and early AI involvement. Fast forward to 2023–2024, it became the poster child of the AI revolution, with exponential growth driven by massive demand for AI infrastructure. Intel (INTC) today mirrors that earlier phase: undervalued, undergoing strategic shifts (Gaudi AI chips, foundry expansion, AI PCs), and investing heavily in AI and semiconductor independence in the West. While NVDA had clear early tech leadership, Intel is positioning itself as the alternative > a comeback story with geopolitical tailwinds, untapped AI potential, and a lower price entry. If history rhymes, Intel might be where NVDA was , not in dominance, but in opportunity.
Easy words, BUY SOME AND HOLD!!!
NVDA
Nvidia Shares Maintain Bearish Bias Near $170Over the past three trading sessions, Nvidia’s shares have posted a sharp decline, accumulating losses of more than 3% in the short term. For now, the emerging selling bias around the stock remains in place, as the market fears a potential overheating of the artificial intelligence industry. Added to this is the anticipation of the company’s results on August 27, which may show difficulties in revenue, mainly due to concerns that sales in China have weakened in recent months amid the intensifying trade war. Earnings per share are expected to come in around $0.94, but uncertainty remains as to whether this figure can hold given possible performance challenges. As long as this uncertainty persists, selling pressure on the stock could remain in the short term.
Uptrend Channel at Risk
Recent sessions have shown a clear shift in the bullish outlook that Nvidia had been sustaining in prior weeks. A significant bearish correction has emerged, halting the advance of the short-term uptrend channel and leading to a breakdown of its lower boundary. As long as selling pressure continues, this previous channel may lose relevance and give way to a broader bearish scenario, provided the bearish bias remains dominant.
Technical Indicators
RSI: the RSI line has begun to show a downward slope, now approaching the neutral 50 level. If it breaks below this threshold, selling momentum could become dominant in the short term, paving the way for stronger bearish pressure on the chart in the upcoming sessions.
MACD: the MACD histogram is currently moving below the 0 line, reflecting that short-term moving averages have entered a sustained bearish territory. If the histogram continues to decline, selling pressure is likely to strengthen further in the short term.
Key Levels to Watch:
$184 – Main Resistance: corresponds to the area of recent highs. A sustained recovery above this level could reactivate a bullish bias and bring back strength to the uptrend channel.
$173 – Near-Term Support: current congestion zone of recent weeks and the most immediate barrier. A sustained move below this level could trigger a stronger bearish bias in the short term.
$162 – Crucial Support: aligned with the 23.6% Fibonacci retracement. A decisive break below this level would confirm a bearish structural shift, opening the door to a new selling trend in the short term.
Written by Julian Pineda, CFA – Market Analyst

Nvidia - This is clearly not the end!📐Nvidia ( NASDAQ:NVDA ) will simply rally more:
🔎Analysis summary:
Yes, over the past couple of months, Nvidia has been rallying another +100%. But looking at the higher timeframe, this is still not the end of the unbelievable bullrun. Following the rising channel pattern, Nvidia can rally another +20% before we might see a potential retracement.
📝Levels to watch:
$250
SwingTraderPhil
SwingTrading.Simplified. | Investing.Simplified. | #LONGTERMVISION

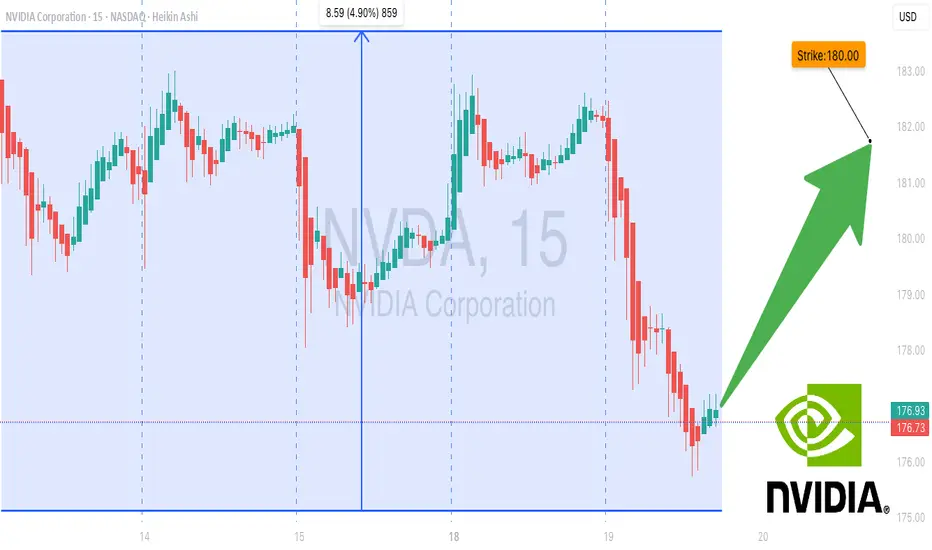
Strong Bullish Flow in NVDA: $180 Calls Primed for Breakout! 🚀 NVDA Weekly Options Bullish Flow – Aug 19, 2025
**Market Sentiment:**
📈 Total calls: **632,689** | Total puts: **334,721**
💥 **Call/Put Ratio: 1.89 → Strong Weekly Bullish Flow**
⚠️ Gamma Risk: Moderate – watch volatility closely.
**Technical Indicators:**
* **Daily RSI:** 63.3 → slight pullback signs
* **Weekly RSI:** 87.2 → 🚀 strong weekly momentum
* **Weekly Volume Ratio:** 0.9x → weak institutional activity, caution advised
**Options Highlights:**
* Key strikes: **\$180** (OI: 65,649), **\$187.50** (liquid and premium-friendly)
* Expiration in **3 days** → time decay accelerating
**Risks to Monitor:**
* Weak weekly volume
* Daily RSI trending down
* Price support at **\$175.90–\$176.00**
**Consensus & Trade Setup:**
* **Overall Bias:** Moderate Bullish
* **Recommended Trade:** **Single-leg Call**
* **Strike:** \$180.00
* **Entry:** \$3.60
* **Stop Loss:** \$1.80
* **Profit Target:** \$6.00–\$7.50 (80%-100% potential)
* **Confidence:** 65%
**Trade JSON Snapshot:**
```json
{
"instrument": "NVDA",
"direction": "call",
"strike": 180.0,
"expiry": "2025-08-22",
"confidence": 0.65,
"profit_target": 6.00,
"stop_loss": 1.80,
"size": 1,
"entry_price": 3.60,
"entry_timing": "open",
"signal_publish_time": "2025-08-19 13:15:57 EDT"
}
ALAB $304 After Consolidation Around $180 Resistance/SupportALAB had a big rise today into $180 resistance. This should be an area where a small pullback occurs or a further rise and then pullback into what will be $180 support. (Personally I'm leaning towards pullback above $180 rather than below)
Keep an eye on the major trendline as if ALAB gets too far away it will eventually want back to that trendline.
$304 is the next target. All Information Technology / Computer stocks are in the middle of the a big uptrend so this one has room to run.

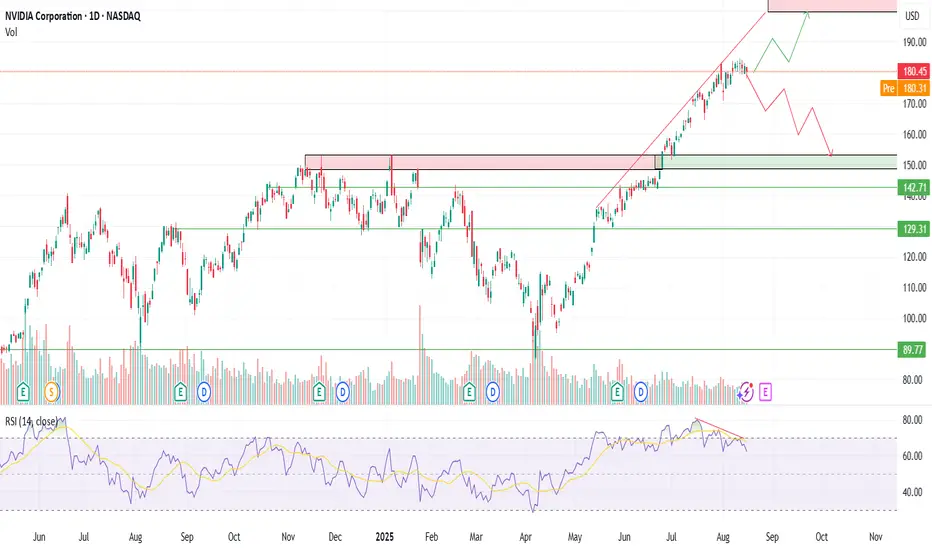
NVDA – Two Scenarios on the Table: 200 or 140?NVIDIA has been the undeniable leader of the AI revolution, pushing higher for months and hitting fresh highs around $180+. But after such a strong rally, the market often faces a “decision zone”: either break higher with momentum or take a healthy correction.
That’s why I’m laying out two clear trade paths — bullish continuation 🚀 and bearish retracement 📉.
✅ Bullish Scenario (Momentum Continues → $200)
Entry Points (Bullish):
$178
$170
$160
Profit Targets:
TP1: $185
TP2: $190
TP3: $200+
⚠️ Bearish Scenario (Healthy Correction → $140 Entry)
If momentum fades and sellers push NVDA below $170, a correction toward $140 is possible — which would actually be a great long-term entry for buyers waiting on the sidelines.
Entry Points (Bearish Long Setup):
$160
$150
$140 (ideal deep value entry zone)
Profit Targets on Rebound:
TP1: $160
TP2: $175
TP3: $190
📌 Disclaimer: This is not financial advice. I’m sharing my personal trading view for educational purposes. Always do your own research and manage risk before entering any trade.
Gold Market Update and SWING Trade Plan with SL/TP ________________________________________
📊 Gold Technical Outlook Update – H4 & 2H Chart
📰 Latest Summary Headlines
• 🟡 Gold edges firmer as weaker USD provides short-term lift.
• 📉 Technical compression on charts signals potential sharp move.
• ⚠️ Rising wedge formation hints at possible breakdown risk.
• 🎯 Traders eye a slide toward $3,225 if bearish pattern confirms.
________________________________________
🏆 Market Overview
• 💰 Current gold price hovers near $3,345–3,348 per ounce, consolidating in a tight range.
• 🔄 Price action remains choppy, with no breakout beyond key levels in recent sessions.
• ⛔ Strong resistance sits at $3,410–3,420 USD, keeping rallies capped.
• ⚖️ Major support remains at $3,300–3,310 USD, forming the lower boundary of the range.
• 💱 Market sentiment is driven by softer USD and yields, with gold unable to gain decisive momentum.
• 🌪️ Volatility expected to persist as traders await stronger catalysts.
________________________________________
⭐️ Recommended Trade Strategy
• 🎯 Bearish Setup (2H/H4): Short gold near $3,410–3,420 resistance.
• 🛑 Stop-loss: Above $3,430 recent highs.
• ✅ Take profit: Initial target $3,310 USD, extension to $3,300 USD.
• 📊 Range trading remains the favored play—sell near resistance, buy near support.
• ⚡ Stay nimble for sharp moves if the wedge pattern resolves.
• 🛡️ Risk management is critical: use tight stops and scale positions accordingly.
________________________________________
💡 Gold Market Highlights
• 🛡️ Safe-haven demand underpins gold as investors hedge against uncertainty.
• 🏦 Institutional flows remain strong, though short-term pullbacks are likely.
• 💥 Compression on charts suggests an explosive move once direction is chosen.
• 📈 Current market levels: Gold spot ~$3,345–3,348, ETF (GLD) trades around $307.
________________________________________
📌 Summary
• 📏 Gold remains locked in a multi-week range between $3,300 support and $3,410 resistance.
• 📉 The wedge pattern on short-term charts favors a potential breakdown toward $3,225.
• 🐻 Short-sellers should wait for confirmation, while 🐂 bulls will defend key support zones.
• 🧭 Tactical range trading remains the best approach until a decisive breakout occurs.
________________________________________

NVDA Ready to Break Higher – $187.50 Calls Flashing Opportunity!
# 🚀 NVDA Weekly Options Analysis (2025-08-17) – Don’t Miss Out!
### 🔎 Model Insights Recap
**Grok/xAI Report**
* 📊 RSI: Falling (daily & weekly → potential exhaustion)
* 📈 Call/Put Ratio: **2.00 (Bullish flow)**
* 🔊 Volume: Weak
* ✅ Decision: Moderate bullish → suggested **\$190 Call**
**Gemini/Google Report**
* 📊 RSI: Declining
* 📈 Options Flow: Strong, but weak trend & volume
* 🛑 Decision: **Pass** (low confidence)
**Claude/Anthropic Report**
* 📊 Technical: Overbought with negative divergence
* 🔊 Volume: Flat weekly
* 🛑 Decision: **No trade** (bearish momentum indicators)
**Llama/Meta Report**
* 📊 Bias: Neutral-bullish (options flow positive)
* 🔊 Volume: Weak
* ✅ Decision: **\$187.50 Call** with caution
**DeepSeek Report**
* 📊 Market: Bearish divergence despite bullish flow
* 🔊 Volume: Weak institutional support
* 🛑 Decision: **No trade**
---
### 📌 Key Agreements
✔️ Declining daily & weekly RSI = potential momentum exhaustion
✔️ Strong call/put ratio = bullish sentiment from options traders
✔️ Weak volume = lack of support for sustained upside
### 📌 Key Disagreements
⚖️ Grok/xAI & Llama/Meta → potential bullish calls
⚖️ Gemini/Claude/DeepSeek → caution/pass
⚖️ Bullishness varies depending on options flow vs volume
---
## 📊 Recommended Trade Setup
* **Direction:** CALL (Long)
* **Strike:** \$187.50
* **Expiry:** 2025-08-22
* **Entry Price:** \$0.85
* **Stop Loss:** \$0.34 – \$0.425 (40-50% of premium)
* **Profit Target:** \$1.50 (50-100% return)
* **Entry Timing:** Market Open
* **Confidence:** 65%
---
### ⚠️ Key Risks
* **Momentum Exhaustion:** Falling RSI could signal reversals
* **Weak Institutional Support:** Volume may limit upside
* **Event Risk:** Upcoming earnings may introduce volatility
---
📊 **TRADE DETAILS JSON**
```json
{
"instrument": "NVDA",
"direction": "call",
"strike": 187.50,
"expiry": "2025-08-22",
"confidence": 0.65,
"profit_target": 1.50,
"stop_loss": 0.34,
"size": 1,
"entry_price": 0.85,
"entry_timing": "open",
"signal_publish_time": "2025-08-17 09:26:30 EDT"
}
```

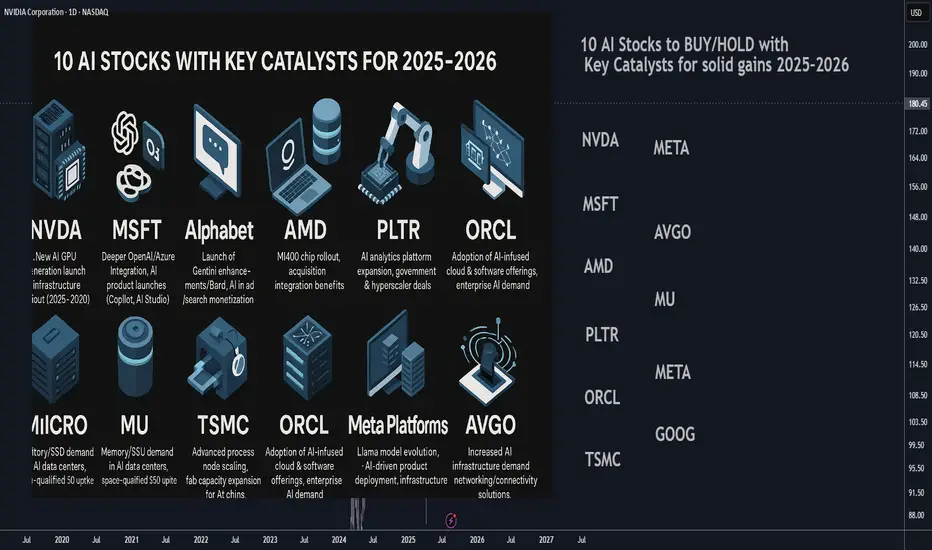
10 AI Stocks to BUY/HOLD with Key Catalysts for solid gains 202510 AI Stocks to BUY/HOLD with Key Catalysts for solid gains 2025–2026
________________________________________
1. NVIDIA (NASDAQ: NVDA)
• Catalyst: Expansion of AI infrastructure via new GPU generations (e.g., Blackwell), continued dominance in AI training/deployment. Regulatory/availability clarity in key markets like China could also drive demand.
• Highlights: Leader in AI GPUs; high analyst upgrades and raised targets; strong global demand from data centers and hyperscale AI deployments.
________________________________________
2. Microsoft (NASDAQ: MSFT)
• Catalyst: Deepening integration of AI across products and services (e.g., Office, Teams), OpenAI partnership further embedded in Azure services, AI product launches (Copilot, AI Studio).
• Highlights: Extensive cloud & enterprise reach; strong balance sheet; strategic positioning as AI infrastructure and application leader.
________________________________________
3. Alphabet (NASDAQ: GOOGL)
• Catalyst: Rollout of key AI products (e.g., Gemini, Bard enhancements), continued monetization of AI in search & advertising, rising AI-related cloud license revenue.
• Highlights: Core AI research leader; growing earnings momentum; sustained institutional inflows and investor confidence tied to AI growth.
________________________________________
4. AMD (NASDAQ: AMD)
• Catalyst: Launch of AI-optimized server chips (e.g., MI400 series), integration of AI functionality in CPUs/GPUs, synergy from Xilinx and Silo AI acquisitions.
• Highlights: Aggressive roadmap in AI compute; acquisitions bringing AI IP and talent; gaining share in AI server ecosystem.
________________________________________
5. Palantir (NYSE: PLTR)
• Catalyst: Expansion of AI-driven government and commercial contracts, rollout of AI-enabled analytics platforms such as Palantir AI suite, new hyperscaler partnerships.
• Highlights: AI-analytics leader with strong public-sector footprint; pivoting toward cloud-based AI; high-margin recurring revenue potential.
________________________________________
6. Micron Technology (NASDAQ: MU)
• Catalyst: Accelerated demand for AI-optimized memory and storage (e.g., HBM, SSDs); uptake of Micron's AI/space-qualified SSDs; expansions into AI data center deployments.
• Highlights: Strong sequential performance in earnings; double-digit growth in AI segments; positioned as non-GPU hardware beneficiary of AI boom.
________________________________________
7. TSMC (NYSE: TSM)
• Catalyst: Scaling advanced process nodes (e.g., N3E, N2) to support AI chips, capacity expansion initiatives, securing AI chip orders from Nvidia, AMD, and other fabless players.
• Highlights: Global leader in semiconductor foundry; high-barrier-to-entry business model; direct beneficiary of AI silicon ramp-up.
________________________________________
8. Oracle (NYSE: ORCL)
• Catalyst: Launch and adoption of Oracle Cloud AI capabilities (OCI AI, embedded ML), AI-driven Oracle Fusion applications, increasing AI-related capex by enterprise customers.
• Highlights: Strong enterprise penetration; AI-infused software suite; renewed investor interest from hedge funds targeting AI exposure.
________________________________________
9. Meta Platforms (NASDAQ: META)
• Catalyst: Continued investment in large-scale AI infrastructure (data centers), Llama 3 and generative AI models, new AI products in social, AR/VR, and enterprise.
• Highlights: Massive AI compute investments; pioneering open models like Llama; turning AI into a core product strategy beyond social media.
________________________________________
10. Broadcom (NASDAQ: AVGO)
• Catalyst: AI-related semiconductor solutions (e.g., networking, connectivity, acceleration) embedded in data center infrastructure, demand from AI workload networking.
• Highlights: Integral player in AI infrastructure as part of the “Fab 4”; diversified exposure across chips critical for AI workloads.
________________________________________
How to Monitor These Catalysts
• Product Launches & Roadmap Updates (e.g., NVDA GPU release events, AMD MI400 launch, META model updates)
• Earnings Calls / Financial Guidance revealing AI revenue — especially with MSFT, GOOGL, ORCL, MU, and AVGO
• Partnership or Contract Announcements — e.g., Palantir industry deals, Oracle enterprise AI deployments
• Capacity & Scaling News — e.g., TSMC fab expansion, Micron memory contracts, Meta data center buildouts
Stock Market Forecast | TSLA NVDA AAPL AMZN META MSFTQQQ CME_MINI:NQ1! CME_MINI:ES1! stock market Forecast
Nvidia Stock NASDAQ:NVDA Forecast
Apple Stock AAPL Forecast
Microsoft Stock MSFT Forecast
Google Stock GOOGL Forecast
Amazon Stock AMZN Forecast
Meta Forecast Technical Analysis
Tesla Stock NASDAQ:TSLA Forecast
Magnificent 7 stocks forecast

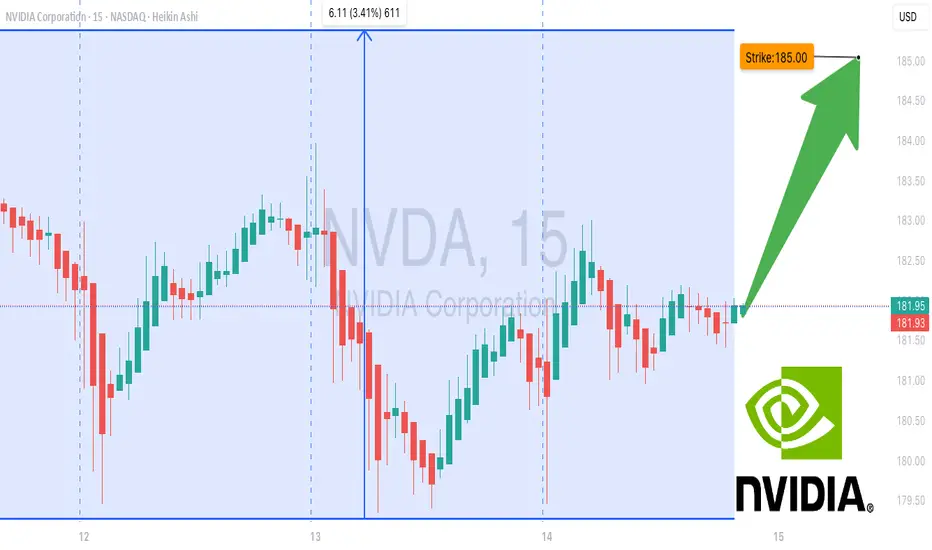
NVDA Gamma Showdown: Will Bulls Break $185 Before Time Runs Out? 🚀 NVDA Gamma Showdown: Will Bulls Break \$185 Before Time Runs Out?
**Sentiment:** ⚖️ *Moderate Bullish, High Risk*
* **Call/Put Ratio:** 1.78 📈
* **Daily RSI:** Mixed → Losing momentum
* **Weekly RSI:** Still bullish
* **Volume:** Weak → Low institutional conviction
* **Gamma Risk:** 🔥 HIGH — expiry in 1 day
* **Time Decay:** Accelerating ⚡
---
### 📊 **Consensus Highlights**
✅ Bullish options flow supports upside potential
⚠️ Weak volume + gamma risk = cautious sizing
💡 Tight stop loss and fast profit-taking advised
---
### 🎯 **Trade Setup**
* **Type:** CALL (Naked)
* **Strike:** \$185.00
* **Expiry:** 2025-08-15
* **Entry:** \$0.62
* **Profit Target:** \$0.86 (+30%)
* **Stop Loss:** \$0.31 (–50%)
* **Confidence:** 65%
* **Entry Timing:** Market open
---
💬 *This is a high-risk, high-reward expiry play — watch it like a hawk.*
📌 *Not financial advice. DYOR.*
---
**#NVDA #OptionsTrading #GammaSqueeze #DayTrading #StocksToWatch #OptionsFlow #TradingSignals #StockMarket**
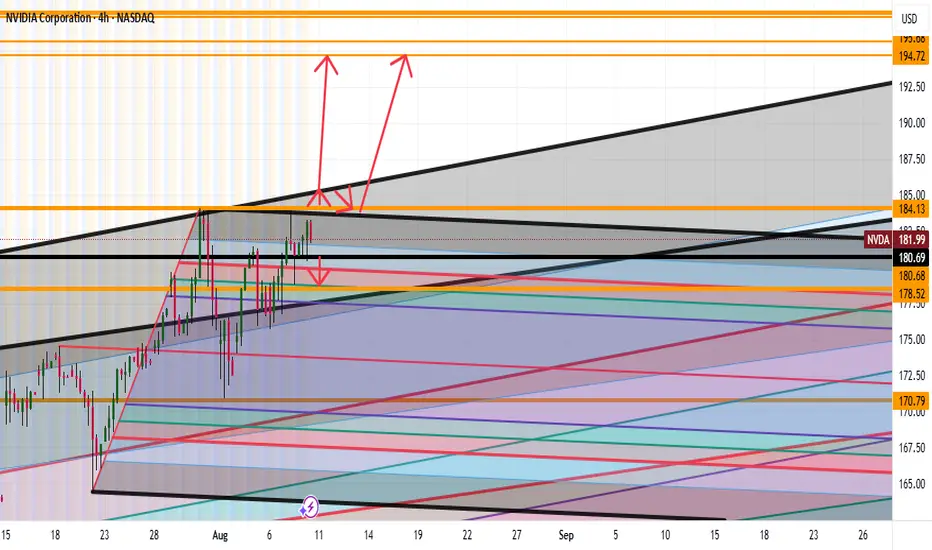
Proprietary SupportIn this slowly but continuously updating idea I will be posting an interesting way to analyze charts. It is something old but also new, like duality.
We all know that the stock market continuously grows.
But it doesn't always grow.
For markets lie between worlds.
The reasonable and the unreasonable.
The free choice and the illusion of free choice.
Let me explain...
In micro scale, we seem to believe that the markets follow the "support / resistance" rule.
An (over)simplification necessary for us to comprehend the infinities of the quantum world.
There are lots of stories told in the picture above...
- Prices are chaotic and completely incomprehensible.
- We have to smooth-out to get a clearer picture.
- Is Support / Resistance real or a result of crowd psychology?
- At what point horizontal action "ceases" to exist and "trend" takes over?
Either we call it a "power law" or a Lin-log regression, charts in macro scale seem to trend.
So prices sometimes move with one "law" (support) and sometimes with another (trend).
Do we remember / know what is the foundation of price movement?
A century ago, Wyckoff came up with his theory of accumulation and distribution.
We can safely say that his research was not a result of crowd psychology. He backtested countless price charts, in a period (1920s) when trading was purely psychological, with traders having little experience to modern ideas of "trend", "support" etc.
Just like the new modern technology design principles, ahem aapl, technological information lies inside bubbles. Transparent but distorted. Clear but fuzzy. Duality once again.
Modern trading is a self sustaining loop. The "freedom" of our actions is trapped inside a bubble. Most of us "trade" with similar strategies, and end up in the mass pool of barely-profitable-investors. Unconventional strategists like Hedge Funds must have "alien" technology to overcome such psychological traps.
Back to the main chart:
It is one attempt to bring a new dimension to chart analysis. To merge these two worlds of "support" and "trend". I cannot possibly reach the expertise of massive corporations, but I can bodge something out, and I did.
Price charts can be analyzed with unconventional / proprietary methods to conclude into the chart above. It is a little rough but bear with me. I had to perform complex calculations which I couldn't compile into a Pine Indicator. There is a reason that the top lines are not exactly straight. Their calculations depend on a blend between micro and macro movements.
A couple of interesting charts to conclude the first update of this idea:
BTC Daily
BTC Weekly
A Perfect Fractal.
I hate bubbles. Mental ones, Soapy ones, Stock ones and UI ones.
- An angry Father Grigori.

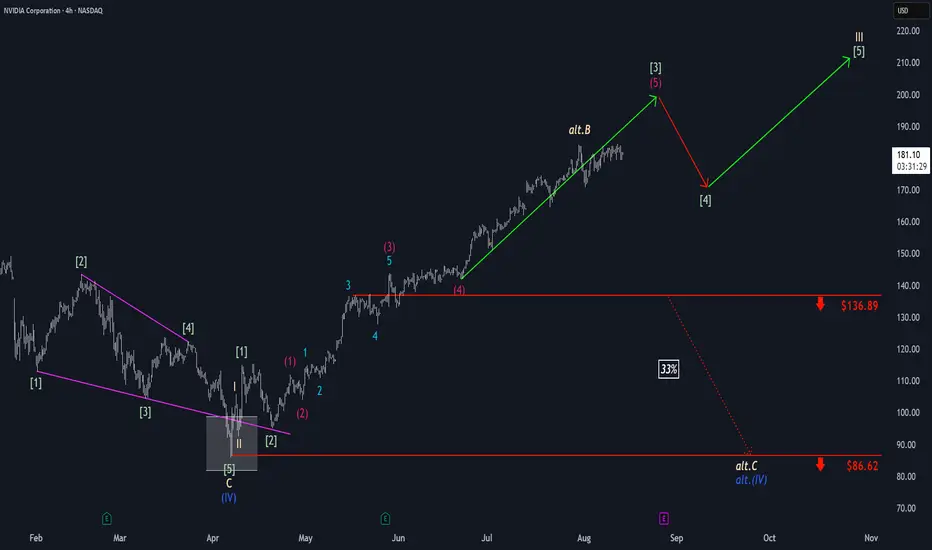
Nvidia: Extending the RallyThe bulls have maintained their momentum in Nvidia, effectively managing any interim pullbacks and allowing the stock to make further gains within the framework of green wave . We still see some additional upside potential at this stage before an interim correction of wave is likely. Well above support at $136.89, wave should then begin, pushing the stock even higher and completing the larger beige wave III. That said, we still see a 33% chance that NVDA has only recently marked the corrective top of beige wave alt.B and could soon fall below $136.89, setting a new correction low for blue wave alt.(IV) near the $86.62 level. Primarily, however, we believe wave (IV) has concluded.
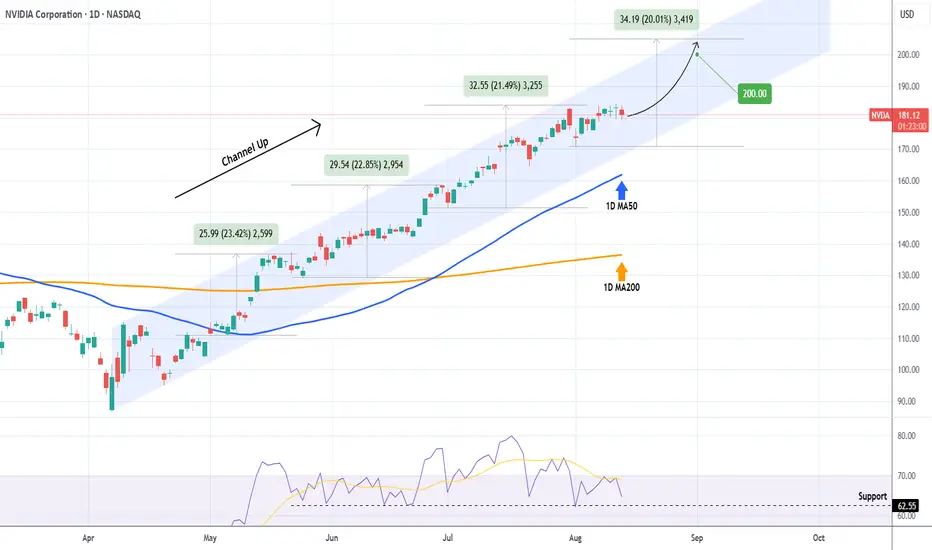
NVIDIA Is the path to $200 that easy?NVIDIA Corporation (NVDA) has been trading within a Channel Up since the April 07 market Low, being so aggressive that it has turned its 1D MA50 (blue trend-line) into Support since May 01.
The last 3 main Bullish Legs all rose by at least +20%. As long as the 1D RSI Support holds, we expect another such Leg, which would be enough for NVIDIA to reach the all important $200 psychological Target.
-------------------------------------------------------------------------------
** Please LIKE 👍, FOLLOW ✅, SHARE 🙌 and COMMENT ✍ if you enjoy this idea! Also share your ideas and charts in the comments section below! This is best way to keep it relevant, support us, keep the content here free and allow the idea to reach as many people as possible. **
-------------------------------------------------------------------------------
💸💸💸💸💸💸
👇 👇 👇 👇 👇 👇
$NVDA - $280-300 YEAR END TARGET Trend is your friend, just keep it simple. Lots of runway ahead accompanied with improved gross margins of mid 70% during back half of the year on already high margins. Technical trend channel has a price objective between $280 to almost $300.

NBIS Nebius Group Among My Top 10 Picks for 2025 | Price TargetNebius Group N.V. (NBIS) presents a compelling bullish case for a potential doubling of its stock price by the end of 2025, driven by several fundamental factors that highlight its growth trajectory within the rapidly expanding AI infrastructure market.
NVIDIA Corporation (NVDA) has made a significant investment in Nebius Group N.V. (NBIS), contributing to a $700 million funding round aimed at expanding Nebius's AI infrastructure capabilities. This investment aligns with NVIDIA's strategic focus on enhancing its presence in the rapidly growing AI market.
Explosive Revenue Growth:
Nebius Group has demonstrated remarkable revenue growth, with Q3 2024 revenues reaching $43.3 million, representing a 1.7-fold increase compared to the previous quarter and a staggering 766% year-over-year increase. This surge is primarily driven by the company's core AI infrastructure business, which grew 2.7 times quarter-over-quarter and 6.5 times year-over-year. Analysts expect this momentum to continue, projecting annual revenues of approximately $731.96 million for 2025, reflecting a robust demand for AI-centric services and solutions.
Strategic Investments in AI Infrastructure:
The company is heavily investing in expanding its GPU cluster capabilities and data center capacity, with plans to allocate over $1 billion towards these initiatives. This strategic focus on enhancing AI infrastructure positions Nebius to capture significant market share as the global demand for AI technologies continues to rise. The annualized run-rate for its cloud revenue has already surpassed $120 million, indicating strong customer adoption and a growing client base that includes Fortune 500 companies.
Strong Market Position and Competitive Advantage:
Nebius Group is uniquely positioned within the AI infrastructure landscape, specializing in full-stack solutions that cater to developers and enterprises looking to leverage AI technologies. As businesses increasingly prioritize AI integration into their operations, Nebius's comprehensive offerings make it an attractive partner for organizations seeking to enhance their technological capabilities. The company’s ability to provide scalable solutions will be crucial as the demand for AI services expands.
Healthy Financials and Cash Reserves:
As of September 30, 2024, Nebius reported cash and cash equivalents totaling approximately $2.29 billion, providing a solid financial foundation to support its growth initiatives without excessive reliance on debt. This strong liquidity position allows Nebius to invest aggressively in technology and infrastructure while maintaining operational flexibility 14. Additionally, with gross margins projected to remain robust at around 55% in 2025, the company is well-positioned to improve profitability as revenues grow.

NVDA NVIDIA Price Target by Year-EndNVIDIA Corporation (NVDA) remains a dominant force in the AI and semiconductor markets, with its forward price-to-earnings (P/E) ratio currently at 19.37—a reasonable valuation considering its growth trajectory and market position.
NVIDIA’s leadership in the AI sector, particularly through its cutting-edge GPUs, has driven strong demand from data centers, cloud providers, and AI developers. The company’s recent product launches, including the Hopper and Blackwell architectures, have further solidified its competitive edge.
Despite recent market volatility, NVIDIA's consistent revenue growth and expanding profit margins support the bullish case. The current P/E of 19.37 reflects a balanced risk-reward profile, suggesting that the stock is not overvalued despite its impressive performance.
A price target of $145 by year-end reflects approximately 15% upside from current levels, driven by sustained AI demand and growing market penetration. Investors should watch for quarterly earnings reports and updates on AI chip demand, as these will likely act as key catalysts for upward momentum.

Stock Market Forecast | TSLA NVDA AAPL AMZN META MSFTStock Market Forecast | CME_MINI:NQ1! CME_MINI:ES1! QQQ SPY
MAG 7 Forecast NASDAQ:TSLA NASDAQ:NVDA AAPL AMZN META MSFT GOOGL

NVDA Don’t Miss Out## ⚡ NVDA Swing Setup (2025-08-08) ⚡
**Bias:** 📈 **Moderate Bullish** — RSI hot (67), trend up, low VIX, but volume still meh.
**🎯 Trade Plan**
* **Ticker:** \ NASDAQ:NVDA
* **Type:** CALL (LONG)
* **Strike:** \$185.00
* **Entry:** \$3.15 (near open)
* **Profit Target:** \$4.65 (+48%)
* **Stop Loss:** \$2.13 (-30%)
* **Expiry:** 2025-08-22 (14DTE)
* **Size:** 1 contract
* **Confidence:** 75%
**📊 Key Notes**
* RSI strong = momentum on your side ✅
* VIX favorable for calls ✅
* Weak volume & neutral flow = confirm before adding size ⚠️
* Watch breakout above **\$183.88** for momentum kick
**💡 Play Idea:**
Ride momentum to \$195+, take 50% profits at \$4.65, trail stops to lock gains.

NVDA Going to 194 Full AnalysisGood afternoon Traders
So looking at NVDA we have a strong monthly bullish trend
Micro though we see the following:
Bearish: If we break the lows of 180 expect to see 178 getting hit
Bullish: Break 184 highs then expect to see a punch up to 185 then small correction then a big up to 190's or we miss the correction and blow right through to the 190's
Happy Trading Folks
Trade Smarter Live Better
Kris
Nvidia - This is clearly not the end!📐Nvidia ( NASDAQ:NVDA ) will confirm the breakout:
🔎Analysis summary:
Over the past couple of months, Nvidia managed to rally about +100%, reaching top 1 of total market cap. Most of the time such bullish momentum just continues and new all time highs will follow. But in order for that to happen, Nvidia has to confirm the all time high breakout now.
📝Levels to watch:
$150
🙏🏻#LONGTERMVISION
SwingTraderPhil

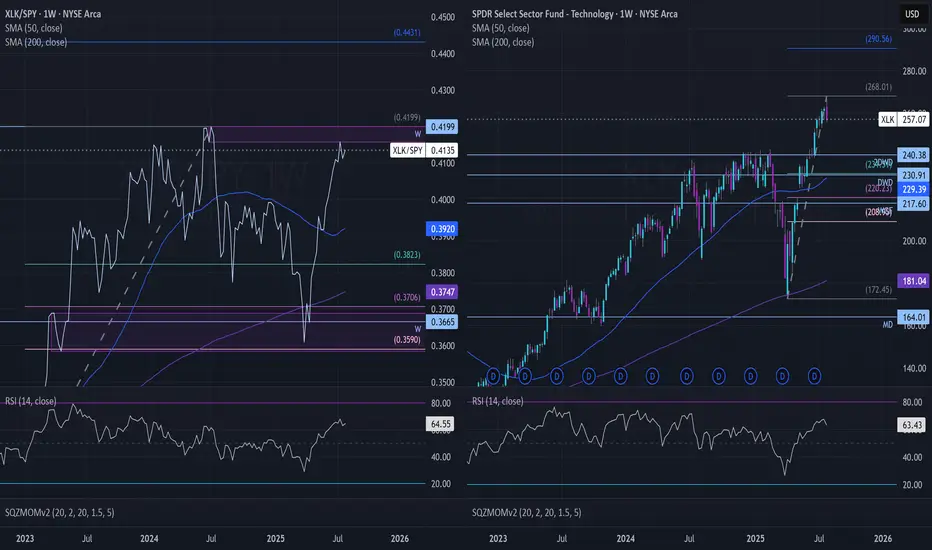
XLK Relative Strength – Leaders Extended, Rotation Risk BuildingXLK has been one of, if not the strongest sectors on a relative basis since bottoming at the end of March. Despite its relative strength, top SXLK holdings are into areas where profit-taking looks to be occurring, and a rotation out may be taking place (see Weekly Supply zone on RS chart 0.4157-0.4199).
This comes as NASDAQ:NVDA , NASDAQ:MSFT , NASDAQ:AVGO , and NASDAQ:INTU are into -0.236 fib. extensions. NYSE:ORCL and NASDAQ:PLTR show a similar picture, with NYSE:ORCL reaching the 1.618 extension, while NASDAQ:PLTR failed to reach its 1.618 extension at $162.05.
Weak:
$APPL, NYSE:CRM , NYSE:IBM , and NYSE:NOW are among the weakest performers. If $APPL doesn’t hold around $200.00, look for it to slump to the $170.00 area.
Trades:
Look for NASDAQ:AMAT to hold around $169.46 for a move to $205.06 (Weekly Supply) or $243.40 (Monthly supply). If NASDAQ:AMAT fails to hold the $169.46 print, expect a move to $156.75.
Look for NASDAQ:QCOM to hold $145.20 (Weekly) for a move to the $172.23 area (Weekly Supply).
Look for NASDAQ:ADBE to hold $329.30 for a move to $449.40 (could top out around $417.30 depending on buying volume).
Look for NYSE:ACN to hold $250.00 (Weekly), or I like it better a $218.32 (Monthly Demand).
Featured Chart:
Look for NYSE:APH to hold $100.71 (Daily close on 07/23) for a move up to $116.00-$116.50 area. If NYSE:APH fails to hold around the $100.00 mark, I’d expect a move below $95.00.
AMEX:XLK move down to $240.38?
Let me know your thoughts for or against any of these names in the comments.
XETR:AMEX :
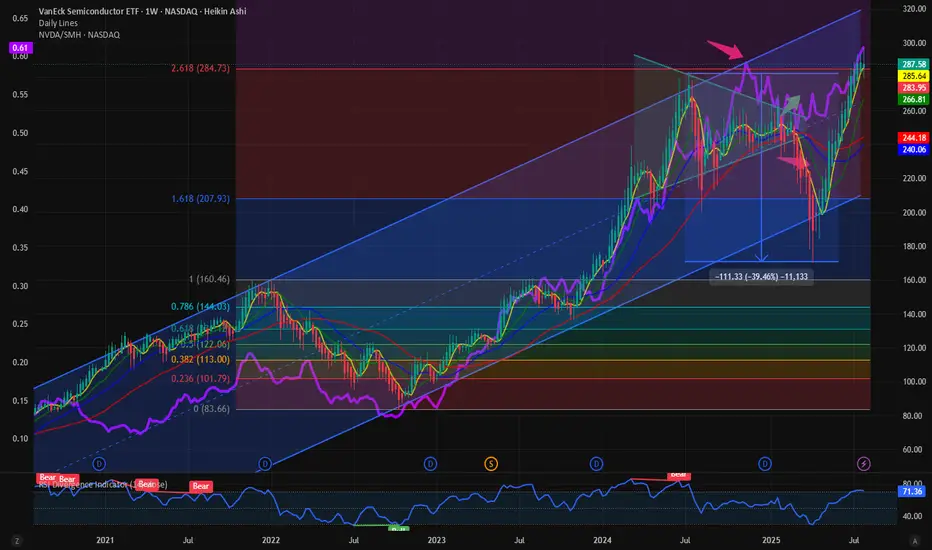
$NVDA Dominance to 65%: Trajectory is right path might be bumpy.First, I have to say its good to be back among friends after a summer break. A lot has happened in the meantime. In the TradFi and Crypto Markets stuffs are making ATH, and we are in a full-fledged bull market which is third year in the making. History is in favor of us. So, let’s look at the stuffs making new highs and the relative performance. Because relative performance tells us a lot about the over or underperformance, we love to look at CRYPTOCAP:BTC dominance and similarly in the TradFi space we investigate NASDAQ:NVDA Dominance a term we coined here.
My favorite is to look at the NASDAQ:NVDA / NASDAQ:SMH i.e. what percentage of NASDAQ:SMH is represented by $NVDA. We predicated in this space that NASDAQ:NVDA Dominance will touch 65% and NASDAQ:NVDA will first touch 170$.
NASDAQ:SMH and NASDAQ:NVDA Dominance: Some more room to run for both for NASDAQ:SMH by RabishankarBiswal — TradingView
We have blown past our July end target in NASDAQ:NVDA , hence our year end target of 240$ looks achievable. The price target in NASDAQ:SMH of 315 looks more achievable than before. But will this be a straight-line form here. My expectation is that with NASDAQ:SMH @2.61 Fib retracement level with price @ 285 it will go through temporary consolidation before it can resume its upward trajectory with NASDAQ:NVDA doing the heavy lifting. The next catalyst is NASDAQ:NVDA earning on Aug 28.
Verdict: NASDAQ:SMH might go through consolidation here. Year-end targets remain intact: NASDAQ:SMH @ 315 $ and NASDAQ:NVDA @ 240 $ with NASDAQ:NVDA Dominance @ 65%.