USOIL H4 | Bearish Continuation SetupUSOIL is rising towards the sell entry which is an overlap resistance that aligns with hte 50% Fibonacci retracement and could reverse from this level to the downside.
Sell entry is at 60.40, which is an overlap resistance that lines up with he 50% Fibonacci retracement.
Stop loss is at 61.91, which is a pullback resistance.
Take profit is at 57.63, whichis a pullback support.
High Risk Investment Warning
Trading Forex/CFDs on margin carries a high level of risk and may not be suitable for all investors. Leverage can work against you.
Stratos Markets Limited (tradu.com/uk ):
CFDs are complex instruments and come with a high risk of losing money rapidly due to leverage. 65% of retail investor accounts lose money when trading CFDs with this provider. You should consider whether you understand how CFDs work and whether you can afford to take the high risk of losing your money.
Stratos Europe Ltd (tradu.com/eu ):
CFDs are complex instruments and come with a high risk of losing money rapidly due to leverage. 66% of retail investor accounts lose money when trading CFDs with this provider. You should consider whether you understand how CFDs work and whether you can afford to take the high risk of losing your money.
Stratos Global LLC (tradu.com/en ):
Losses can exceed deposits.
Please be advised that the information presented on TradingView is provided to Tradu (‘Company’, ‘we’) by a third-party provider (‘TFA Global Pte Ltd’). Please be reminded that you are solely responsible for the trading decisions on your account. There is a very high degree of risk involved in trading. Any information and/or content is intended entirely for research, educational and informational purposes only and does not constitute investment or consultation advice or investment strategy. The information is not tailored to the investment needs of any specific person and therefore does not involve a consideration of any of the investment objectives, financial situation or needs of any viewer that may receive it. Kindly also note that past performance is not a reliable indicator of future results. Actual results may differ materially from those anticipated in forward-looking or past performance statements. We assume no liability as to the accuracy or completeness of any of the information and/or content provided herein and the Company cannot be held responsible for any omission, mistake nor for any loss or damage including without limitation to any loss of profit which may arise from reliance on any information supplied by TFA Global Pte Ltd.
The speaker(s) is neither an employee, agent nor representative of Tradu and is therefore acting independently. The opinions given are their own, constitute general market commentary, and do not constitute the opinion or advice of Tradu or any form of personal or investment advice. Tradu neither endorses nor guarantees offerings of third-party speakers, nor is Tradu responsible for the content, veracity or opinions of third-party speakers, presenters or participants.
Oil

Crude oil's trend continues to oscillate downwardCrude oil has been oscillating downward in the short term, touching 57.7. The moving average system is diverging downward and suppressing oil prices, with the objective short-term trend direction being bearish.
In the early session, oil prices rebounded from the bottom, but the momentum was relatively weak. The MACD indicator is operating below the zero line, and bearish momentum still dominates. It is expected that crude oil will mainly trade with an oscillating downward trend during the day.
Sell 58.8
TP 57.80
SL 59.40
Daily-updated accurate signals are at your disposal. If you run into any problems while trading, these signals serve as a reliable reference—don’t hesitate to use them! I truly hope they bring you significant assistance

Oil market sentiment remains bearish near termOil market sentiment remains bearish near term
Oil prices slipped as supply glut fears and renewed U.S.–China trade tensions weighed on sentiment.
The IEA projected a potential 4 million bpd surplus in 2026, citing rising OPEC+ output and weak demand. Massive oil volumes in transit and storage are expected to reach key hubs soon, adding to oversupply pressure.
Trade friction between Washington and Beijing intensified after new tariff threats and export curbs, raising concerns over slower global growth and lower energy demand.
Analysts note that geopolitical risk has faded, shifting focus to inventory data. Traders await U.S. crude and gasoline stock reports due Oct. 15, with expectations of a 200,000-barrel rise in crude inventories and draws in fuel products.
Outlook:
Market sentiment remains bearish near term, with weak demand signals and high supply overshadowing minor geopolitical support.

Why Oil’s Drop Fuels a Global Risk-Off SentimentWTI Crude Oil Monthly Technical Outlook: Below $60 and the Broader Market Implications
As the fourth quarter of 2025 unfolds, the WTI Crude Oil (USOIL) chart offers a critical perspective on the state of global supply-demand balance and its broader impact on market sentiment. Trading near $58.5 per barrel, oil prices have fallen below a key psychological threshold, and while the move may seem technical at first, its implications reach far beyond the energy market.
The combination of weakening momentum indicators, rising supply projections, and softening global demand paints a nuanced but important story: oil’s slide below $60 is no longer just a chart event, it’s a macro signal about global growth, supply dynamics, and investor positioning.
Technical Overview: Momentum Loss Deepens
The monthly chart for WTI shows a clear picture of fatigue after multiple failed rebound attempts over the past 18 months. Since peaking near $130 in early 2022, prices have formed a persistent pattern of lower highs and lower lows, reflecting an extended process of distribution.
In recent months, WTI has failed to sustain moves above $70, with sellers consistently stepping in on rallies. The October bar extended losses toward the $58 level, marking the weakest monthly close since mid-2023.
Structurally, this decline puts WTI in a critical support zone between $55 and $57, which coincides with the base that previously stabilized prices in late 2023. Should this zone fail, the next major support rests around $50 per barrel, aligning with a key Fibonacci retracement of the 2020–2022 rally.
On the upside, the resistance band remains in the $65–$68 range, a descending trendline that has capped every rebound since early 2024. A decisive monthly close above that zone would be the first confirmation of renewed strength, but momentum indicators are still leaning toward continued weakness or sideways consolidation.
MACD and Stochastic RSI: Weakening Momentum Signals
The MACD (12,26,9) indicator remains subdued below the zero line, underscoring a prolonged loss of upside momentum. The histogram has recently turned red again, indicating that the MACD line may cross below the signal line, a potential confirmation that sellers still control the trend.
Meanwhile, the Stochastic RSI, which measures RSI velocity, has rolled over from midrange levels and is pointing lower again. Its failure to sustain a rebound above 50 shows that bullish energy has faded.
If this oscillator drops below 30, it would confirm a continuation of weak-to-neutral price action through the rest of Q4. Historically, such conditions precede prolonged consolidation phases, where volatility contracts before a new trend forms.
Together, these indicators portray a market not in full capitulation, but clearly lacking conviction for an upside breakout.
Fundamental Picture: Oversupply Meets Slowing Demand
While technical signals reveal a loss of momentum, the fundamental backdrop provides stronger clues about why oil has struggled to maintain value above $60. Recent data from major energy agencies, including the International Energy Agency (IEA), the U.S. Energy Information Administration (EIA), and multiple Reuters reports, converge on one central theme:
the global oil market is entering a surplus phase, with supply growth outpacing demand.
Large Oversupply Projections
Read full analysis on my website
darrismanresearch com
WTI Crude Oil: What Could Happen Next?Oil prices are sitting at a really important spot right now. Here’s what to watch for:
If the price drops below $58.28, it could keep falling toward $50.
If it breaks below $50, we might see it slide into the $43–$46 range.
But if oil climbs back above $65, it could run up toward $74 again.
So in simple terms:
👉 Below $58 = could fall more
👉 Above $65 = could rise again
We’re in a “wait and see” zone ; the next move will show which way oil really wants to go.
If you’re watching this market and not sure what these levels mean for your trades, feel free to DM us ; happy to break it down in plain English or share how I’m looking at it myself.
Mindbloome Exchange

Will US–China trade tensions continue to weigh on oil prices?
Deepening US–China trade tensions ahead of the APEC summit are putting downward pressure on oil prices. China’s Commerce Ministry announced sanctions on five US subsidiaries of Hanwha Ocean and imposed new port fees on American vessels.
Meanwhile, President Trump accused Beijing of deliberately halting soybean purchases to pressure US farmers and warned of possible retaliatory measures, including ending trade in edible oils and other sectors.
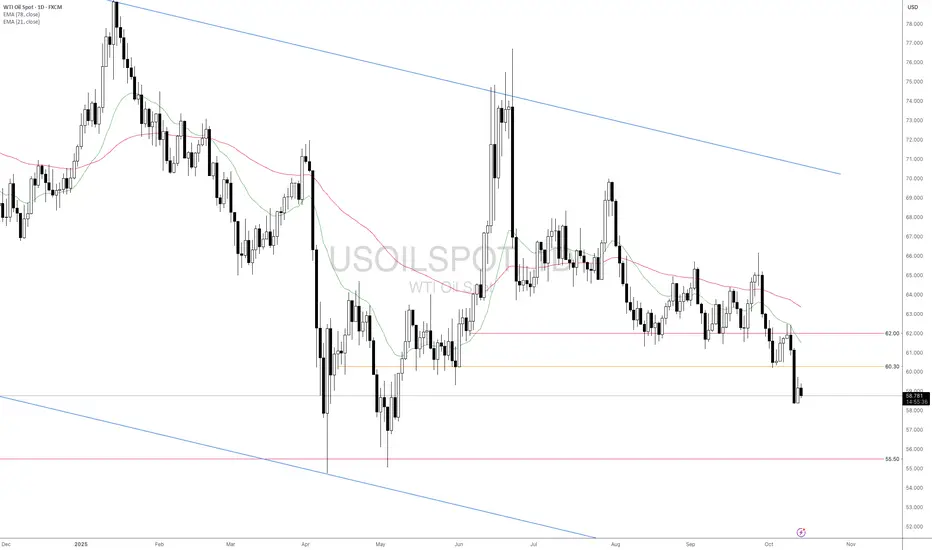
USOIL extended its downtrend, falling below 60.00, with diverging bearish EMAs indicating a possible continuation of bearish momentum. If USOIL fails to close above 60.00, the price may retreat below 57.00. Conversely, if USOIL breaches above 60.00 and EMA21, the price may advance toward 62.00.

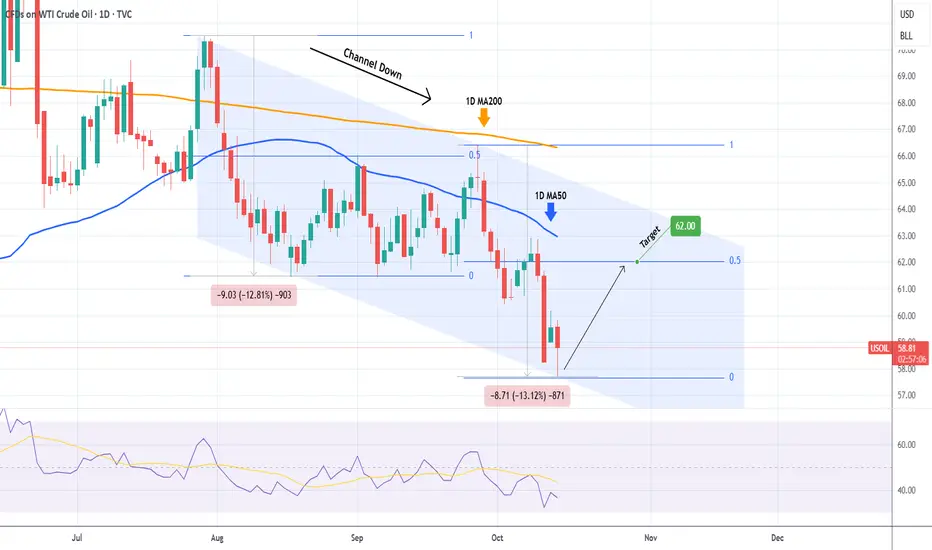
WTI OIL hit the Channel Down bottom. Buy Signal.WTI Oil (USOIL) has been trading within a Channel Down since the July 30 High and today it hit its bottom (Lower Lows trend-line). The decline from the recent Lower High was around -13%, similar to the previous Bearish Leg.
When that bottomed (Lower Low), it rebounded towards its 1D MA50 (blue trend-line) and peaked (Lower High) marginally above the 0.5 Fibonacci retracement level. As a result, we expect a new Bullish Leg to start now, with our Target at $62.00.
-------------------------------------------------------------------------------
** Please LIKE 👍, FOLLOW ✅, SHARE 🙌 and COMMENT ✍ if you enjoy this idea! Also share your ideas and charts in the comments section below! This is best way to keep it relevant, support us, keep the content here free and allow the idea to reach as many people as possible. **
-------------------------------------------------------------------------------
💸💸💸💸💸💸
👇 👇 👇 👇 👇 👇
LONG ON USOILOIL has give us a nice (CHOC) change of character to the upside from a major demand area.
I will be buying oil looking to catch 300-400 pips.

Crude Oil: Support zone is seen around 54-57Crude oil continues to refresh its low. As mentioned earlier, once the 61.3 watershed level is broken, the downward space will open up. Currently, the support zone is around 54-57, which is a suitable level to consider establishing long positions. For short-term trades, go short on a rebound after a new low is made—focus on short entries at 58.60 and add to short positions at 59.20.
Daily-updated accurate signals are at your disposal. If you run into any problems while trading, these signals serve as a reliable reference—don’t hesitate to use them! I truly hope they bring you significant assistance

USOIL LONG FROM SUPPORT
USOIL SIGNAL
Trade Direction: long
Entry Level: 58.07
Target Level: 63.04
Stop Loss: 54.76
RISK PROFILE
Risk level: medium
Suggested risk: 1%
Timeframe: 9h
Disclosure: I am part of Trade Nation's Influencer program and receive a monthly fee for using their TradingView charts in my analysis.
✅LIKE AND COMMENT MY IDEAS✅

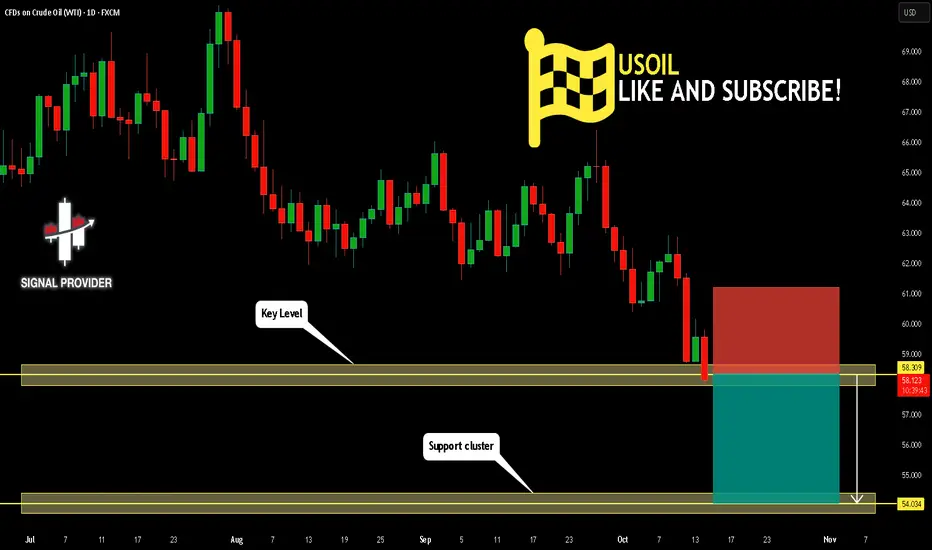
USOIL Will Go Lower From Resistance! Short!
Take a look at our analysis for USOIL.
Time Frame: 1D
Current Trend: Bearish
Sentiment: Overbought (based on 7-period RSI)
Forecast: Bearish
The price is testing a key resistance 58.309.
Taking into consideration the current market trend & overbought RSI, chances will be high to see a bearish movement to the downside at least to 54.034 level.
P.S
We determine oversold/overbought condition with RSI indicator.
When it drops below 30 - the market is considered to be oversold.
When it bounces above 70 - the market is considered to be overbought.
Like and subscribe and comment my ideas if you enjoy them!
USOIL Pressured by Trade Tensions and Oversupply Concerns
Fundamental approach:
- USOIL prices declined this week, pressured by renewed US-China trade tensions and persistent concerns about oversupply.
- USOIL fell following President Trump's threat of additional 100% tariffs on Chinese goods, starting 1 Nov, which reignited fears of reduced global energy demand from the world's largest consumers.
- In addition, easing Middle East tensions removed risk premiums, capping gains. OPEC+ is continuing its production increases, with the group adding 137k bpd in Nov.
- US crude inventories also rose by 3.7 mln barrels in early Oct, exceeding analyst expectations and reinforcing concerns about a supply glut.
- Prices may face further downward pressure as global inventory builds are expected to average 2.6 mln barrels per day through 4Q. However, any progress in US-China trade negotiations or unexpected supply disruptions from Eastern Europe could provide upside support.
Technical approach:
- USOIL strongly declined after retesting EMA21. The price created lower swings, indicating bearish momentum persists.
- If USOIL remains below the resistance at 60.30, the price may continue to decline toward the following support at 55.50.
- On the contrary, closing above 60.30 may prompt a further correction to retest the following resistance at 62.00.
Analysis by: Dat Tong, Senior Financial Markets Strategist at Exness
WTI (Crude Oil) — Bullish Bat in ProgressOANDA:WTICOUSD
A bullish Bat pattern is currently forming, with a potential completion near $57.86 — the 88.6% Fibonacci retracement of the prior leg.
If the pattern confirms, it could trigger a bullish move toward $65.70, aligning with the 38.2% retracement level.
Price action around $57–58 will be key — watch for reversal confirmation, as momentum divergence before validating long positions.

Crude oil: Bearish sentiment is expectedCrude oil finally broke below the strong support level of 61 in the late trading session last week. Once this level is breached, it opens up new downside room. Crude oil remains bearish this week; if there is a rebound, we can continue to take short positions, with minor resistance around the 61.30 level.
Sell 60.50 TP 59.00 - 57.00 SL 61.3
Daily-updated accurate signals are at your disposal. If you run into any problems while trading, these signals serve as a reliable reference—don’t hesitate to use them! I truly hope they bring you significant assistance

WTI Crude Oil – Elliott Wave Analysis🛢️ WTI Crude Oil – Elliott Wave Analysis
Wave Structure · Smart Money · Fib Confluence · Price Action
🔎 Market Context & Overview
WTI Crude Oil remains one of the most critical and closely watched commodities in the global market. After decades of dramatic price swings driven by geopolitical events, supply shocks, and evolving demand patterns, the market now appears poised at a pivotal juncture. Combining Elliott Wave theory , Smart Money Concepts , Fibonacci retracements & extensions , and price action analysis with fundamental macro insights reveals a compelling narrative: Crude is concluding a prolonged corrective phase and preparing for a significant breakout. This analysis breaks down each wave, highlighting key technical and fundamental factors shaping the future trajectory of oil prices.
🔹 Wave 1 – Early Impulse (1970s–1985)
📉 Technicals: Formed the foundational uptrend post-oil embargo.
🧠 SMC: Accumulation following global inflation shock.
📊 Fib: Initial rally; shallow extension, not impulsive in character.
🌍 Macro: Oil embargo, inflation, and a restructuring of global energy markets gave birth to this initial move.
🔹 Wave 2 – Complex Correction (1985–1999)
🔁 Technicals: Multi-decade W-X-Y corrective pattern, fully retracing Wave 1.
🧠 SMC: Smart Money accumulation masked by long-term bearish structure.
📊 Fib : Deep correction toward 78.6%, classic for Wave 2.
🌐 Macro: OPEC instability, Gulf War, rising non-OPEC supply, and suppressed demand through globalization.
🔹 Wave 3 – Supercycle Rally (1999–2008)
🚀 Technicals: Powerful impulsive rally, achieving 1.618 Fib extension of Wave 1.
🧠 SMC: Clear Break of Structure (BoS) in early 2000s; institutions led the markup.
📊 Fib: Ideal third-wave behavior — extended and directional.
📈 Macro: China-led supercycle, supply bottlenecks, geopolitical conflict, and a commodities renaissance pushed oil to $147.27.
🔹 Wave 4 – Still In Progress (2008–2026 est.)
🔄 Technicals: Long, complex W-X-Y-X-Z or potential triangle; entering final E-leg now.
🧠 SMC: Liquidity grabs during COVID (2020) and 2022–24 highs; Smart Money sweeping both ends.
📊 Fib: Final leg projected to terminate near 0.5 retracement of Wave 3 (~$47.55).
🔍 Price Action: Distribution in 2011–14, liquidation in 2020, false rallies, and compression since 2022.
🧨 Macro: GFC aftermath, shale oversupply, COVID demand crash, ESG underinvestment. Currently driven by energy policy chaos and geopolitical rebalancing.
⏳ Wave 4 is near completion , with the final move expected to tag the 0.5 retracement before reversal.
🔹 Wave 5 – Upcoming Macro Breakout (2026–2032 est.)
⚡ Technicals: Expected impulsive breakout wave toward price discovery.
🧠 SMC: Anticipate Break of Structure (BoS) above $147 for confirmation of markup phase.
📊 Fib: Target zone between previous high ($147) and 2.618 extension (~$366.58).
🔥 Macro: Long-term underinvestment, peak cheap oil, geopolitical tension (Russia, Middle East), energy transition bottlenecks. Inflation & policy shifts will add fuel.
📍 This is the final leg of the cycle and could mirror or even exceed the explosiveness of Wave 3 due to multi-decade supply-demand imbalances.
✅ Final Summary
Crude Oil is completing its Wave 4 correctio n, expected to bottom around $47.55 — the 0.5 retracement of Wave 3 . The corrective structure is nearly exhausted, showing signs of Smart Money accumulation and multi-leg exhaustion. Once Wave 4 completes, a powerful Wave 5 is expected to begin, targeting $195–$366 , driven by macro energy scarcity, inflation, and long-term capital flow back into commodities.
This is a strategic inflection zone — where technical compression meets macro ignition.
"Master the waves, follow the smart money, and let Fibonacci guide your path to consistent trading success." — FIBCOS
#WTICrudeOil #ElliottWave #Fibonacci #SmartMoneyConcepts #WaveTheory #TechnicalAnalysis #TradingStrategy #OilTrading #CommodityAnalysis #MarketCycles #PriceAction

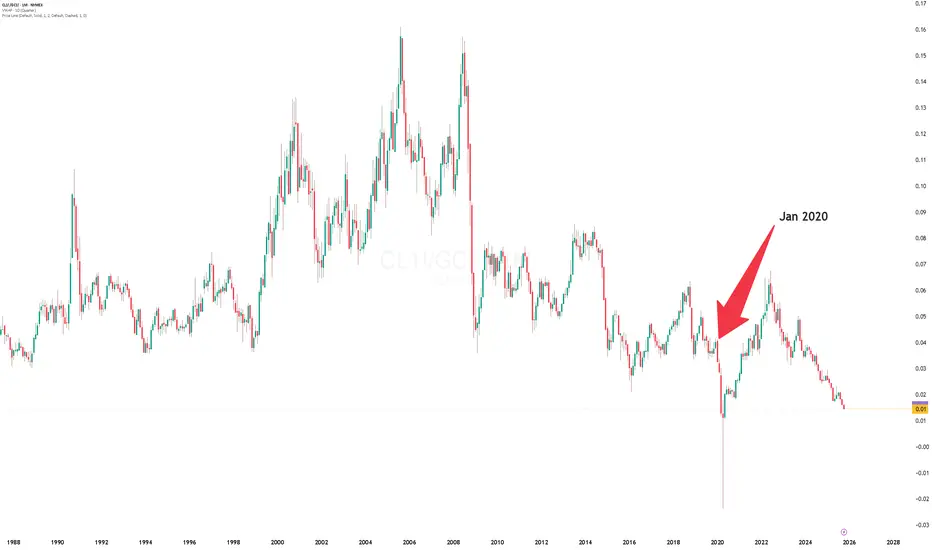
Oil/ Gold relative value chart. Back to early pandemic levels of value here, no doubt driven by outstanding gold performance.
USOIL: Check lower levels after breaking out of the rangeThis is my previous analysis — feel free to take a look for reference.
OIL PRICE OUTLOOK
(Week of Oct 06 - 10, 2025)
1. Institutional Forecast Updates
● IEA (Sep 15, 2025):
WTI targets $64.2/bbl for 2025 and $47.8/bbl for 2026
Brent targets $68/bbl for 2025 and $51/bbl for 2026
● Goldman Sach (Jul 14, 2025):
WTI targets $63/bbl for H2 2025 and $52/bbl for 2026
Brent targets $64/bbl for H2 2025 and $56/bbl for 2026
● J.P. Morgan (May 16, 2025):
WTI targets $63/bbl for H2 2025 and $52/bbl for 2026
Brent targets $64/bbl for H2 2025 and $56/bbl for 2026
www.rigzone.com
www.reuters.com www.jpmorgan.com
2. Key Drivers & Risks
🔹 Updates on Supply–Demand and Geopolitical News
OPEC+ announced a milder-than-expected production increase of around 137 kb/d for November, leaving the oversupply outlook through 2026 largely unchanged.
Geopolitical tensions in the Red Sea / Gulf of Aden have flared up again.
U.S. inventories and weekly data: API estimated a draw of 3.7 mb (Sep 26), while recent EIA reports have shown mixed, inconsistent trends.
Market consensus: Reuters’ latest survey keeps the Brent forecast at ~$67.6/bbl for 2025, unchanged from last month, with expectations for lower prices around $60 in 2025 and further weakness into 2026.
🔹 Watchlist for Next Week
Official details on OPEC+’s November production implementation
API / EIA weekly U.S. oil data
Maritime security developments
Any notable demand-side signals
🔹 Overall View
Governments appear to favor keeping oil prices lower to support economic growth, though current levels are near or below breakeven for many producers.
Oil prices are expected to gradually decline within a relatively narrow range of $70–$50, while potential supply–demand shocks remain key factors to monitor for any sharp volatility.
3. Technical Analysis
* Trend: assessed using at least three trend indicators, with market structure as the primary guide.
** Weak or Reversal Signals: Assessed based on one of our criteria for trend reversal signals.
*** Support/Resistance: Selected from multiple factors – static (Swing High, Swing Low, etc.), dynamic (EMA, MA, etc.), psychological (Fibonacci, RSI, etc.) – and determined based on the trader’s discretion.
**** Our advice takes into account all factors, including both fundamental and technical analysis. It is not intended as a profit target. We hope it can serve as a reference to help you trade more effectively. This advice is for informational purposes only and we assume no responsibility for any trading results based on it.
Please like and comment below to support our traders. Your reactions will motivate us to do more analysis in the future 🙏✨
George Vann @ ZuperView
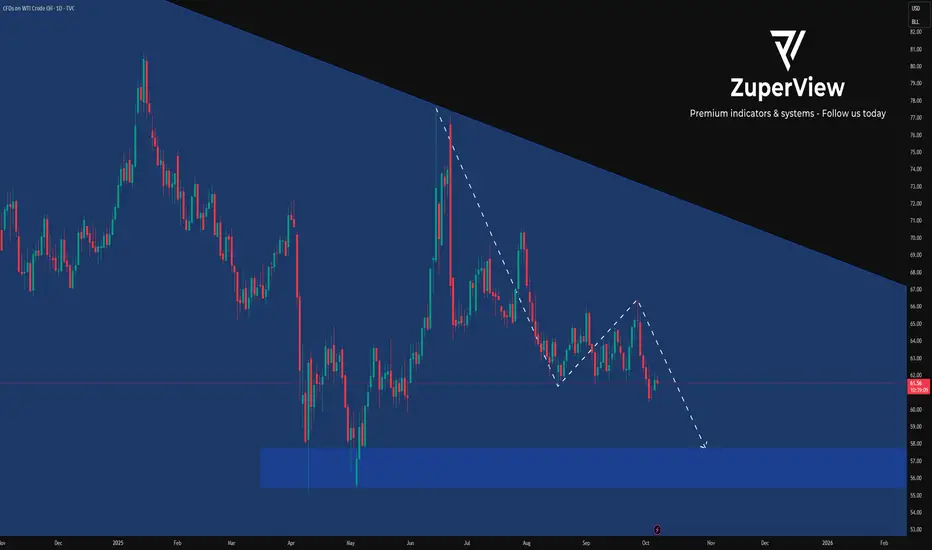
US OilCrude Oil
- Consolidation Phase
- Break of Structure
- Bearish Channel as an corrective pattern in Short Time Frame
- Order Block
- Resistance Level
XTI/USD Chart Analysis: Oil Price Falls Below $60XTI/USD Chart Analysis: Oil Price Falls Below $60
Friday’s comments from President Trump about the potential introduction of 100% tariffs on trade with China pushed WTI crude oil below the $60 level for the first time in four months. The bearish sentiment stemmed from fears of a global economic slowdown amid escalating trade tensions between the world’s two largest economies.
The decline was further supported by news of peace efforts in the Middle East, which reduced the impact of geopolitical risk on oil prices.
As the XTI/USD chart shows, WTI is currently trading below $60. How might the situation unfold next?
Technical Analysis of the XTI/USD Chart
In the long-term view, oil price movements (following the flare-up in the Middle East in June) have formed a descending channel shown in red — notably, the current price has fallen below its lower boundary.
In the shorter term, we can observe an acceleration of the decline, emphasised by the purple trajectory lines.
These observations suggest that selling pressure remains dominant, while any recovery attempts are likely to meet resistance near:
→ the psychological level of $60;
→ the lower boundary of the red channel;
→ the purple median line.
Given that the White House is reportedly in favour of lower oil prices (as a means of stimulating the US economy and exerting pressure on geopolitical rivals), WTI crude could drift towards the year’s low around $55.
However, from the demand-side perspective, it cannot be ruled out that the oil market, known for its false breakouts above previous highs (A, B, C), may repeat a similar move above peak D — a pattern that, in Smart Money Concept terms, would represent a liquidity grab.
This article represents the opinion of the Companies operating under the FXOpen brand only. It is not to be construed as an offer, solicitation, or recommendation with respect to products and services provided by the Companies operating under the FXOpen brand, nor is it to be considered financial advice.

Hellena | Oil (4H): SHORT to support area of 58.884Colleagues, it appears that the downward movement is not over and I see several reasons to continue to look short.
The higher order wave “C” is looking to complete the correction and I expect the start of the middle order wave “3” to see the low update and reach the support area at 58.884.
Fundamental context
Oil remains under pressure as supply increases and demand outlook weakens. OPEC+ decided to slightly raise output for November, while U.S. inventories keep growing. Crude lost about 8% last week, and EIA now expects lower prices by the end of the year — all of which supports the idea of a continued downside move within wave “3” toward the 58.884 support area.
Manage your capital correctly and competently! Only enter trades based on reliable patterns!

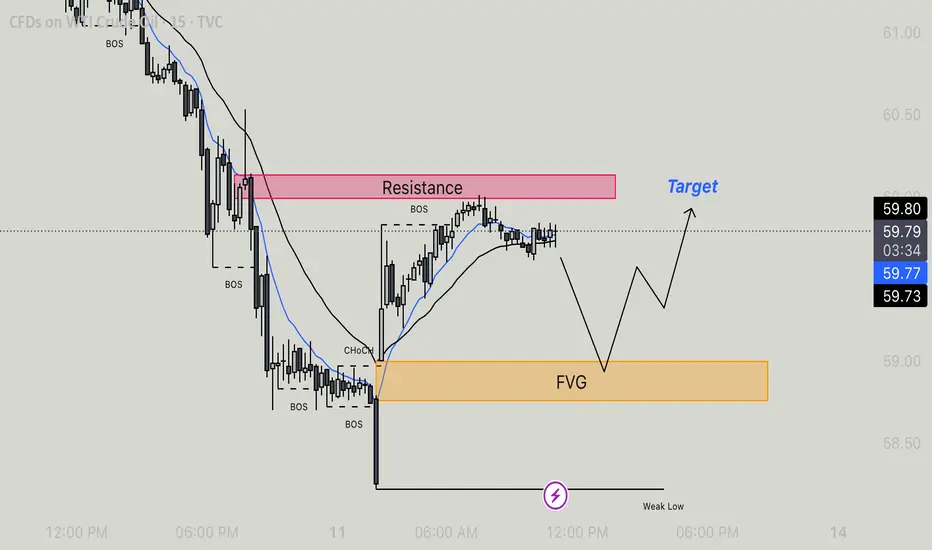
Usoil - Retracement to FVG Before Bullish ContinationMarket Structure & Key Levels
Resistance Zone: Price reacted from this supply area, showing short-term rejection after BOS (Break of Structure) to the upside.
FVG (Fair Value Gap): Price is expected to retrace into this imbalance zone for demand before resuming higher. Watch for bullish price action here.
Weak Low: If price breaks this low, the bullish scenario becomes invalid and deeper downside may follow.
Structure Highlights:
BOS (Break of Structure): Several BOS points confirm previous bearish trend and recent short-term bullish correction.
CHoCH (Change of Character): Marked at the base of reversal near FVG zone, indicating possible trend shift.
EMA Confluence: Price hovering around short EMAs, showing possible slowdown and setup for a pullback.
Trade Scenario
Expected Move:
Price could retrace to the FVG zone (imbalance fill) before a bounce.
From there, bullish momentum may resume toward the target zone above resistance.
Bullish Confirmation:
Look for price to tap into the FVG, form bullish structure (e.g., BOS, CHoCH), and engulfing patterns or lower-timeframe entries.
Target would be near recent highs or break above resistance at ~$59.90–60.00.
Invalidation:
Break below the Weak Low would invalidate this bullish setup and open room for further downside.
BRIEFING Week #41 : Havoc on CryptosHere's your weekly update ! Brought to you each weekend with years of track-record history..
Don't forget to hit the like/follow button if you feel like this post deserves it ;)
That's the best way to support me and help pushing this content to other users.
Kindly,
Phil

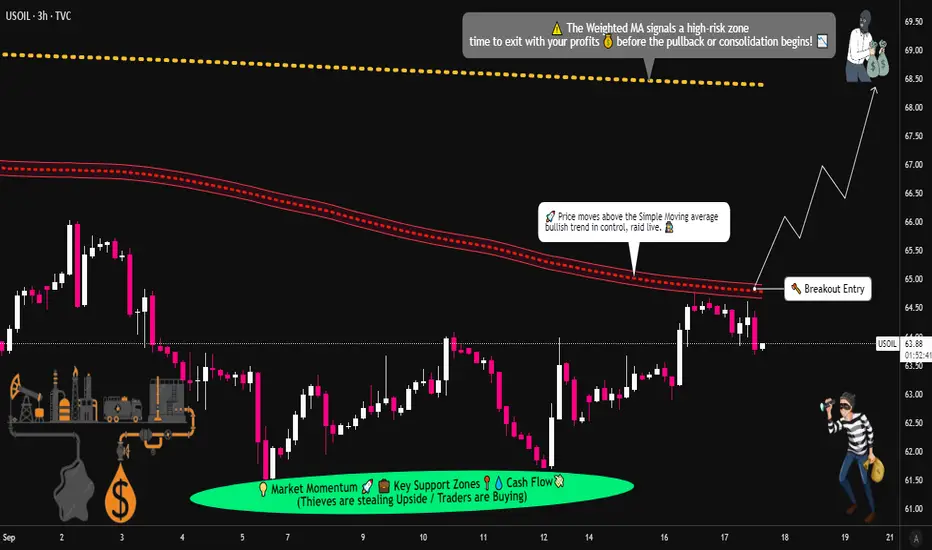
Can USOIL Break Higher? SMA Breach & Target at $68🛢️ USOIL Energy Market | Cash Flow Management Strategy (Swing/Day Trade)
📌 Trading Plan:
👉 Bias: Bullish (pending order setup)
👉 Confirmation: When Simple Moving Average (SMA) is breached by buyers, trend confirmation is valid.
👉 Entry Style: Layered buy-limit entries after breakout confirmation (Thief Strategy 🕵️♂️ = multi-layer entry).
📥 Layered Buy Limit Orders (example setup):
64.00 ✅
64.50 ✅
65.00 ✅
65.50 ✅
(You can increase the number of layered entries based on your own style — flexibility is the thief’s edge!)
⚠️ Important: Buy-limit layers are only valid AFTER breakout confirmation. Do not jump in without confirmation.
🎯 Risk Management (SL & TP):
📌 Stop Loss (Protective Level)
Example stop placement: 63.50
(🔑 Note: This is my style. Manage risk in your own way — never copy-paste without adapting!).
📌 Target Zone
Projected resistance near 68.00, aligned with:
Weighted Moving Average (WMA) resistance
Overbought conditions
Possible “trap” zone ⚠️
💡 Best approach: Secure profits step by step. Escape once the target region is approached.
📢 Note for Traders (Thief OG’s):
I’m not recommending only my SL or my TP. This is just a framework. You’re responsible for your own money management, profits, and exits. Trade at your own risk, and take the bag when you feel it’s right. 💰
🔗 Correlation & Related Pairs to Watch:
Energy markets are heavily correlated across multiple assets:
🛢️ TVC:USOIL / BLACKBULL:WTI – Main setup
🛢️ BLACKBULL:BRENT – Moves in sync with USOIL, watch for confirmation
💵 TVC:DXY – Stronger USD often pressures crude oil prices
💹 AMEX:XLE (Energy Sector ETF) – Tracks US energy stocks, gives indirect flow confirmation
🪙 FX:NGAS – Energy sector cousin, can sometimes give early signals of demand shifts
Keep an eye on these related pairs/assets for flow confirmation and stronger conviction.
🧾 Key Points Recap:
✔️ SMA breach = buyers’ control confirmed
✔️ Layered entries (Thief Strategy 🕵️♂️)
✔️ Stop loss = personal choice (mine @63.50)
✔️ Target = 68.00 escape zone
✔️ Risk & reward = your own responsibility
✔️ Watch related assets for confirmation
✨ “If you find value in my analysis, a 👍 and 🚀 boost is much appreciated — it helps me share more setups with the community!”
#USOIL #WTI #CrudeOil #EnergyMarkets #SwingTrade #DayTrade #TradingStrategy #PriceAction #ThiefStrategy #LayeredEntries #XLE #BRENT #DXY #NGAS