USOIL : Full analysisHello friends
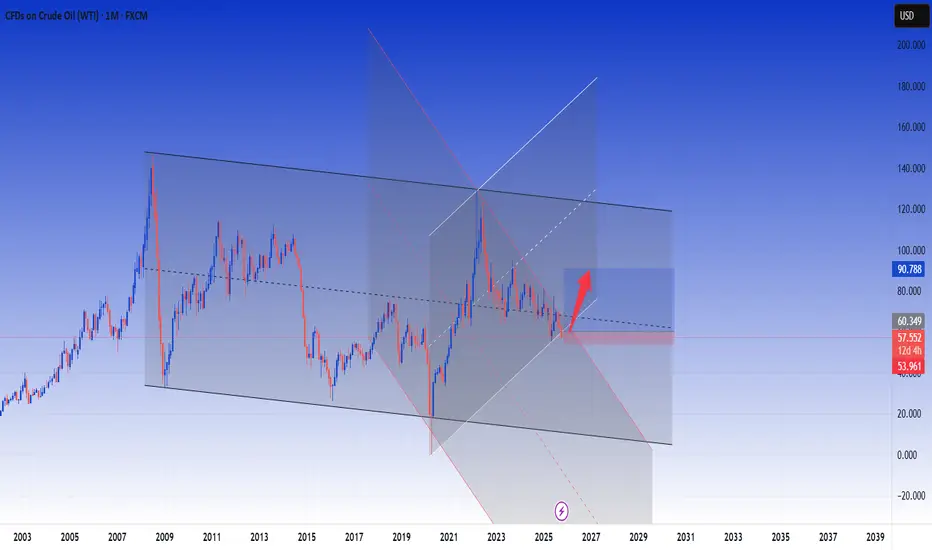
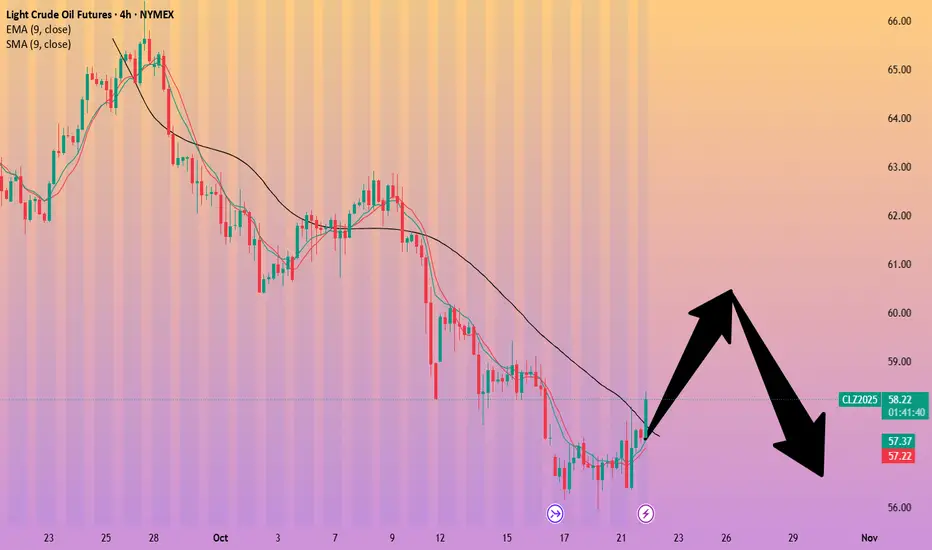
Well, considering the sharp decline we had, the price has entered a descending channel and is slowly going down in this channel.
Now the price has reached a critical point, namely the bottom of the channel.
We need to see if buyers will support the price at the bottom of the channel like the previous two times or not?
If we do not see support from buyers and the channel is broken, we can expect lower prices.
56.30 and 53 dollars respectively.
But we will most likely see buyers' support in this area and the price could even reach the channel ceiling.
*Trade safely with us*
Oil


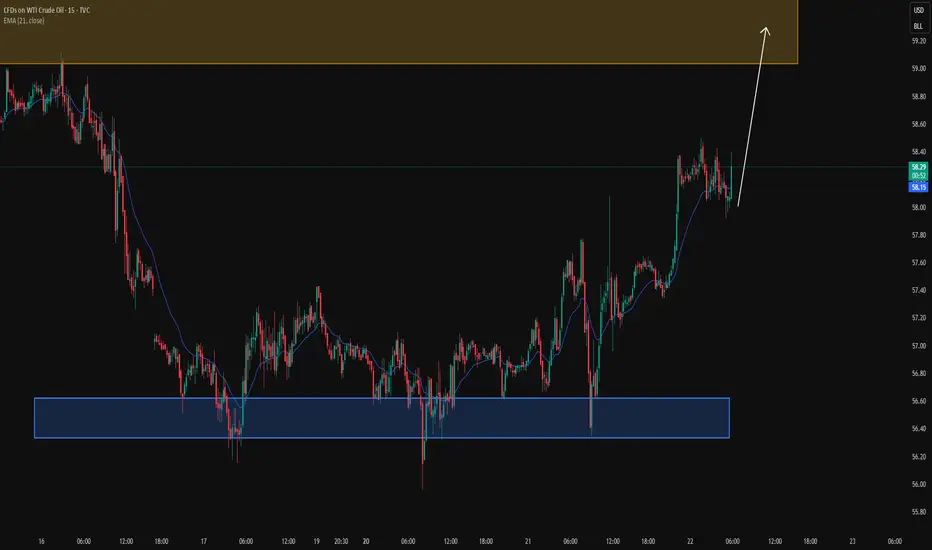
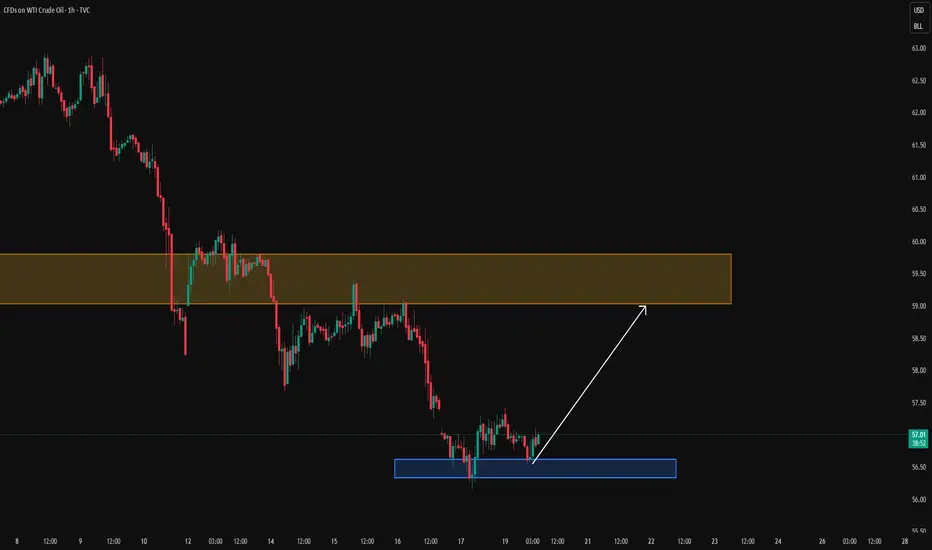
Oil - Expecting Bullish Continuation In The Short TermM15 - Strong bullish momentum.
No opposite signs.
Until the two Fibonacci support zones hold I expect the price to move higher further.
If you enjoy this idea, don’t forget to LIKE 👍, FOLLOW ✅, SHARE 🙌, and COMMENT ✍! Drop your thoughts and charts below to keep the discussion going. Your support helps keep this content free and reach more people! 🚀
--------------------------------------------------------------------------------------------------------------------

XTI/USD : Oil Prices Rise Following Trump’s Sanctions DecisionXTI/USD Chart Analysis: Oil Prices Rise Following Trump’s Sanctions Decision
According to the XTI/USD chart, WTI crude is now trading above the key psychological level of $60, marking a sharp rebound of over 3% from October’s lows.
The surge came after U.S. President Donald Trump announced sanctions against major Russian oil producers Rosneft and Lukoil, which together account for more than 5 million barrels of oil per day.
The move is expected to reduce global oil supply; however, media outlets point out that:
→ there is no certainty that China and India will refrain from purchasing Russian crude;
→ previous sanctions introduced under the Biden administration — targeting companies such as Gazprom Neft and Surgutneftegaz — had little impact on Russian oil exports.
What could happen next?
Technical Analysis of the XTI/USD Chart
On 20 October, we noted that two descending channels had formed:
→ Red channel – a long-term pattern that developed following the Middle East escalation in June;
→ Purple channel – indicating accelerated downside pressure driven by rising OPEC+ output and hopes for a U.S.–China trade accord.
Our earlier assumption that the market was oversold and that the Falling Wedge pattern might trigger a bullish reversal proved correct (as shown by the arrow). Following the formation of an inverted head and shoulders pattern, oil prices climbed towards the median line of the purple channel.
At this stage, consolidation appears the most likely scenario, as supply and demand may stabilise around the channel’s median. Much will depend on statements from the White House, since higher oil prices could threaten U.S. inflation objectives.
However, if bullish momentum persists, WTI may continue to rise towards the next resistance area, defined by:
→ the upper boundary of the purple channel;
→ the 8–9 October highs, where a false breakout similar to the bear trap seen on 26 September cannot be ruled out.
This article represents the opinion of the Companies operating under the FXOpen brand only. It is not to be construed as an offer, solicitation, or recommendation with respect to products and services provided by the Companies operating under the FXOpen brand, nor is it to be considered financial advice.

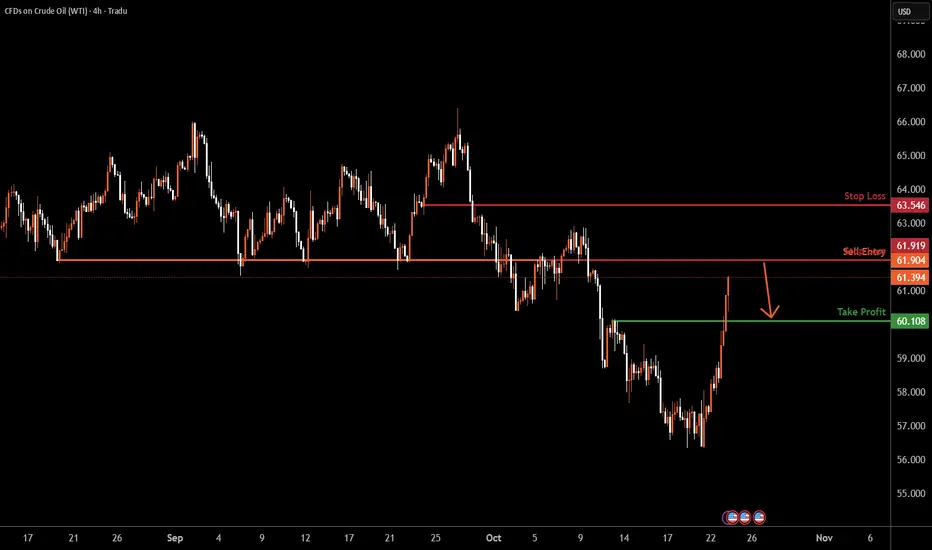
USOIL H4 | Approaching Major Resistance LevelBased on the H4 chart analysis, we could see the price rise to the sell entry which is an overlap resistance and could reverse from this levle to the take profit.
Sell entry is at 61.90, which is an overlap resistance.
Stop loss: 63.54, which is a pullbakc resistance.
Take profit is at 60.10, which is a pullback support.
Stratos Markets Limited (tradu.com ):
CFDs are complex instruments and come with a high risk of losing money rapidly due to leverage. 68% of retail investor accounts lose money when trading CFDs with this provider. You should consider whether you understand how CFDs work and whether you can afford to take the high risk of losing your money.
Stratos Europe Ltd (tradu.com ):
CFDs are complex instruments and come with a high risk of losing money rapidly due to leverage. 70% of retail investor accounts lose money when trading CFDs with this provider. You should consider whether you understand how CFDs work and whether you can afford to take the high risk of losing your money.
OIl rised.OIL moved as we had analyzed. Possibly could rise more before rhe markets closed this week.

Trading Crude Oil and the Geopolitical Impact on PricesIntroduction
Crude oil is one of the most strategically significant commodities in the global economy. It fuels transportation, powers industries, and serves as a critical input for countless products ranging from plastics to fertilizers. Because of its universal importance, crude oil trading is not just a financial endeavor—it is a reflection of global political stability, economic growth, and international relations. The price of crude oil is highly sensitive to geopolitical events, including wars, sanctions, alliances, and policy changes. Understanding how geopolitical dynamics affect oil trading and pricing is vital for traders, investors, and policymakers.
1. The Fundamentals of Crude Oil Trading
Crude oil trading involves the buying and selling of oil in various markets, primarily through futures contracts on exchanges such as the New York Mercantile Exchange (NYMEX), Intercontinental Exchange (ICE), and Dubai Mercantile Exchange (DME). These contracts allow traders to speculate on the future price of oil, hedge against risks, or facilitate physical delivery. Two main benchmark grades dominate the market: West Texas Intermediate (WTI) and Brent Crude.
WTI Crude Oil is primarily sourced from the U.S. and traded in dollars per barrel.
Brent Crude Oil is produced in the North Sea and serves as the global benchmark for pricing.
Oil prices are influenced by multiple factors, including supply and demand fundamentals, global economic growth, production levels, inventory data, transportation costs, and geopolitical events. Among these, geopolitical tensions often have the most immediate and dramatic impact.
2. Geopolitics as a Determinant of Oil Prices
The global oil market is uniquely vulnerable to geopolitical developments because a significant portion of reserves and production is concentrated in politically sensitive regions such as the Middle East, North Africa, and Russia. Around 60% of proven oil reserves lie in OPEC (Organization of Petroleum Exporting Countries) member nations, many of which have experienced conflict, sanctions, or regime instability.
Geopolitical risk refers to the potential disruption in oil supply or transportation routes due to international conflicts, political upheaval, or policy decisions. When such risks escalate, traders often bid up oil prices in anticipation of supply shortages—even before any actual disruption occurs.
3. Historical Perspective: Major Geopolitical Events and Oil Prices
a. The 1973 Arab Oil Embargo
One of the earliest and most significant examples of geopolitically driven oil price shocks occurred in 1973 when Arab OPEC members imposed an oil embargo against the United States and other nations supporting Israel during the Yom Kippur War. Oil prices quadrupled within months, leading to inflation, recession, and a global energy crisis. The embargo demonstrated the power of oil as a political weapon and the vulnerability of consumer nations.
b. The Iranian Revolution (1979)
The overthrow of the Shah of Iran and the subsequent decline in Iranian oil production reduced global supply by nearly 5%. This shortage, coupled with the Iran-Iraq War (1980–1988), sent prices soaring again. The resulting volatility highlighted how political instability in a single oil-producing nation could ripple through the entire global economy.
c. The Gulf War (1990–1991)
Iraq’s invasion of Kuwait disrupted nearly 5 million barrels per day of oil production. The U.S.-led coalition’s response and the ensuing war created massive uncertainty in the Middle East, briefly pushing oil prices above $40 per barrel—a significant level for that time.
d. The Iraq War (2003)
The U.S. invasion of Iraq reignited geopolitical fears about supply disruptions. Although global production eventually stabilized, the war contributed to sustained higher oil prices in the early 2000s, further compounded by rapid industrialization in China and India.
e. The Arab Spring (2010–2011)
The wave of protests across the Middle East and North Africa led to regime changes and unrest in key producers such as Libya and Egypt. The civil war in Libya, in particular, cut oil output by over one million barrels per day, causing Brent crude prices to exceed $120 per barrel.
f. Russia-Ukraine Conflict (2014 and 2022)
Russia’s annexation of Crimea in 2014 and its full-scale invasion of Ukraine in 2022 significantly disrupted global energy markets. As one of the world’s largest oil and gas exporters, Russia faced Western sanctions that restricted exports, insurance, and financing. In early 2022, Brent crude spiked above $130 per barrel, reflecting fears of prolonged supply shortages and energy insecurity across Europe.
4. Channels Through Which Geopolitics Impacts Oil Prices
Geopolitical events influence oil prices through several interconnected channels:
a. Supply Disruptions
Conflicts or sanctions can directly reduce oil supply by damaging infrastructure, limiting production, or restricting exports. For example, sanctions on Iran in 2012 and again in 2018 led to significant declines in its oil exports, tightening global supply.
b. Transportation and Shipping Risks
Chokepoints such as the Strait of Hormuz, Suez Canal, and Bab el-Mandeb Strait are vital for global oil transportation. Any military conflict or threat in these areas immediately raises concerns about shipping disruptions, leading to higher prices. Nearly 20% of global oil passes through the Strait of Hormuz daily.
c. Speculative Reactions
Traders and hedge funds respond quickly to geopolitical news, often amplifying price movements. Futures markets price in expected risks, causing volatility even when actual supply remains unaffected.
d. Strategic Reserves and Policy Responses
Nations often release oil from strategic reserves or negotiate production increases through OPEC to stabilize markets. For example, the U.S. and IEA (International Energy Agency) coordinated strategic reserve releases in 2022 to offset supply disruptions caused by the Russia-Ukraine conflict.
e. Currency Movements
Since oil is traded in U.S. dollars, geopolitical tensions that weaken the dollar or create global uncertainty can influence oil prices. A weaker dollar often makes oil cheaper for non-U.S. buyers, boosting demand and raising prices.
5. OPEC and Geopolitical Strategy
The Organization of Petroleum Exporting Countries (OPEC), formed in 1960, and its extended alliance OPEC+, which includes Russia, play a pivotal role in determining oil supply and prices. The organization uses coordinated production quotas to manage global prices, often aligning decisions with geopolitical interests.
For instance:
In 2020, during the COVID-19 pandemic, OPEC+ cut production by nearly 10 million barrels per day to support collapsing prices.
In 2023, Saudi Arabia and Russia announced voluntary cuts to maintain price stability amid slowing demand and Western sanctions.
OPEC’s policies are inherently geopolitical, balancing the economic needs of producers with the political relationships among member states and major consumer nations.
6. Energy Transition and the New Geopolitics of Oil
The growing global emphasis on renewable energy and decarbonization is reshaping the geopolitical landscape of oil trading. As nations transition to cleaner energy, oil-producing countries face the challenge of maintaining revenue while managing political stability.
However, this transition also introduces new geopolitical dependencies—for example, on lithium, cobalt, and rare earth metals used in electric vehicle batteries. While demand for oil may gradually plateau, geopolitical risks remain as nations compete over new energy supply chains.
Additionally, U.S. shale production has transformed the country from a net importer to a major exporter, reducing its vulnerability to Middle Eastern geopolitics but also introducing new market dynamics. Shale producers can ramp up or scale down production relatively quickly, acting as a “shock absorber” to global price swings.
7. The Role of Technology and Market Transparency
Technological advancements in trading—especially algorithmic and data-driven models—have increased market liquidity but also heightened sensitivity to news. Real-time tracking of geopolitical developments via satellites, social media, and analytics platforms allows traders to react instantly.
For example, satellite data showing tanker movements or refinery fires can trigger immediate price adjustments. The intersection of AI, big data, and geopolitics now defines modern oil trading strategies, with traders assessing both quantitative signals and qualitative geopolitical intelligence.
8. Managing Geopolitical Risk in Oil Trading
Professional oil traders and corporations employ various strategies to manage geopolitical risks:
Diversification: Sourcing oil from multiple regions to minimize reliance on unstable producers.
Hedging: Using futures, options, and swaps to lock in prices and reduce exposure to volatility.
Scenario Analysis: Running stress tests based on potential geopolitical outcomes (e.g., war, sanctions, embargoes).
Political Risk Insurance: Protecting investments against losses due to government actions or conflict.
Strategic Reserves: Governments maintain emergency stockpiles to stabilize supply during crises.
In addition, diplomatic engagement and international cooperation—such as IEA coordination or U.N.-mediated negotiations—can help mitigate disruptions and maintain market balance.
9. The Future Outlook: Geopolitics and the Oil Market
As of the mid-2020s, the global oil market faces a new era of geopolitical uncertainty. Key issues shaping the future include:
The U.S.-China rivalry, which may influence energy trade routes and technological access.
Middle Eastern realignments, including normalization of relations between former rivals and shifting alliances.
Climate policy conflicts, as nations balance carbon reduction commitments with economic growth needs.
Sanctions regimes on Russia, Iran, and Venezuela, which continue to restrict global supply flexibility.
The digitalization of trading, which increases speed and transparency but also amplifies volatility.
Although long-term demand growth may slow due to renewable energy adoption, oil will remain a central geopolitical and economic asset for decades. The world’s dependence on energy ensures that geopolitics will continue to shape price trends, investment decisions, and market psychology.
Conclusion
Crude oil trading is not merely a reflection of supply and demand; it is a barometer of global stability and geopolitical tension. From the 1973 oil embargo to the ongoing Russia-Ukraine conflict, political decisions have repeatedly proven capable of reshaping energy markets. For traders and policymakers alike, understanding the geopolitical dimensions of oil is crucial for navigating price volatility and maintaining economic resilience.
As the energy transition accelerates, the nature of geopolitical risk will evolve—but it will not disappear. The intersection of oil, politics, and global economics will continue to define international relations and financial markets, ensuring that crude oil remains one of the world’s most geopolitically sensitive and closely watched commodities.

Today's crude oil strategy, hoping to be helpful to you.Although the current broader context of the international crude oil market is "excess supply and weak demand", from the perspective of short-term and potential opportunities, there are three key points that support us to attempt a long position. We should not be deterred by the broader "weak market" trend:
Potential "Flashpoints" in Geopolitical Conflicts
Ukraine has not stopped using drones to attack Russia's oil facilities, and Russia's oil refining volume has now hit its lowest level in over two years. If key pipelines are attacked next, or if conflicts between Israel and Qatar in the Middle East escalate further, affecting crude oil transportation, the market will definitely rush to buy oil out of panic. In this case, oil prices will most likely surge suddenly. For example, back in June, when Israel launched an air strike on Iran's nuclear facilities, oil prices rose by 6.9% in a single day. We must seize such opportunities.
Possible "Hitches" in OPEC+ Production Increase
Although OPEC+ plans to increase supply by an additional 137,000 barrels per month in October and November, many oil-producing countries actually have little extra oil to produce. As early as May, the actual production increase was more than half lower than the planned amount. If OPEC+ announces "no more production increases" in subsequent meetings, or even resumes production cuts, the pressure from excess supply will be reduced significantly, and oil prices will naturally be able to hold steady or even rise.
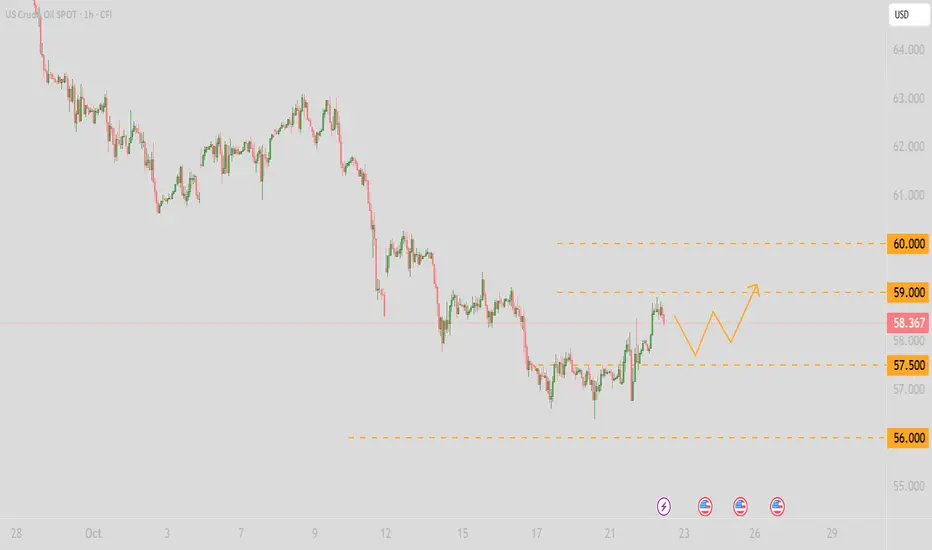
Crude Oil Trading Strategy for Today
usoil @buy 57.50-58.00
pt:58.50-59
sl:57

WTI OIL Strong long-term rebound incoming.Over a month ago (September 17, see chart below), we gave a strong Sell Signal on WTI Oil (USOIL) as the price was again rejected on its 1W MA50 (blue trend-line) and was headed towards the inner Higher Lows trend-line, easily hitting our $59.50 Target in the process:
Yet again we consult the more reliable long-term time-frames, now making a bullish call as the price is already rebounding this week on the Higher Lows. Given also the identical 1W RSI pattern with 2023, we expect a bounce towards at least the 0.618 Fibonacci retracement level at $69.50, same as the December 2023 - March 2024 rally.
-------------------------------------------------------------------------------
** Please LIKE 👍, FOLLOW ✅, SHARE 🙌 and COMMENT ✍ if you enjoy this idea! Also share your ideas and charts in the comments section below! This is best way to keep it relevant, support us, keep the content here free and allow the idea to reach as many people as possible. **
-------------------------------------------------------------------------------
💸💸💸💸💸💸
👇 👇 👇 👇 👇 👇

USOIL: Uptrend strengthens after multiple support tests
* Trend: assessed using at least three trend indicators, with market structure as the primary guide.
** Weak or Reversal Signals: Assessed based on one of our criteria for trend reversal signals.
*** Support/Resistance: Selected from multiple factors – static (Swing High, Swing Low, etc.), dynamic (EMA, MA, etc.), psychological (Fibonacci, RSI, etc.) – and determined based on the trader’s discretion.
**** Our advice takes into account all factors, including both fundamental and technical analysis. It is not intended as a profit target. We hope it can serve as a reference to help you trade more effectively. This advice is for informational purposes only and we assume no responsibility for any trading results based on it.
George Vann @ ZuperView
USOIL BEARISH BIAS RIGHT NOW| SHORT
USOIL SIGNAL
Trade Direction: short
Entry Level: 58.02
Target Level: 57.01
Stop Loss: 58.69
RISK PROFILE
Risk level: medium
Suggested risk: 1%
Timeframe: 2h
Disclosure: I am part of Trade Nation's Influencer program and receive a monthly fee for using their TradingView charts in my analysis.
✅LIKE AND COMMENT MY IDEAS✅

USOIL fluctuates higher💡The situation for USOIL today is relatively optimistic, showing a fluctuating and moderately strong trend. Here is the detailed analysis:
📈Price Trend: As of midday in the Asian session on October 22, WTI crude oil prices have edged higher in the short term, trading around $58.1, up from the previous day's closing price. WTI crude closed 1.14% higher at $57.962 the previous day.
♦Influencing Factors:
Supply Side: The U.S. Department of Energy announced a tender to purchase 1 million barrels of crude oil to replenish the Strategic Petroleum Reserve. This news boosted sentiment in the energy sector and provided support for oil prices.
♦Demand Side:
API data showed a decline in U.S. inventory levels last week, which improved market sentiment toward demand and also supported higher oil prices.
♦Macroeconomy: Expectations of a Federal Reserve rate cut continue to rise, with a 98.9% probability of a 25-basis-point rate cut in October. Capital has been flowing back into risk assets, providing some impetus to crude oil prices.
♦Geopolitics:
Europe and Ukraine have drafted a 12-point ceasefire plan. Expectations of eased geopolitical tensions temporarily weakened safe-haven demand, indirectly supporting a stronger U.S. dollar and thus exerting some pressure on oil prices. However, factors such as the U.S. oil purchase news and the drop in API crude inventories have provided more significant support for oil prices.
♦Technical Analysis:
Short-term moving averages show signs of flattening, indicating that the crude oil price trend may be stabilizing. Oil prices are inclined to fluctuate with moderate strength in the short term today. The short-term resistance level above is around 59.0-60.0, while the short-term support level below is around 56.0-55.0.
💎Trading Strategy:
Sell 58.00 SL 58.60 TP 57.00
Buy 57.5 SL 56.8 TP 58.5
Daily-updated accurate signals are at your disposal. If you run into any problems while trading, these signals serve as a reliable reference—don’t hesitate to use them! I truly hope they bring you significant assistance
Market Analysis: WTI Crude Oil Attempts ReboundMarket Analysis: WTI Crude Oil Attempts Rebound
WTI Crude oil is now attempting to recover after sliding toward $56.00.
Important Takeaways for WTI Crude Oil Price Analysis Today
- WTI Crude oil prices extended losses below the $60.00 support zone.
- It cleared a key bearish trend line with resistance at $57.50 on the hourly chart of XTI/USD.
WTI Crude Oil Price Technical Analysis
On the hourly chart of WTI Crude Oil, the price struggled to continue higher above $62.00 against the US Dollar. The price formed a short-term top and started a fresh decline below $61.20.
There was a steady decline below the $60.00 pivot level. The bears even pushed the price below $58.50 and the 50-hour simple moving average. Finally, the price tested $56.00. The recent swing low was formed near $55.94, and the price is now correcting losses.
There was a move above the 23.6% Fib retracement level of the downward move from the $62.45 swing high to the $55.94 low. The price cleared a key bearish trend line with resistance at $57.50.
On the upside, immediate resistance is near the 50% Fib retracement at $59.20. The main hurdle is $59.95. A clear move above $59.95 could send the price toward $62.45. The next stop for the bulls might be $64.00.
If the price climbs further, it could face sellers near $65.00. Immediate support is $57.50. The next major level on the WTI crude oil chart is $55.95. If there is a downside break, the price might decline toward $55.00. Any more losses may perhaps open the doors for a move toward the $52.00 zone.
This article represents the opinion of the Companies operating under the FXOpen brand only. It is not to be construed as an offer, solicitation, or recommendation with respect to products and services provided by the Companies operating under the FXOpen brand, nor is it to be considered financial advice.

Crude oil - Sell around 59.60, target 58.00-56.00Crude Oil Market Analysis:
Gold's significant moves haven't impacted crude oil, which is still recovering. Consider selling after today's rebound to 59.50. The overall trend is bearish, and the short-term outlook is bearish as well. However, the short-term volatility is quite strong, so don't sell. Crude oil needs to wait for opportunities. If there's a position, buy; if not, wait. Recent crude oil inventory data is also disappointing, which is likely to suppress crude oil prices.
Fundamental Analysis:
Watch the EIA crude oil inventory data today.
Trading Recommendations:
Crude oil - Sell around 59.60, target 58.00-56.00

Hellena | Oil (4H): SHORT to support area of 54.00.As I continued to watch oil I realized that the structure I built in the last forecast is still in place. I think we should expect a correction in wave “4” to the 59.3 area, then a continuation of the downward movement at least to the 54.00 support area. This will be the completion of the downward impulse.
I do not exclude the probability of lengthening of wave “3” and in this case there will be no correction and the price will immediately reach the target.
Fundamental context
The oil market remains under pressure as supply continues to outpace demand, raising the risk of a surplus. Forecasts for 2025-2026 indicate higher production growth while consumption slows.
Rising inventories and a shift in the futures curve into contango suggest growing storage levels and weaker near-term demand.
Under these conditions, downside pressure persists, keeping the probability of a further decline high.
Manage your capital correctly and competently! Only enter trades based on reliable patterns!

Crude oil: Sell around 58.60, target 56.00-55.00Crude Oil Market Analysis:
Crude oil has been declining recently and has reached strong support near 55. A break of this level would open up further downside. Today's outlook for crude oil remains bearish. Continue selling on minor rebounds, focusing on selling opportunities around 58.90. The new contract also bearishly suggests no buying opportunities. This selling strategy has persisted for a long time.
Fundamental Analysis:
The Federal Reserve has once again implemented loose monetary policy, and with the added support of CPI, market uncertainty is high, prompting a surge in gold prices.
Trading Recommendations:
Crude oil: Sell around 58.60, target 56.00-55.00

BRENT CRUDE OIL - Long-Term As we know, history tends to repeat itself.
Just by observing the current structure, I would dare to assume that another wave of turbulence might be ahead.
Some macro shocks could push oil down to retest the white support zone, or in the case of a “super dump,” even drive prices toward the blue accumulation area.
In any case volatility may increase sharply before the next long-term accumulation begins.

CRUDE OIL (WTI): The Price Will Drop Lower!
Crude Oil is going to reach the year's low soon.
A confirmed bearish break of a minor structure on a daily time frame
suggest a strong selling pressure.
Be ready to see a test of 55.6 soon.
❤️Please, support my work with like, thank you!❤️

USOIL Is Bearish! Short!
Take a look at our analysis for USOIL.
Time Frame: 4h
Current Trend: Bearish
Sentiment: Overbought (based on 7-period RSI)
Forecast: Bearish
The market is approaching a key horizontal level 57.145.
Considering the today's price action, probabilities will be high to see a movement to 55.504.
P.S
The term oversold refers to a condition where an asset has traded lower in price and has the potential for a price bounce.
Overbought refers to market scenarios where the instrument is traded considerably higher than its fair value. Overvaluation is caused by market sentiments when there is positive news.
Like and subscribe and comment my ideas if you enjoy them!

USOIL: Buy setups during higher-timeframe correctionOIL PRICE WEEKLY OUTLOOK
(Week of Oct 20-24, 2025)
Key Drivers & Risks
Updates in Supply, Demand, and Geopolitical News
EIA (week ending Oct 10): Crude inventories +3.5 million bbl; distillates −4.5 million bbl.
IEA OMR (Oct 2025): Upgraded global supply forecast: +3.0 mb/d in 2025 and +2.4 mb/d in 2026, while demand grows only ~0.7 mb/d per year ⇒ signaling a large surplus risk and downward pressure on prices.
OPEC (Oct 2025): Maintains demand growth outlook of +1.3 mb/d for 2025, but acknowledges a smaller deficit in 2026 as OPEC+ output rises; September production increased by ~630 kb/d.
Maritime risk in the Red Sea / Gulf of Aden: Over the weekend, a gas carrier reportedly caught fire following a possible attack off Yemen’s coast, leading to higher shipping risk premiums, though no major disruption to trade flows has been reported yet.
Watchlist for the Week Ahead
EIA Weekly Report (Oct 22): Focus on crude and distillate inventories, and any signs of policy or flow adjustments.
Maritime security updates in the Red Sea / Gulf of Aden / Strait of Hormuz — monitor frequency and severity of incidents.
China data: imports, refinery runs, and inventories — potential signals of stockpiling at lower price levels.
Any notable demand-side surprises (if any emerge).
Overall View
Oil prices are expected to gradually decline within a relatively narrow range of $70–$50 through mid-2026.
Short-term rebounds may occur due to low price levels and heightened transport risk headlines.
China’s potential restocking activity could provide limited demand-side support.
* Trend: assessed using at least three trend indicators, with market structure as the primary guide.
** Weak or Reversal Signals: Assessed based on one of our criteria for trend reversal signals.
*** Support/Resistance: Selected from multiple factors – static (Swing High, Swing Low, etc.), dynamic (EMA, MA, etc.), psychological (Fibonacci, RSI, etc.) – and determined based on the trader’s discretion.
**** Our advice takes into account all factors, including both fundamental and technical analysis. It is not intended as a profit target. We hope it can serve as a reference to help you trade more effectively. This advice is for informational purposes only and we assume no responsibility for any trading results based on it.
George Vann @ ZuperView
XTI/USD Chart Analysis: Oil Prices Fall to Yearly LowsXTI/USD Chart Analysis: Oil Prices Fall to Yearly Lows
As shown on the XTI/USD chart, WTI crude is trading below $57 today, with the 2025 low sitting near $55. Several factors are currently weighing on oil prices:
→ Uncertainty surrounding the US-China trade deal — the world’s two largest oil consumers — continues to cloud the outlook for global growth and crude demand.
→ Increased output from OPEC+ members has added further pressure, with the IEA last week raising its forecast for a global oil surplus.
→ A decline in the risk premium following the peace agreement in the Middle East has also reduced support for oil prices.
So, what could happen next?
Technical Analysis of the XTI/USD Chart
Seven days ago, we noted that:
→ In the long-term context, oil price fluctuations — following the June escalation in the Middle East — have formed a downward channel (shown in red). The current price has now slipped below its lower boundary.
→ In the short term, the pace of the decline appears to be accelerating, highlighted by the purple trajectory lines.
At that time, we suggested a scenario in which WTI could drift towards its yearly low near $55, which is now materialising. However, note the following:
→ The RSI indicator is hovering near oversold territory.
→ The chart shows signs of a Falling Wedge pattern, which often precedes a bullish reversal.
Given these signals, it is reasonable to assume that, after a roughly 10% decline since the start of the month, bears may begin locking in profits on short positions. This could trigger a technical rebound in WTI prices — potentially towards the resistance area defined by:
→ The lower boundary of the red channel;
→ The psychological level of $60;
→ The median line of the purple channel.
This article represents the opinion of the Companies operating under the FXOpen brand only. It is not to be construed as an offer, solicitation, or recommendation with respect to products and services provided by the Companies operating under the FXOpen brand, nor is it to be considered financial advice.

USOIL Trading IdeaBased on Simple Technical Analysis ( Trendline + Support & Resistance )
Risk Disclaimer:
Please be advised that I am not telling anyone how to spend or invest their money. Take all of my analysis as my own opinion, as entertainment, and at your own risk. I assume no responsibility or liability for any errors or omissions in the content of this page, and they are for educational purposes only. Any action you take on the information in this analysis is strictly at your own risk. There is a very high degree of risk involved in trading. Past results are not indicative of future returns. Good luck :-)