XAUUSD | Broke Symmetrical Triangle pattern --> Bullish BiasMacro:
- Gold prices advanced this week as renewed demand for hedges and expectations for Fed rate cuts offset still‑elevated US yields. Persistent geopolitical risks and concerns about the global growth outlook continued to underpin safe‑haven interest in gold.
- This week’s gains were supported by softer US data, including weaker private payroll indicators, which strengthened expectations that the Fed will deliver a rate cut at its upcoming meeting. These developments have weighed on the dollar at times, helping gold prices hold near recent highs, even as benchmark US Treasury yields hover around 4.10% rather than falling decisively. Structural drivers also remain in place, with investors and central banks maintaining exposure to gold as a hedge against policy missteps and inflation surprises.
- Gold prices may stay supported if upcoming US inflation data and Fed communication confirm a path toward easier policy and a softer dollar. Any downside surprise in inflation or a more dovish‑than‑expected Fed stance would likely reinforce that narrative. At the same time, a hawkish shift or stronger‑than‑expected data could prompt a temporary pullback. Gold may also react sharply to any escalation in geopolitical tensions or negative growth surprises that tighten financial conditions, as both factors tend to boost safe-haven demand and influence real-yield expectations.
Technical:
- XAUUSD broke the Symmetrical Triangle pattern and rose toward the resistance at 4245 before consolidating within a tight range of 4200-4245. The price is above EMA21, indicating an upward momentum remains.
- If XAUUSD breaches above 4245, the price may surge and retest the ATH area at around 4365.
- Conversely, closing below 4200 may prompt a further correction toward EMA21 area.
Analysis by: Dat Tong, Senior Financial Markets Strategist at Exness
Onlinetrading

NASDAQ-100 (USTEC) | Elevated risks arise Sentiment:
- Extreme Fear in the market (F&G = 23)
- Investors are bearish (49% bearish vs 37% bullish)
- Volatility elevated but not extreme (VIX 20)
- Higher Put activity and an elevated put/call ratio (1.11)
- Hedge funds unwinding crowded AI longs (50% market cap concentration)
- Record institutional options activity positioning for Q4 2025-Q1 2027
- COT report: No latest data due to the US government shutdown
Interpretation:
- Put hedge elevated = cautious as institutional hedging and distributing stocks to retail
- Extreme Fear + High Bearishness = Potential buying opportunity (later stage)
- When sentiment is this negative, often near bottoms
Fundamental:
- Valuation Concerns:
- 24-25x Forward P/E - vs 20-22 for 5-year average
- 3.08-3.37x P/S ratio - 2.35-2.41 for 5-year average
- Dec Fed cut probability is declining
Technical:
- USTEC broke the ascending trendline and EMA21, indicating potential mean reversion to EMA78, which is just above the support cluster at around 24000.
- Breaking below 24000 may prompt a decline to the following support cluster at around 23000, which is a prominent zone for sentiment contrarians step into the market if market fear remains at an extreme level.
My take on this:
- The distributing process may last for a while before reaching more extreme panic sentiment, prompting consideration of a contrarian approach based on technical levels.
- Therefore, we need to watch the price action to determine the best entry setup for the Long position. Then, for now, short-term pressure is the better take.
Analysis by: Dat Tong, Senior Financial Markets Strategist at Exness

EURUSD: Fed less dovish impairs EUR?Fundamental approach:
- The euro-dollar traded lower this week, pressured by a firmer US dollar and divergence in monetary policy, as the Fed became less dovish.
- At the same time, the ECB held rates steady and maintained a cautious outlook. The euro remained under pressure despite slightly better Eurozone data, with core inflation ticking up but not enough to drive expectations of an ECB rate change; meanwhile, improving risk sentiment and reduced odds of a Dec Fed cut supported the US dollar, helped in part by easing, but not fully resolved, US-China trade tensions.
- Key drivers included the Fed recent rate cut and Chairman Powell's statement that more easing is not guaranteed, which led to US dollar strength and overshadowed Eurozone retail and inflation numbers that met forecasts.
In addition, the ECB's steady rate guidance and optimistic growth forecast failed to support the euro, keeping the EURUSD near three-month lows as investors focused on central bank policy divergence and resilient US labor data.
- The pair could remain under pressure unless US data softens or the Fed's guidance shifts.
Technical approach:
- EURUSD plunged after breaking below the key level at around 1.1560. The price is below both EMAs, indicating that a bearish momentum persists.
- Remaining below the key resistance at 1.1560 may prompt a continuous decline to retest the support at 1.1400.
- Conversely, if EURUSD closes above 1.1560, the price may retest both EMAs confluence with the descending channel's upper bound.
Analysis by: Dat Tong, Senior Financial Markets Strategist at Exness

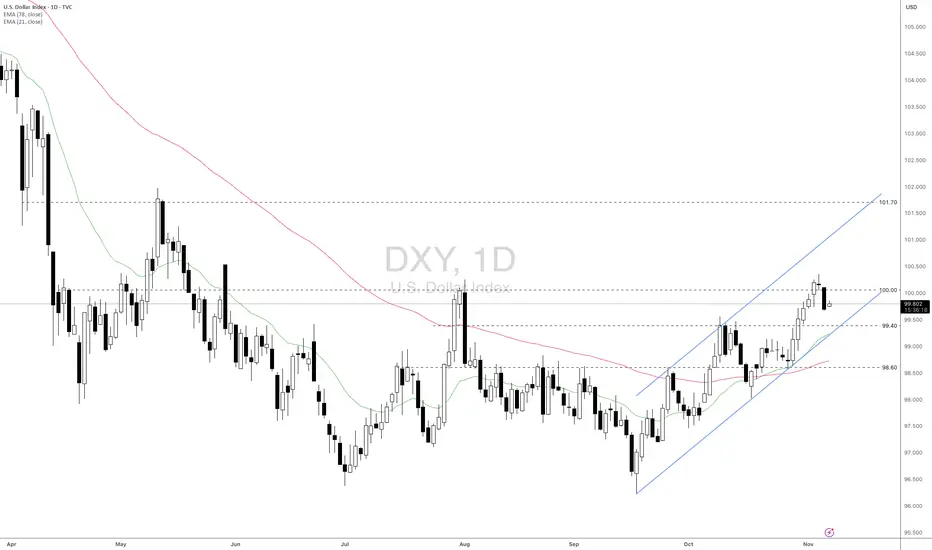
DXY: Is it going to break the 100 level or not?Fundamental approach:
- The US Dollar Index (DXY) traded sideways this week amid stronger global risk sentiment and fading demand for safe-haven assets. The continued US government shutdown delayed key data releases.
- At the same time, the ISM Services PMI rose to an eight-month high, and the ADP report showed stronger-than-expected private job gains, supporting a cautious Fed outlook on further rate cuts. Nevertheless, weak consumer sentiment and rising weekly jobless claims reinforced downside pressure on the dollar index.
- Underlying drivers this week included mixed US data, with upbeat labor and service sector figures contrasting with deteriorating consumer and business sentiment. Investors trimmed bets on imminent Fed rate cuts.
- Looking forward, the DXY may remain heavy as long as safe-haven demand stays muted and official US data is delayed due to the shutdown.
Technical approach:
- DXY retested the psychological level at around 100 and rejected. The price is above both EMAs, indicating upward momentum is still intact.
-If DXY remains below 100, the price may retest the following support at 99.40, which is confluenced with the lower bound of the ascending channel.
- Conversely, breaching above 100 may prompt a conviction to retest the next resistance at 101.70.
Analysis by: Dat Tong, Senior Financial Markets Strategist at Exness
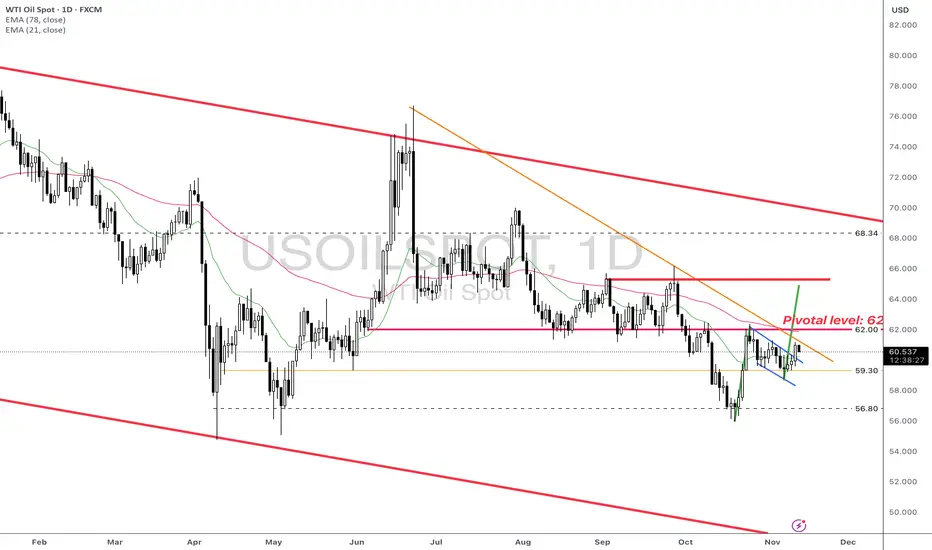
USOIL: Q4/2025 Q1 2026 Action PlansSentiment:
- The broader market is cautious in a risk-off environment, which typically translates to concerns about demand and the strength of the US dollar. However, the market is not in a state of panic as the Fear Index is at around 30, opening room for either direction.
- Social Media (X/Twitter): The current tone is positive, as participants expect USOil to rise within the range of 57.50-65.00 in the near term, anticipating an upcoming upward breakout.
- The COT report shows extremely bearish sentiment regarding the latest data from 26/9 (following the US government shutdown), so we can only have a snapshot of more than a month ago. Although the current sentiment may or may not be as extreme (we need to wait for the latest data), it still reflects the state of market positioning.
- I think that Retail is unaware of positioning extremes and is more focused on technical breakout. It may lead to a sentiment shift as a result of a technical breakout and changes in the fundamental narrative.
Fundamental:
A. OPEC+ Production Shift:
- Narrative: OPEC+ has pivoted to MORE cautious supply management. After nine consecutive monthly increases, the group is now implementing only a modest 137k bpd increase for Dec 2025, followed by a production pause for the entire first quarter of 2026.
- Rationale: Healthy market fundamentals, low inventory levels, seasonal demand
- It means more supportive than what we observed earlier in 2025. Q1 2026 pause suggests OPEC+ acknowledges oversupply risks and is being disciplined. One more thing to note is that the current price is also not entirely factored into this narrative.
B. Geopolitical Risk Premium Returning:
- Narrative: Recent US/EU sanctions on Russian energy companies and escalating tension in oil-producing regions are providing price support.
- Market impact: This narrative provides a fundamental floor for price at least till the end of this year.
C. Bearish Fundamentals - Oversupply into 2026:
- Narrative: Despite the OPEC+ pause, global oil inventories are expected to rise through 2026 on weak demand growth and non-OPEC supply increases (such as the US production)
- Factors: global inventories forecast to rise through 2026, weak demand from China, tariff uncertainties and US production at record levels.
- Market impact: Bearish medium-term outlook for Q1-Q2 2026.
Technical:
- USOIL broke the small blue channel and is expected to reach the measured level at around 65, confluence with the Sep resistances.
- If USOIL can hold above 60 (retest the broken channel), it may resume its momentum to retest the key resistance at 62 first, then 65, as measured by the move upon breaking.
- Conversely, closing below the support at 59.30 may invalidate the short-term upward view and open the door for further decline, potentially retesting the swing low at 56.80.
Conclusion:
- Despite a short-term upward momentum until year-end, the prospect for USOIL in 2026 is not as promising.
- Therefore, a range of 65-70 is possible for the short term upward plan; however, any surge bejond that may open another opportunity for counter-trade setups in Q1-Q2 2026.
Analysis by: Dat Tong, Senior Financial Markets Strategist at Exness
CADJPY - 240 MINS TIME FRAMEThe Structure looks good to us, waiting for this instrument to correct and then give us these opportunities as shown on this instrument (Price Chart).
Note: Its my view only and its for educational purpose only. Only who has got knowledge about this strategy, will understand what to be done on this setup. its purely based on my technical analysis only (strategies). we don't focus on the short term moves, we look for only for Bullish or Bearish Impulsive moves on the setups after a good price action is formed as per the strategy. we never get into corrective moves. because it will test our patience and also it will be a bullish or a bearish trap. and try trade the big moves.
we do not get into bullish or bearish traps. We anticipate and get into only big bullish or bearish moves (Impulsive Moves). Just ride the Bullish or Bearish Impulsive Move. Learn & Know the Complete Market Cycle.
Buy Low and Sell High Concept. Buy at Cheaper Price and Sell at Expensive Price.
Keep it simple, keep it Unique.
please keep your comments useful & respectful.
Thanks for your support....
Tradelikemee Academy

EURUSD Waiting For sell Order Hello Traders, Sell EURUSD After breakout Support 0.96850
here is the full analysis for this pair, let me know in the comment section below if you have any questions, the entry will be taken only if all rules of the strategies will be satisfied. I suggest you keep this pair on your watchlist and see if the rules of your strategy are satisfied.

XAUUSD ShortTime frame: 4H
Bias: Short
Symbol: XAUUSD
Analysis: There is a little hope of trending up. It has a clear downward direction . We will try to nail down the target entry and exit next week. Please wait for our posts at the start of next week.

JPYUSD Short Time Frame: 4H
Bias: Short
Symbol: JPYUSD
Analysis: The chart itself expresses a lot. The overall direction is short and we are also biased short for the coming week!

XAUUSD ShortTime frame: 4H
Symbol: XAUUSD
Bias: Short
Analysis: The price is trapped and there is hope of strong move in either directtion. By considering overall market , we are in a short bias.

GBPUSD Long SignalTime Frame: Daily
Symbol: GBPUSD
Bias: Long
SIgnal Analysis:
The overall trend is down but we can expect a short term weekly move upward and have a high chance of accumulating some pips in upward reversal.

EURNZD Forming Cup & Handle Pattern On the daily time frame EURNZD, we found Cup & Handle shape and expecting to breached the upper side. We'll be holding a long position from a bit of fall.

PAYPAL SHORT SIDEHello Trader I Found PAYPAL in short side it form BEARISH Pennant pattern and also it touches to its resistance are and came down and form the Bearish Pattern in 1 hrs Time Frame. if you find my analysis if helpful for you so please like and follow me and also give your comment on this stock. Thank yOU

DR REDDY BEARISH SIDEHello Traders i found sell setup in DR READY In 4hrs Time Frame as we can see it came to its Resistance area it fails to cross it and also hit the trendline resistance area. if you find my trend setup is useful for you please like and follow me. THANKYOU TRADER

Gopalakrishnan Range Index. (GAPO)GAPO Trading indicator.
A low value of Gopalakrishnan Range Index means low volatility in a market where there are no gaps or significant changes in the charts. Whenever the charts start making strong moves or creating gaps the GAPO starts to rise.
We can not use this for a buy or sell signal.
It only gives an idea of the market volatility.
If you love to trade in a volatile market, look for a high value of GAPO and vice-versa.

Top 3 Stocks NOW 🚀| April 2020😊Please LIKE & FOLLOW for more VIP Hunters signals , penny stocks
Stocks : ZM
What’s the Strategy here :
Zoom Is one of the most interesting stocks. The price of it doubled from $90 to $160 from the crisis and it's an uptrend , a big advantage of it that this company is internationally reactant to news .
If you see the chart closely you will see that the company had used it and it wasn't due to a trouble and the company was due to a scandal of an official who threw his cat which is animal abuse . and after that the company started showing slight recovery .
still given consideration that there are other competitors in the market such as Microsoft Office meeting APP , buy ONLY when you see expected run up and price confirmation .
NASDAQ:ZM
How can you actually use this ?
We ONLY trade regarding the news ! Meaning that when we see the anticipatory run UP I start trading it and letting my students and followers take the advantage 👨🎓.
The Best Part
You can follow me and apply my trades for FREE !!!
QUESTIONS ?
Please comment below , what you have in mind 😊

NIFTY 50 The Market will be come New Low Position. It is better to BUY Shares at this low level. The Market will be recover up to 60 - 70% in the month of Sep-Oct 2020. whether You are a new investor or an existing investor, DON'T MISS IT.

DATABTC hitting the support | Upro 237% possibilityPriceline of DATAcoin / Bitcoin cryptocurrency is moving within a channel.
Previously in month of Mar 2019 the price action found the support at 0.00000427 sats and took bullish divergence and produced more than 93% profit.
This time again the price action has found another support and current support is at 0.00000098 sats and we are expecting next bullish divergence form here like it happened Mar 2019, insha Allah
This 0.00000098 sats support is our stop loss in case of complete candle stick closes below this support.
RSI was oversold and now moving up.
Stochastic has given bull cross from oversold zone.
Volume profile of complete channel is showing less interest of traders below the support.
I have defined targets using Fibonacci sequence:
Sell between: 0.00000211 to 0.00000331
Regards,
Atif Akbar (moon333)

MTLBTC formed a bullish gartley | Upto 56% potential ideaThe priceline of Metal / Bitcoin cryptocurrency has formed a bullish gartley and entered in potential reversal zone.
This PRZ area should be used as stop loss in case a complete candle stick closes below this area.
I have used Fibonacci sequence to set the targets:
Buy between: 0.00003255 to 0.00002822
Sell between: 0.00003597 to 0.00004416
Regards,
Atif Akbar (moon333)

DOCKBTC has formed bullish butterfly | Upto 44% expectedPriceline of Dock / Bitcoin cryptocurrency has formed a bullish butterfly and entered in potential reversal zone.
I have used Fibonacci sequence to set the targets as below:
Buy between: 0.00000089 to 0.00000079
Sell between: 0.00000096 to 0.00000114
Regards,
Atif Akbar (moon333)

ZRXUSD formed bullish gartley | Upto 40% expectedPriceline of ZRX / US Dollar cryptocurrency has formed a bullish Shark and it is entered in potential reversal zone to hit the sell targets soon insha Allah.
This PRZ area should be used as stop loss point in case of complete candle stick closes below this zone.
We have 50 simple moving average support within PRZ area but volume profile is showing traders interest even below the potential reversal zone, Stochastic is oversold and did not give bull cross and MACD is strong bearish so for secure trade we can wait for MACD to turn weak bearish or for stochastic to give bull cross then buy.
I have used Fibonacci sequence to set the targets:
Buy between: 0.194078 to 0.174767
Sell between: 0.209236 to 0.245689
Regards,
Atif Akbar (moon333)

LINKUSD formed a bullish Shark | Upto 29% expectedPriceline of Chainlink / Tether US cryptocurrency has formed a bullish Shark and it is entered in potential reversal zone to hit the sell targets soon insha Allah.
This PRZ area should be used as stop loss point in case of complete candle stick closes below this zone.
Volume profile is showing less interest of traders here, but Stochastic is oversold and did not give bull cross and MACD is strong bearish so for secure trade we can wait for MACD to turn weak bearish or for stochastic to give bull cross then buy.
I have used Fibonacci sequence to set the targets:
Buy between: 1.5555 to 1.4583
Sell between: 1.6668 to 1.8874
Regards,
Atif Akbar (moon333)

ZRXUSD likely to fail in breaking down 100 SMAThe priceline of ZRX / US Dollar is likely to form a bullish gartley.
Initial X to A was not able to break 200 simple moving average resistance and now the B to C leg is hitting the 100 SMA resistance and likely to fail in break out.
Volume profile is showing less interest of traders here.
MACD turned weak bullish from strong bullish, but stochastic did not give bear cross sofar so we can wait for stochastic to give bear cross and then short.
I have used Fibonacci sequence to set the targets:
Sell between: 0.212765 to 0.255376
Buy between: 0.194078 to 0.174767
Regards,
Atif Akbar (moon333)
