$FB | WEEKLY WATCHLIST 12/27$FB 1D Setup reminds me of $AAPL. Stopped at the reverse gp and has room for 1 more leg down to conclude a significant corrective phase. Huge buying opportunity there. A move over $345 invalidates my thesis.FLongby StonksSociety1
$AMD | WEEKLY WATCHLIST 12/27$AMD 1D Made a new local high last week, further confirming my bull thesis. Now, looking for a small pullback into the mid-high $130s for a buying opportunity to $159.Longby StonksSociety1
$AAPL | WEEKLY WATCHLIST 12/27$AAPL 1D Paused last week at the reverse gp. Potential local tops here at $177 or $179 for a final wave C down to complete wave 4. A new ATH would invalidate this thesis.Longby StonksSociety0
$ROKU | Watchlist #4 | 12/27 - 12/31 ROKU +235 (Over $235 for calls) Technical analysis: Bull flag breakout Longby MalcolmInTheMoney0
$MARA | Watchlist #3 | 12/27 - 12/31 MARA +39 (Over 39 for calls) or 38 bounce (Bounce on 38 level for calls) News Catalyst: "Marathon Digital to Expand Hashrate by 600% With Record Purchase of Bitcoin Miners" - www.coindesk.com Longby MalcolmInTheMoney3
$NKLA | 12/27 - 12/31 | Watchlist #2 NKLA +11.3 (Over 11.3 for calls) or 10.8 bounce (Bounce off 10.8 levels for calls) News Catalyst: "Nikola Gets Order For 10 Nikola Tre With An Option For Up To 100" -https://insideevs.com/news/556723/nikola-tre-loi-100-trucks/Longby MalcolmInTheMoney1
$MU | Watchlist #1 | 12/27 - 12/31 MU 94 BOUNCE or 92.7-93 BOUNCE Strategy: Post earnings report rally Buy into weakness at the bounce levels News Catalyst: "Micron Technology (MU) shares were up nearly 5% to trade at $94.84 on Thursday, as more than 25 million shares changed hands shortly before 2:30 p.m. EST. Over the past five trading sessions, Micron has risen more than 16%, compared to a 1.7% gain for the S&P 500." - seekingalpha.com Longby MalcolmInTheMoney112
Options Medium-term Week Review Let's jump to analyse the data from Options market and scan main markets from D1 timeframe perspective: DAX - opposite signals from Options flow, as in general we have recently present Bullish sentiment for last 3 sessions, but Option Volume flow still points to Bearish signal (as PUT Volume aka red line is higher/above CALL Volume aka green line). Virgin VPOCs are present on both sides - so above and below current price level. On last session DAX broke significant S/R Level (identified by balance point where PUT and CALL Volume were equal - my indicator is pointing such moments in time). As long as we're above 15616, price should go in direction of Virgins on 15907 and 16165. However careful observation is required further on German Index. S&P500 - Bullish sentiment from Options flow appeared recently and CALL Volume is increasing in comparison to PUT Volume - when green line moves above red line it will confirm fully Bullish sentiment. On the other hand we have multiple Virgin VPOCs levels below current price, what add odds to Bears Camp. Major Support Area is 4477.75-4507 zone. Gold - from quite a long time we see Bullish sentiment from Options Flow and PUT Volume should be soon lower than CALL Volume what adds confluence to Bullish move. Major Support zone is now 1783.5-1795.3 while still we have multiple Virgin VPOCs to retest above current price Level. Gold should climb up in the area of last major top on D1, around 1875. Oil - Bullish sentiment from Options flow and recently PUT Volume reached balance vs CALL Volume. It opens road for up move. Currently we're on major resistance (73.79) so small correction could appear, but overall Oil prices should continue climb up. Next major resistance is on 78.45 Just for reference, blue lines are Virgin VPOCs and red lines are major S/R Levels marked in moment of time where PUT Volume was equal to CALL Volume from Options flow. Options are giving us a big edge, when only we can properly analyse the data coming out of this market. My tools are analysing it and display end-results in fully objective way for newbie traders as well as for experienced ones. Please bear in mind, I am not predicting future but write assumptions only that can happen but doesn't need to. Trader need to be prepared for different scenarios.by skyline-trader0
Trade Plan 27 Dec 21 onwards : Bank NiftyLevels as mentioned on the chart Daily Followup chart Lower long setup Views are for ‘’EDUCATIONAL PURPOSE ONLY’’ trade at your own risk. "Always Respect Risk" Happy Trading Jai Hind Shortby DhirajSinghBais1118
possible reverse HEAD AND SHOULDERS IN NIFTY.use the 15 min candle closing to enter in trade if it closes above a line drawn stop loss 5 % target 17 %Longby Tradekarsharma33981
$NFLX - Channel possible breakout/w a run up prior to earningsOnly thing missing here is volume on that breakout, but that can come any moment, NFLX has the tendency to run up before earning, and this could be no difference. RSI Divergence as a positive indicator too. Stop loss at structure. Great risk reward trade, short hold, sell before ER Great also for selling credit spreadsLongby Georgi_Georgiev0
Understanding OptionsTo gain a grasp on options it is essential to understand profit/loss diagrams for the various options whilst also understanding why they display such diagrams. Understanding profit/loss diagrams can help you gain insight into arbitrage trading(which is beyond the scope of this post) and will help you hedge various types of positions. We will first discuss the difference between being long from short, and will conclude why the diagrams are the way they are. LONG OPTIONS When you are long an option, you are paying a specified amount of money upfront. What does this mean? This means you can only lose the amount of money that you used to initiate the trade. This is known as having limited loss. Upon paying this premium you have the opportunity to gain infinite profits and will reap such profits if the underlying asset goes in your desired direction, hence you are paying a premium to acquire greater opportunity. SHORT OPTIONS Being short options is quite different than being long options. Instead of paying money upfront for the opportunity of large profits, you actually receive money upfront. This is also known as having limited profits. Once you place a short position you already have your max profits set in place. If I receive money upfront then how do I make a profit? Your endeavor as an option seller is for the person on the other side of the trade to be at a loss. Options are a zero-sum game. There are those that profit off of a trader's loss and there are those that acquire that loss. When you are selling an option there is someone on the other side of the trade that is long the option. This is important because as we have learned earlier, long options have infinite profit potential. This means that as an option seller you technically face the probability of having unlimited losses. For example, if you are selling a call there is someone that has purchased the call that you sold. If their call becomes unprofitable then you can buy back the call to offset the call that you have sold, acquiring a net profit. But if their call becomes profitable then you will have to offset the call that you sold, hence buying back the call at a larger price for a net loss. APPLYING KNOWLEDGE Lets now take a look at the option's profit/loss diagrams above. The Long Call displays a diagram in which the underlying asset must rise for you to make a profit, with the benefit of having limited losses. The Long Put displays the need for an asset to go down to reap a profit with the added benefit of only having a limited amount that can be lost. The Short Call displays the acquiring of a limited amount of profit with the desire for the underlying to not rise or else an infinite amount of loss will be faced. The Short Put displays the acquiring of a limited amount of profit with the desire for the underlying asset to not go down or else unlimited losses can be faced. p.s A great way to remember these diagrams is to picture them forming a diamond shape. The image above depicts that of a diamond formation which can help you form new profit/loss diagrams for advanced strategies. It is also very helpful to understand the rights and obligations that the various type of options have. Educationby ddcakez8
$EEM naked PUT, high PoP #option #trade #Trades #OptionsTrading The iShares MSCI Emerging Markets ETF is a good choice for today high IVR credit trade. High PoP, very predictable profit. Reasons: - high reward for Jan21 monthly expiry (mangeable with rolling) -> collecting credit - breakeven point is far - RSI is oversold. Max profit: $92 Probability of 50%Profit: 84% Profit Target relative to my Buying Power: 14% Req. Buy Power: $633 (max loss without management before expiry, no way to let this happen!) Tasty IVR: 104 (very high) Expiry: 49 days SETUP : NAKED PUT for $EEM, because IVR is high, for 0.92cr * Sell 1 $EEM JAN21'46 PUT Management : ROLLING if daily candle is closing below of BE. Take profit strategy : 50% of max.profit in this case with auto buy order at 0.46db Of course I'll not wait until expiry in any case! If you liked this article, check my other ideas. Anyway: HIT THE LIKE BUTTON BELOW , and for fresh option ideas FOLLOW ME( @mrAnonymCrypto ) on tradingview !Longby TanukiTradeUpdated 2
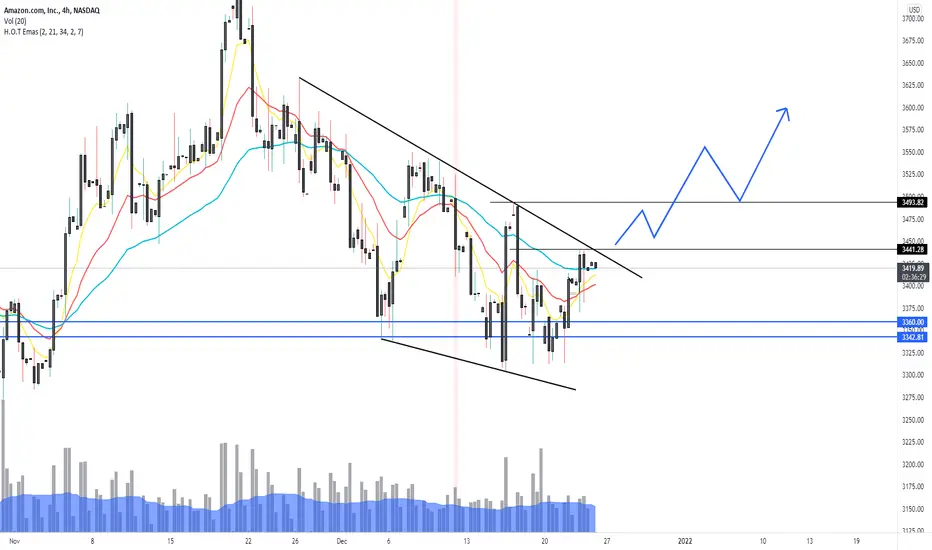
AMZN trying to breakoutAMZN is trying to break out of a pennant, Watching price above 3441 for continuation. Longby TheBullandBearLounge2
Stock is worth around 5In reality this stock is worth around 5 but it might not go that low. Probably we bounce now and continue the downtrend. Maybe i open a put spread later.Shortby Nielsagaert0
$ROKU | WEEKLY WATCHLIST 12/20$ROKU 1D Pretty nice chart showing more upside potential to come. As long as lows hold and market strength resumes, we can see Roku test the $270-316 region before any significant pullback.Longby StonksSociety114
$PYPL | WEEKLY WATCHLIST 12/20$PYPL 1D Still tons of indecision and very unclear chart imo. Is THE bottom in? Maybe. Is there another leg down? Maybe. I expect lots of chop to build out a base at the very least. Be patient with this name and wait for some clarity.Longby StonksSociety221
$NIO | WEEKLY WATCHLIST 12/20$NIO 1D Still not interested in anything long yet. Waiting for atleast $24-26 region to get tested first. No rush here.Longby StonksSociety2
$MU | WEEKLY WATCHLIST 12/20$MU 1W Nothing new here. I like other semis better, they have better opportunity imo. Still expecting a pullback on this one.Longby StonksSociety110
$LCID | WEEKLY WATCHLIST 12/20$LCID 1D Seen quite a few counts from others pointing towards more down. However, I want to provide a slightly more bullish look. **IF** lows hold from here, we may have put in a sub wave 2 and retesting $46 then $52.Longby StonksSociety1
$FSLY | WEEKLY WATCHLIST 12/20$FSLY 1D Strong move on Friday. If lows hold, we can see continuation higher to my wave 3 target of around $50. A daily close over $41.75 will give me conviction for a swing.FLongby StonksSociety1
$FB | WEEKLY WATCHLIST 12/20$FB 1D Beautiful weekly falling wedge. Expecting a slight dip into my buy zone before absolutely taking off.FLongby StonksSociety4
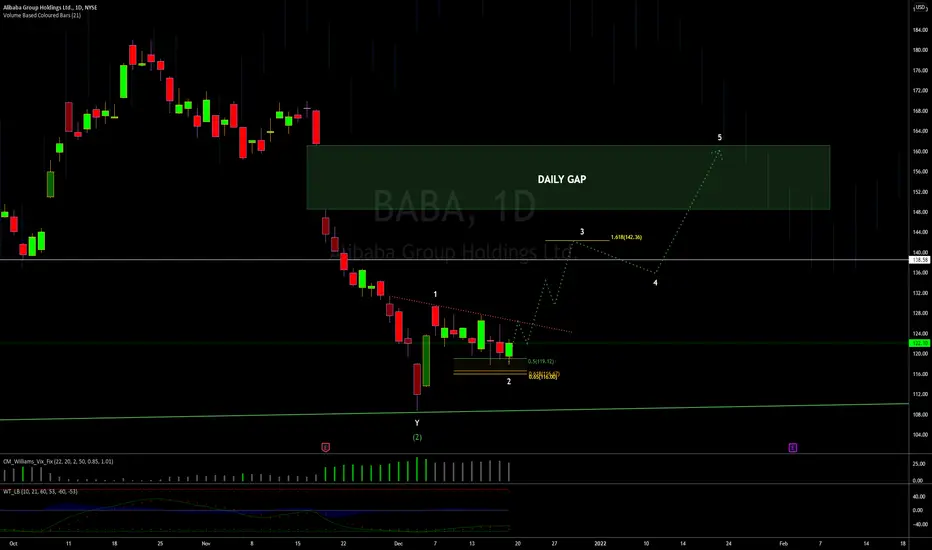
$BABA | WEEKLY WATCHLIST 12/20$BABA 1D One of my favorites going into the week. Beautiful base building with clean diagonal resistance. Break above + retest would interest me into monthly call swing position.Longby StonksSociety2