Bullish Divergence, Daily Trend Line SupportOANDA:AUDJPY looks set to continue its bullish trend after finding support at the daily trend line. Presence of bullish divergence on 1 hr indicates potential bullish momentum if price succeeds in breaking the lower high.
Oscillators

T-Mobile: Weak in a Strong Market?T-Mobile USA has limped as the broader market hits new highs, and now some traders may see downside signals emerging.
The first pattern on today’s chart is the gap lower on September 8. (The drop came after SpaceX’s Starlink purchased wireless spectrum licenses with plans to compete against carriers like TMUS.)
Second, the wireless company failed to rebound from the drop. That may suggest few investors saw an opportunity in the pullback.
Third, TMUS made a series of lower highs while closing above August 1’s weekly close of $237.20. However yesterday it seemed to break that descending triangle to the downside.
Next, recent consolidation below the 200-day simple moving average may suggest the long-term trend is growing more bearish.
Finally, MACD has been falling and the 8-day exponential moving average (EMA) is below the 21-day EMA. Those signals may reflect short-term bearishness.
TradeStation has, for decades, advanced the trading industry, providing access to stocks, options and futures. If you're born to trade, we could be for you. See our Overview for more.
Past performance, whether actual or indicated by historical tests of strategies, is no guarantee of future performance or success. There is a possibility that you may sustain a loss equal to or greater than your entire investment regardless of which asset class you trade (equities, options or futures); therefore, you should not invest or risk money that you cannot afford to lose. Online trading is not suitable for all investors. View the document titled Characteristics and Risks of Standardized Options at www.TradeStation.com . Before trading any asset class, customers must read the relevant risk disclosure statements on www.TradeStation.com . System access and trade placement and execution may be delayed or fail due to market volatility and volume, quote delays, system and software errors, Internet traffic, outages and other factors.
Securities and futures trading is offered to self-directed customers by TradeStation Securities, Inc., a broker-dealer registered with the Securities and Exchange Commission and a futures commission merchant licensed with the Commodity Futures Trading Commission). TradeStation Securities is a member of the Financial Industry Regulatory Authority, the National Futures Association, and a number of exchanges.
TradeStation Securities, Inc. and TradeStation Technologies, Inc. are each wholly owned subsidiaries of TradeStation Group, Inc., both operating, and providing products and services, under the TradeStation brand and trademark. When applying for, or purchasing, accounts, subscriptions, products and services, it is important that you know which company you will be dealing with. Visit www.TradeStation.com for further important information explaining what this means.

What's the fate of MSTR? MSTR is showing a sign for a long opportunity. However, there hasn't been a confirmation yet.
The stock is in oversold region and price has respected both bullish trendline and support level. Once there's a breakout of the bearish trendline and green bar is formed on the awesome oscillator, then you can take a long position. This is a confirmation that the stock is ready to create a new higher price.

RSI up + MACD cross on M15 & M5 + Bull Engulf + EMA200 bounce RSI oversold + MACD about to cross on M15 & M5 + Bull Engulf on M15 with spike down bounced off EMA200 = A+ setup
Took this trade following spike down into EMA200 on M15 and bounce. MACD also crossed on both M15 and M5. Large bullish engulf on M15. Excellent setup.
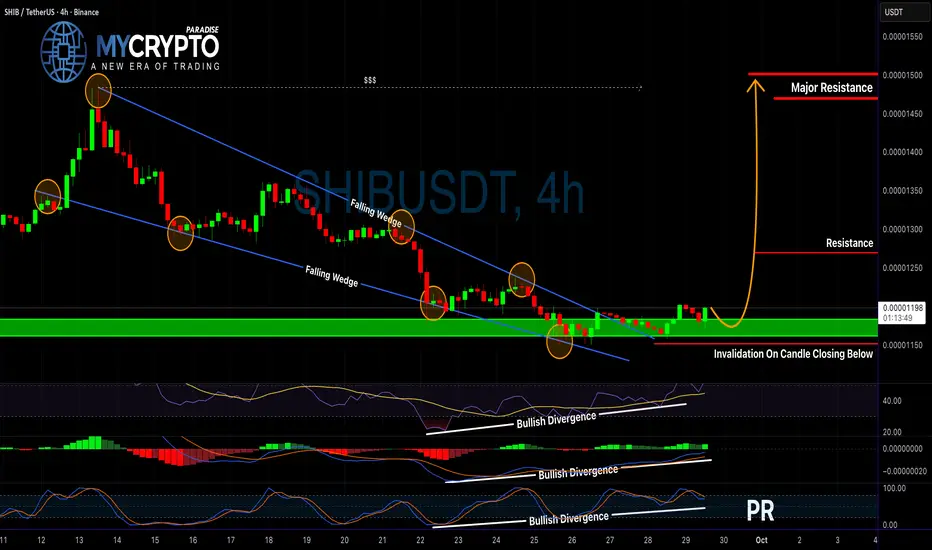
Is SHIB About to Explode or Collapse? Read Before It’s Too LateYello Paradisers! Are you paying attention to SHIB right now? Because this could either be the start of a massive bullish breakout — or the trap that wipes out impatient traders.
💎SHIBUSDT is showing strong potential after breaking out of a falling wedge pattern, which is a classic bullish reversal setup. What makes this move even more convincing is the presence of bullish divergence on the RSI, MACD, and Stochastic RSI — all of which are aligning to support a potential move to the upside.
💎From the current price level, after a proper retest of the support, the setup is still offering a favorable 1:2 risk-to-reward ratio, which is solid for short-term traders.
💎If you’re aiming for even larger risk-to-reward opportunities, you could wait for a more defined retest to enter with tighter risk parameters. However, this comes with the risk of missing the move entirely if the market doesn’t offer that second chance.
💎But here's the key — if the price breaks down and closes below the invalidation level, this entire bullish idea becomes invalid. In that case, it’s much smarter to step back and wait for cleaner price action and a higher-probability setup to form.
💎Discipline always beats impatience.
🎖Strive for consistency, not quick profits. Treat the market as a businessman, not as a gambler. That’s the only way to make it far in your crypto trading journey. Be a PRO.
MyCryptoParadise
iFeel the success🌴
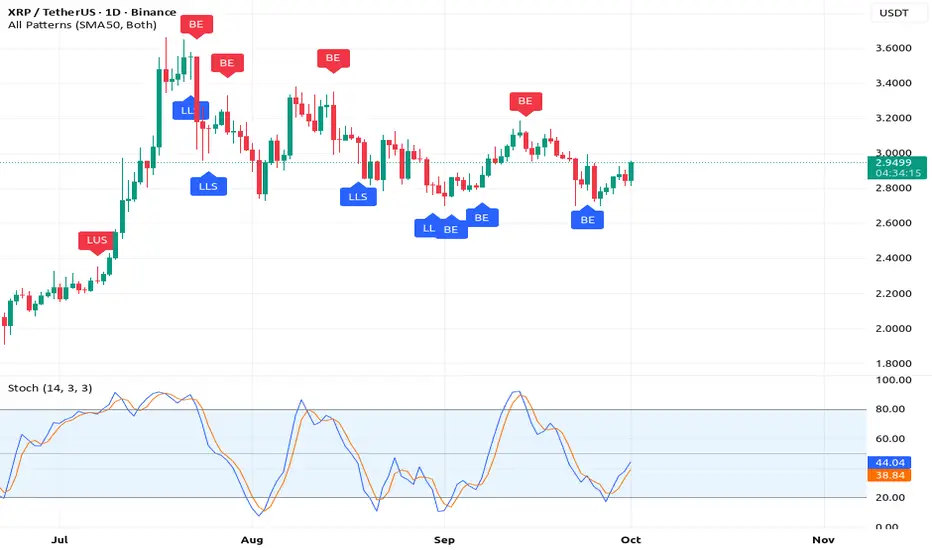
The Number 3 Crypto + The New Low Buying StrategyThis crypto BINANCE:XRPUSDT
is the number 3 crypto
based on the market cap.
Something happened, you see
am trying to raise capital
for my business and its not
easy because
the person helping me
has given up on me.This person
is very close to me and
has helped me with
my business education
we had a huge disagreement
some few years ago.Because
you see this friend of mine
only believes in
get rich quick schemes
honestly i was so desperate for
help back then that any online business
education program would have convinced me.
But i knew from the very start that
the chances of making it in business
especially within the next 3 months
where not possible.
Even though i kept going
same with trading when i first saw
my trading knowledge serious
it was when after i broke up with my
girlfriend.
I studied Rocket Stocks by Matthew Kratter.
Everyday for 21 days then another
14 days apart.This strategy is
the one that helped me form
the Rocket booster strategy.
So whats the point of me
telling you these stories?
Nothing..these are stories
about nothing.
Now look at this chart BINANCE:XRPUSD
You will see something
called the Bullish engulfing.
This candlestick pattern
is the perfert entry signal..
This strategy is called the
New low buying strategy.
Because its done on a reversal after
a market crash.
Rocket boost this content to learn more.
Disclaimer: Trading is risky please learn risk
management and profit taking strategies.
Also feel free to use
a simulation trading account before
you trade with real money.
ETH 1H Analysis - Key Triggers Ahead | Day 29❄️ Welcome to the cryptos winter , I hope you’ve started your day well.
⏰ We’re analyzing ETH on the 1-Hour timeframe .
👀 On the 1-hour chart , After breaking lower resistance zones, ETH started a strong bullish leg toward higher resistance. It reacted to these levels but moved upward with micro-buyer support. Currently at $4323, a key seller ticker zone—breaking this could push ETH higher. Note: Trend shows some weakness; sell candles are engulfed but smaller. Over 90% of holders are in profit, causing frequent stop-hunts on selling pressure.
🧮 RSI: After moving from near oversold to overbought, RSI is cooling near the 70 level. With increased long volatility, multiple buy positions could form, but rejection here may lead to a correction. Key static resistance is 70; swing support is at 50.
🕯 Volume & Candles: Recent candle size and volume surged as buyers entered, but approaching $4300 resistance shows trend weakness. Candle size decreased; profit-taking and minor pullbacks are possible. For trend continuation, higher volume and repeated buying pushing ETH toward overbought are needed.
📊 Liquidation Heatmap : Unlike BTC, long and short orders cluster sparsely, forming max-pain zones. ETH approaching $4380 could trigger a short squeeze and remove the seller ticker, pushing toward $4500. Next long max-pain is $4246, with lower support around $4100. ETH is in a near-decision zone with one bullish leg.
💸 ETHBTC Pair Currently in a trading range; the floor is Maker Buyer Zone , the ceiling is Taker Seller Zone. Price bounced well from the floor. High concentration of longs and shorts makes range boundaries critical—breaking either could trigger a sharp move. Price is near 0.037 resistance, RSI close to swing resistance. Buyer and whale support could enable another bullish leg; rejection may slightly increase risk of range breakdown.
🧠 Focus on BINANCE:ETHBTC wait for exit from the trading range, then check ETH/USDT. Often aligns with BTC dominance drops. Selling volume in ETHBTC is decent; if whales add volume, this setup provides optimal trade duration.
↗️ Risky Long Scenario: Break 0.037 resistance ETHBTC, BTC dominance drop, breaking ETH/USDT seller ticker, RSI stabilizes in overbought. Small stop-loss; trade is risky but viable.
📉 High-Risky Short Scenario: Rejection from current zone, ETH/BTC rejection, swing rejections, indecision candles multi-timeframe, SMA7 touch, and rising sell volume could signal short positions.
❤️ Disclaimer : This analysis is purely based on my personal opinion and I only trade if the stated triggers are activated .

GBPUSD | Retest of Broken Channel Reinforces Bear CaseDespite market hopes for multiple BoE rate cuts, the September meeting disappointed. The Bank held rates at 4% and slowed its QT pace — a signal of policy caution rather than hawkishness.  Two committee members pushed for cuts, but the broader tone emphasized sticky inflation — especially in services and food — keeping constraints on GBP strength.
Technical Lens
• Price has broken decisively below the ascending channel that had underpinned the recent GBPUSD rally.
• The pair is now retesting the lower trendline of that channel from below, which is acting as resistance — a classic break-then-retest setup.
• Momentum indicators (e.g. RSI) show room for further downside, with no signs yet of bullish divergence.
• Should resistance hold on the retest, it would add weight to the view that the earlier upside leg is exhausted and that the next impulse is lower.
Scenarios
• If resistance holds (retest fails): The broken channel becomes a barrier. We lean toward a resumption of downside — targeting the ~1.3100 region as the next structural zone.
• If buyers reclaim the channel (close back inside): A short-term bounce is possible, but the macro framework and internal momentum remain hostile to sustained GBP upside. Any rebound is likely capped by the same former channel boundary.
Catalysts to Watch
• UK inflation data (CPI, PPI, services inflation) — stickiness could delay dovish expectations.
• BoE communication or minutes — changes in nuance could shift market expectations.
• US / Dollar strength or weakness (as GBPUSD also reacts to broad USD moves).
• Risk sentiment or spillovers from global macro shifts.

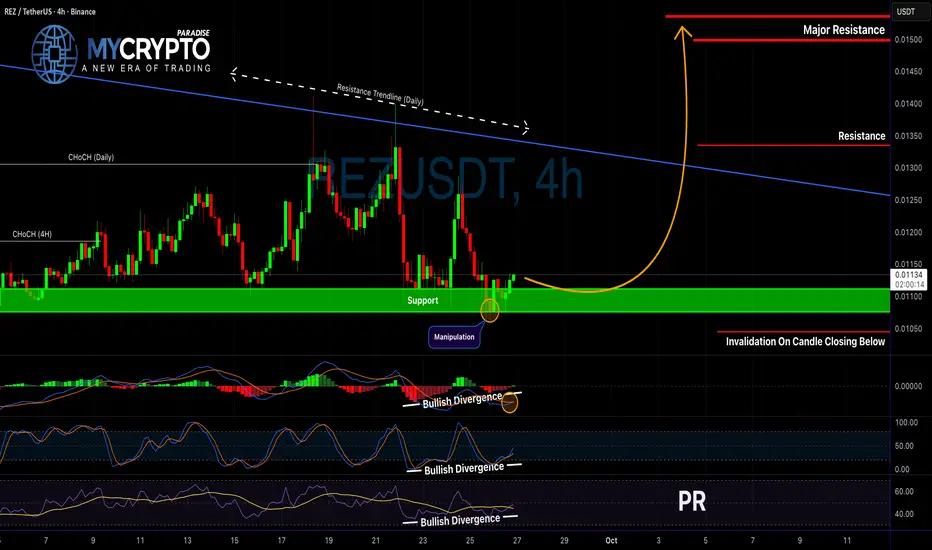
Is REZUSDT About to Explode or Collapse?Yello Paradisers! Have you been paying attention to REZUSDT lately? If not, you could be missing out on a major move that may catch many traders off guard. The pair has recently shown signs of manipulation following a clear accumulation phase, which significantly increases the probability that a distribution phase is now underway.
💎Price is currently sitting at a crucial support level, and before the manipulation occurred, we observed a clear Change of Character (CHoCH) on both the Daily and lower timeframes. This is a strong signal that most early buyers have been taken out, which often sets the stage for the real move to begin.
💎We’re also seeing strong bullish confluence across multiple indicators. The MACD, RSI, and Stochastic RSI are all showing divergence, which further supports the bullish thesis. On top of that, a key daily resistance trendline lies just above the current price and could act as a magnet, drawing the price higher in the short term. This setup is being supported by a double bottom structure forming on the higher timeframe, which we are actively trading from the lower timeframes in order to capture a higher risk-to-reward ratio. The alignment across multiple timeframes increases the probability of a sustained bullish move.
💎If you're looking for an entry, the current price zone offers a solid setup with a risk-to-reward of more than 1:2. A smart approach here would be to secure partial profits early and leave a small position running in case the price accelerates toward higher targets. However, if the price breaksdown & closes candle below our key invalidation level, the bullish scenario will be invalidated. In such a case, it’s better to step aside and wait for stronger confirmation rather than forcing a low-probability trade.
🎖Make sure you play it smart, Paradisers; the next 6–9 months will be juicy for some and painful for others. Discipline, patience, robust strategies, and trading tactics are the only ways you can make it long-term in this market.
MyCryptoParadise
iFeel the success🌴
What Makes Technical Analysis The #1 Skill To HaveFinding this Forex pair CAPITALCOM:EURMXN
was very hard
you see Forex trading is very sensitive
Because you are dealing with governments
and central banks.
I still remember the time i was
learning about forex trading
and then the late president
of united states blocked the ICE feed
which is needed to screen
the forex markets
this is why if you go into forex
trading you need to understand
that this is really real.
So what is happening here?
Basically its the trade of currency bonds ,
The government borrows money
from the central bank in order
to develop the economy.
What the government does with this
money is up to the current government
in power.But this system
will never die.
Because printing money also known
as currency bonds is very very addictive
to the political powers. People love
governments that provide jobs.
I once talked to a local politician and she told
me that unless i have plan to involve a large number
of people the"funds" wont be released.
These funds are government currency bonds.
this is why forex trading is so powerful.
The moment you understand technical analysis
Its like you can see the future.
On this chart am using the surpport
plus the stochastic crossover
look at the chart and see the crossover
Rocket boost this content to learn more.
Disclaimer: Trading is risky please learn risk management
and profit taking strategies.Also feel free to use a simulation
trading account.

DUOL - NOT FOR TREND-FOLLOWING TRADERS DUOL - CURRENT PRICE : 271.28
Duolingo, Inc. (DUOL) is in a downtrend since 14 May 2025. The stock has recently tested the support level near USD 263, which coincides with a previous demand zone. This bounce from support highlights buying pressure, indicating the likelihood of a short-term reversal.
The Relative Strength Index (RSI) has moved near 30 level, signaling that the stock is in oversold territory. Oversold conditions often precede a technical rebound as selling pressure eases.
The confluence of oversold momentum and price stabilization at support suggests a possible bounce play. If buying volume increases, the stock could recover toward USD 297 – 325, its next resistance zone.
ENTRY PRICE : 271.00 - 272.00
TARGET : 297.00 and 325.00
SUPPORT : 260.00 (CUTLOSS below 260.00 on closing basis)
Notes : As the dominant trend is clearly bearish (downtrend) since 14 May 2025, this setup is not for trend-following traders.

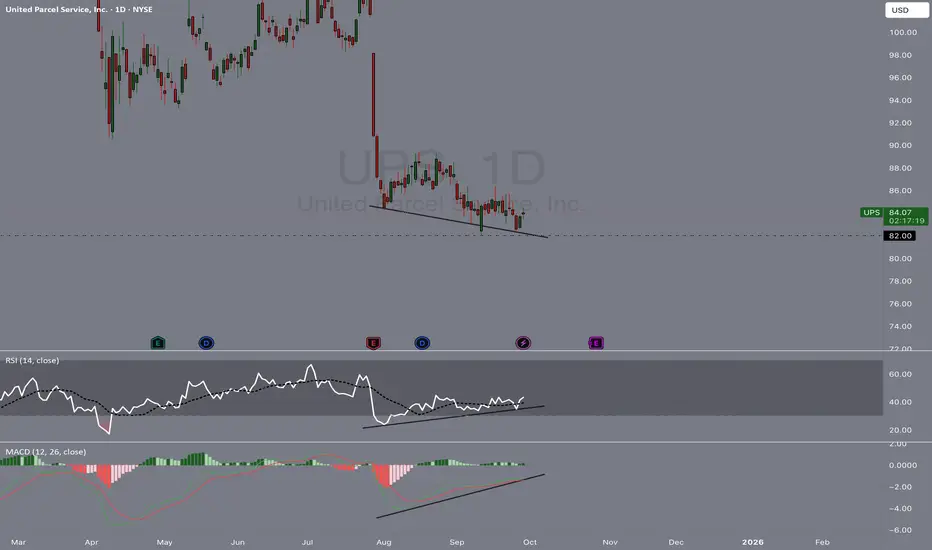
UPS : TRADE IDEA 1 NYSE:UPS
Price Action
UPS dropped sharply with a big gap down, followed by heavy selling.
Price is now consolidating near $82–$84, forming a possible falling wedge (bullish) or descending triangle (bearish).
Support & Resistance
Key support: $82
Resistance: $88–$90 (prior consolidation zone)
RSI (Relative Strength Index)
RSI (14) shows bullish divergence: higher lows while price made lower lows
Suggests potential upside momentum or a short-term bounce
MACD (Moving Average Convergence Divergence)
Histogram flattening and trending upward
Signal lines converging, hinting at a possible bullish crossover
Overall Setup
UPS is at a potential reversal zone after an oversold move!
Holding above $82 could trigger a bounce toward $88–$90!
A breakdown below $82 with volume may open downside to $78!
LTC 4H Analysis - Key Triggers Ahead☃️ Welcome to the cryptos winter , I hope you’ve started your day well.
⏰ We’re analyzing LTC on the 4-Hour timeframe .
👀 After the sharp and deep drop that Litecoin experienced in 3 candles, it moved toward its key support in the $102 area and was well supported from this zone. Then it formed a higher low and higher high compared to its previous low and high, and it is now moving to break its resistance in the $107 area. With a 4-hour confirmation on this zone (the taker-seller and key resistance), it can move upward.
🧮 Two key zones are considered for the RSI oscillator: the 63 level, which is close to the 70 zone—if the volatility crosses this level, Litecoin can move toward overbought. The second zone is the entry threshold into oversold.
🕯 The size and volume of the candles in the recent drop, which can be considered a price correction, are really significant and large. Scattered sell orders are placed above the area we marked, which causes our green candles below this zone to appear a bit smaller. To break the specified taker-seller area, we need a large candle with relatively high volume that fully confirms (stabilizes) on this zone to shape our bullish and high-momentum trend.
💸 BINANCE:LTCBTC is bearish against the Bitcoin pair and has not turned bullish yet, but it is positioned a bit above its support floor. With a breakout of the taker-seller zone in the USDT pair, the Litecoin/Bitcoin pair might also turn bullish, which would increase the movement momentum and the size of the candles.
🧠 For a Litecoin long position, we have to wait until we confirm above this taker-seller area with a strong whale candle and then examine the available scenarios for the breakout.
↗️ Long position scenario: breaking the taker-seller area and key resistance at $107 along with whale candles, and then observing a multi–time frame indecision candle, which will also give us a smaller stop size.
📉 Short position scenario: if the market wants to give a heavy and strong correction, the $102 area can be a good zone for a floor break and a short position on this coin—but the important point for us is that Litecoin is about to start a good bullish trend.
❤️ Disclaimer : This analysis is purely based on my personal opinion and I only trade if the stated triggers are activated .

Continuation in Wheaton Precious Metals?Wheaton Precious Metals has climbed along with silver, and some traders may expect continuation to the upside.
The first pattern on today’s chart is the August 8 high of $103.81. WPM crossed that level in early September and tested it in the middle of the month. Does holding the old peak suggest old resistance has become new support?
Second, prices have remained above the rising 8- and 21-day exponential moving averages. That may be consistent with an uptrend.
Third, MACD’s sharp rise in recent weeks may reflect bullish momentum.
Finally, the silver producer didn’t hit an all-time intraday high last week. It nonetheless recorded its highest closing price ever, 1.4 percent above the previous record on September 15. That could suggest that buyers remain active and sellers remain relatively quiet.
TradeStation has, for decades, advanced the trading industry, providing access to stocks, options and futures. If you're born to trade, we could be for you. See our Overview for more.
Past performance, whether actual or indicated by historical tests of strategies, is no guarantee of future performance or success. There is a possibility that you may sustain a loss equal to or greater than your entire investment regardless of which asset class you trade (equities, options or futures); therefore, you should not invest or risk money that you cannot afford to lose. Online trading is not suitable for all investors. View the document titled Characteristics and Risks of Standardized Options at www.TradeStation.com . Before trading any asset class, customers must read the relevant risk disclosure statements on www.TradeStation.com . System access and trade placement and execution may be delayed or fail due to market volatility and volume, quote delays, system and software errors, Internet traffic, outages and other factors.
Securities and futures trading is offered to self-directed customers by TradeStation Securities, Inc., a broker-dealer registered with the Securities and Exchange Commission and a futures commission merchant licensed with the Commodity Futures Trading Commission). TradeStation Securities is a member of the Financial Industry Regulatory Authority, the National Futures Association, and a number of exchanges.
Options trading is not suitable for all investors. Your TradeStation Securities’ account application to trade options will be considered and approved or disapproved based on all relevant factors, including your trading experience. See www.TradeStation.com . Visit www.TradeStation.com for full details on the costs and fees associated with options.
Margin trading involves risks, and it is important that you fully understand those risks before trading on margin. The Margin Disclosure Statement outlines many of those risks, including that you can lose more funds than you deposit in your margin account; your brokerage firm can force the sale of securities in your account; your brokerage firm can sell your securities without contacting you; and you are not entitled to an extension of time on a margin call. Review the Margin Disclosure Statement at www.TradeStation.com .
TradeStation Securities, Inc. and TradeStation Technologies, Inc. are each wholly owned subsidiaries of TradeStation Group, Inc., both operating, and providing products and services, under the TradeStation brand and trademark. When applying for, or purchasing, accounts, subscriptions, products and services, it is important that you know which company you will be dealing with. Visit www.TradeStation.com for further important information explaining what this means.

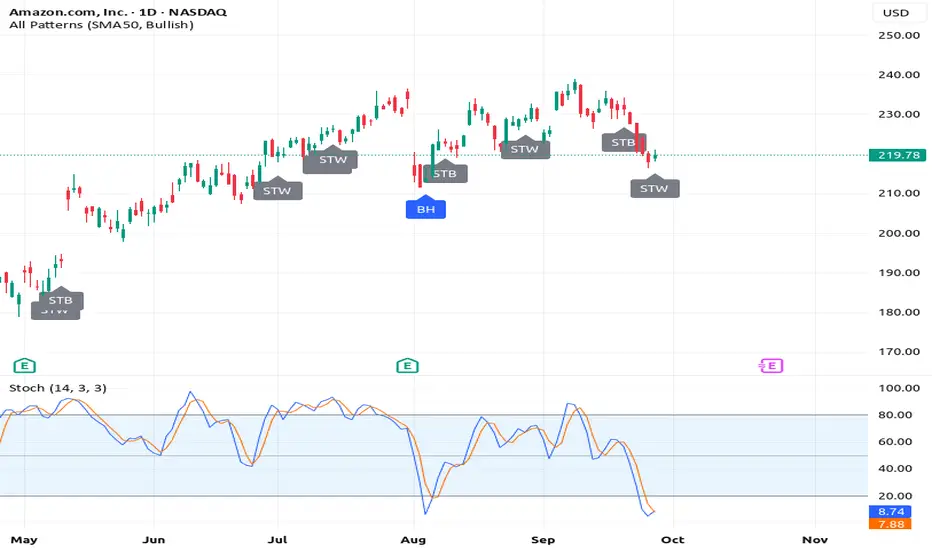
The #1 Chart Pattern:Ascending Triangle - Amazon StockMan am doing my research
and did you know
that you can start a business
using your trading
skills?
This is mind blowing to me
i didn't think a skill
like trading can actually
be a full time
professional career.
So here i am banging my
head against the wall
thinking trading is a hustlers game
with no professional career
at the end of the tunnel.
But this thought is so false.Guys
trading is a real business
infact its the highest
form of business out here.
If you take this thing serious it can lead
to your financial freedom.
Because of this am going to have
a professional trading career
in the future you guys.
I didn't know that it gets this huge.
Am so humbled by this.
The fact that the government
recognises trading as a skill
has really humbled me
And now am starting to
appreciate people
like Robert Kiyosaki.
Who keep encouraging
young people to take up
financial education and change
their lives.
My life has changed or at least
my mindset has seen beyond
what my poor brain could imagine
man.
Anyway look at this chart. NASDAQ:AMZN
Look at the stochastic..(14,3,3)
When that blue line crosses above
the orange line
It will signal an entry signal.
But dont be excited and
expect the price to jump
up immediately.
The pattern is called "Ascending triangle"
This means the price will bounce off the resistance.
before it breakouts out..
That bounce from resistance will form
higher lows which get closer to
the breakout point.
The Spinning Top White Is
The Candlestick charting
technique am using here
Which i learnt from
reading Steve Nison's Book
On Japanese
Charting Techniques,
second edition.
Rocket boost this content to learn more.
Disclaimer: Trading is risky
please risk management
and profit taking strategies.
Also feel free to use a
simulation trading account.
Also dont trade Zero day
options that expire in one day,
please take this as a serious warning.
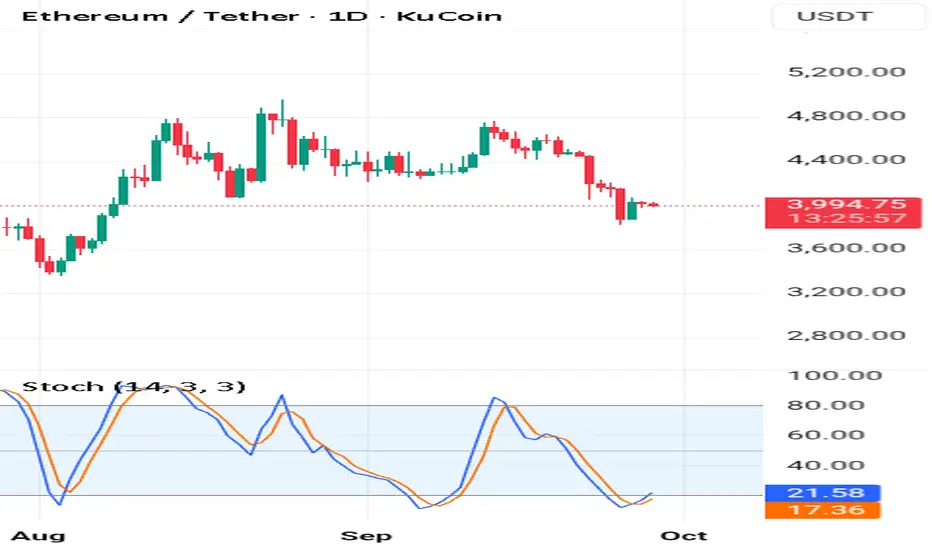
The #1 Reason This Is A Strong Support Am currently thinking of the worse case scenario..
What if I fail in business?
What if I face a family crisis? For example the death of a family bread winner
What if Bitcoin or Ethereum or Pepe coin get delisted on the exchange?
Imagine this happens to you when you have borrowed 💰 money
On the price of Bitcoin going up.
Hoping to use that money to support your business or financial independence?
Life is full of challenges and you have to burn the ⛵ boat.
Now don't get reckless and place all your eggs in one basket.Thats foolishness right?
Well that's what I did I placed all my eggs in one basket.Atleast in the beginning.
Why ?
Because diversification is fake..
It doesn't exist.
What matters are systems and strategies.
With out the right mentors you will fall hard this is what happens to the best of us.
The key is to stay cool and fall back on a system.A system you can hang on to.
Ethereum has its faults but if you can trade it with confidence you will be okay.
Especially if you have a hardware wallet to store it in.
Look at the stochastic the blue line has crossed above the orange line.
Right below level 20 the oversold territory.
This has came after the bullish harami and so far the price is yet to break this support.
The bullish harami support is strong that the reason it's a good buy.
Rocket 🚀 Boost This Content To Learn More
⚠️Warning!!! Don't trade zero day options that expire in one day with high fees for forex trades.
Disclaimer ⚠️ Trading is risky please learn about risk management and profit taking strategies. Also feel free to use a simulation trading account.
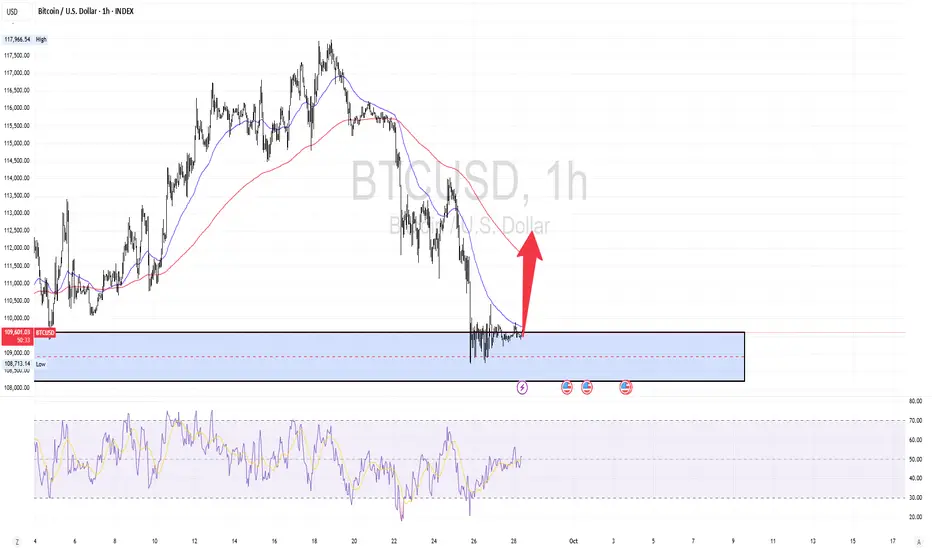
Here is my btcusd technical setup idea.1.The market is currently on the support zone ( H4 SUPPORT ZONE)
2.I am expecting the bounce back from the zone (H4 SUPPORT ZONE)
3.RSI >50 , this indicates momentum to the upside
4.These confirm buy opportunity on H1 time frame
5.Apply proper risk management
CCO | Distribution Pattern | FractalsLooking ahead we can see the next phase of price action falling into a distribution pattern
Since correction wave 4 buyers took off but seem to be running out of steam. Eventually sellers will have to show what they can do after this trend breaks on a lower timeframe.
Ideal move going forward would focus on short positions only with a local swing target of ~$96 since that was the last area of support
Entries would be somewhere at the Head if using textbook patterns (HnS) or SMR
A confirmation entry to be on the safe side would be after the Breakout Bar indicating a change in trend, and then waiting for the Distribution phase to kick in for more shorting opportunities.
To add confluence to this trade idea we can look back at historical price action and find similar fractals that matches with current price movement
At least two fractals are spotted with the same patterns that are building the same price structure we're in
Elliott Impulse Wave, HnS Pattern, and Distribution Phases.
If buyers are not interested in the local support lvl then liquidity at $76 will be next zone.

BONK 4H Analysis – Key Triggers Ahead💀 Hey , how's it going ? Come over here — Satoshi got something for you !
⏰ We’re analyzing BONK on the 4-hour timeframe timeframe .
👀 In the 4-hour timeframe of Bank, we can see that Bank had a good descending channel, which with the recent drop reacted to the midline of the channel and then moved towards the top of the channel, and with a strong 4-hour whale candle, it stabilized above its descending channel and is now completing a pullback to its channel in multi-timeframe.
⚙️ The key RSI area is the 59 zone, which if the fluctuation passes this level, Bank can move upwards and have a trend reversal after this corrective wave.
🕯 The heavy and good increase in Bank’s volume at this bottom shows the presence of the market maker, the size of the 4-hour candle with which we broke the channel top also seems whale-like.
📊 The OTHERS.D index and we can see, this index is inside a 4-hour box, with the breakout of the top of this box which is at the 7.9% area, good money enters Bank. The midline of this box is at the 7.74% area, which if lost, our analysis can fail.
🔔 The areas we considered as alarm zones are the midline area and the top area. As long as we are above the midline area, we can open our position with low risk and a big stop, which is almost high-risk. The alarm zone 0.00002357 can be a more reliable area for breakout and taking trades. Keep in mind that the market conditions seem risky and the market is in decision-making mode.
❤️ Disclaimer : This analysis is purely based on my personal opinion and I only trade if the stated triggers are activated .

HBAR 4H Analysis – Key Triggers Ahead💀 Hey , how's it going ? Come over here — Satoshi got something for you !
⏰ We’re analyzing HBAR on the 4-hour timeframe timeframe .
👀 On the 4H timeframe for HBAR , we can observe that this coin is ranging inside a box with very strong support and resistance levels. The last time, it reacted to the midline of this box (50% zone) and has built a trading structure for a potential breakout.
⚙️ The key RSI levels are at 57 and 35. Once the oscillation surpasses these levels, the price of this coin can shift and bring momentum into the market. Keep in mind that these zones often indicate increased volatility in the direction of price movement.
🕯 The volume of this coin has been decreasing over the past few days, and the number of trades has significantly dropped. Many buy and sell orders have been filled, and the coin is currently ranging in this box, deciding its next direction. Notice that with declining volume, we can often identify a new trend forming, since the current trend may be coming to an end.
📊 On the OTHERS.D index 4H timeframe , we can see that it is also moving inside a box, with the top of the box at the 7.9% zone . Breaking this level along with the RSI surpassing 63 could bring strong volume into the market. At the same time,
📊 a breakout on the TOTAL3 index would also inject solid volume into the market. This index is likewise inside a box, and the last time it reacted to its midline, it rebounded upward and is now moving toward the 1.08 resistance.
💰 Looking at the HBAR/BTC pair , we can observe that it has formed a box-like structure, similar to its USDT pair. With a breakout above the midline, more Bitcoin could be liquidated and converted into this coin. HBAR is considered one of the whales’ favorite coins.
🔔 The alert zones for HBAR carry some risk, and the possibility of failure should also be considered. The long alert zone is around 0.25846, which is the midline of this 4H box. The short alert zone is around 0.22784. Breaking this zone could provide a short position, coinciding with a deeper correction for this coin.
❤️ Disclaimer : This analysis is purely based on my personal opinion and I only trade if the stated triggers are activated .

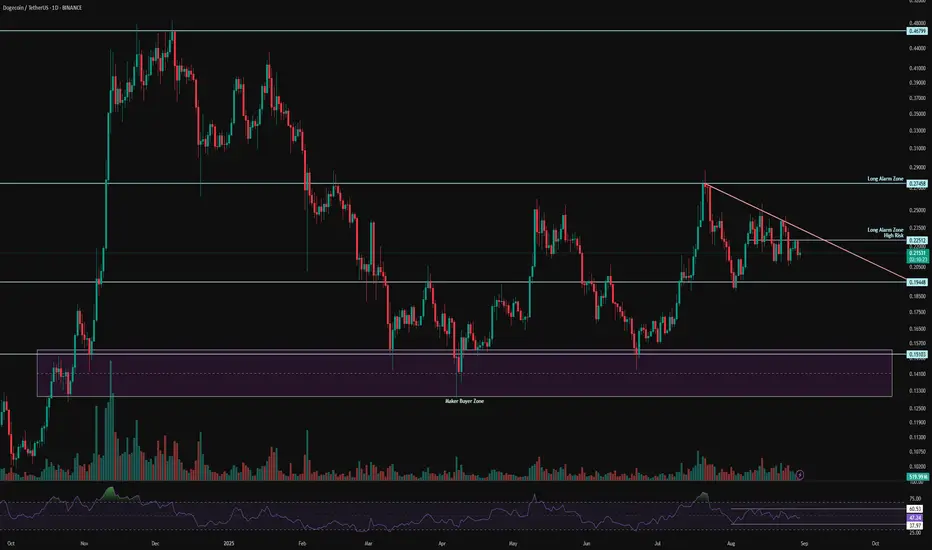
DOGE 1D Analysis – Key Triggers Ahead💀 Hey , how's it going ? Come over here — Satoshi got something for you !
⏰ We’re analyzing DOGE on the 1-Day timeframe timeframe.
👀 In the daily timeframe of Dogecoin, DOGE is within a 170-day box with a ceiling at $0.27 and a floor at $0.15. With a breakout of this box, Dogecoin can experience a parabolic move. DOGE is currently in a triangle-like compression, and with an exit from this compression, DOGE can start its upward movement.
💰 In the daily timeframe of DOGEBTC , We observe that the volume has significantly decreased, and much less Bitcoin is being converted into DOGE! This is quite interesting. The reason DOGE has a box-like behavior against Tether is due to its pairing with Bitcoin. Bitcoin has gained more value against Dogecoin, and DOGE has entered an accumulation phase. Breaking out of this box can help DOGE experience a price jump.
⚙️ Two key RSI zones have been considered: 60 and 38. Exceeding these levels can help DOGE break out of the compression. The 60 level coincides with the break of the $0.22 area and the top of the compression.
🕯 There is a micro buyer zone around $0.15, where every time the price reaches this area, a reversal occurs, accompanied by an increase in the size and volume of green candles. Currently, during the holidays, we are in a compression with lower volume. As the new week begins, we need to see what happens next.
🔔 The alarm zone for Dogecoin is $0.22, which can present some risky trading opportunities, and the next zone is $0.27, which is a strong price action level. Breaking this ceiling can allow DOGE to reach higher recovery levels against Bitcoin.
❤️ Disclaimer : This analysis is purely based on my personal opinion and I only trade if the stated triggers are activated .
TAO 4H Analysis - Key Triggers Ahead💀 Hey , how's it going ? Come over here — Satoshi got something for you!
⏰ We’re analyzing TAO on the 4-Hour timeframe.
👀 On the 4-hour timeframe for Bittensor (TAO), we can see that this coin belongs to the AI category on CoinMarketCap and currently holds rank #35. TAO had been moving inside a continuation descending channel, but it has now successfully broken out of this channel. With a completed pullback and a proper setup candle confirmation in multi-timeframe analysis, this could present a trade opportunity.
⚙️ Key RSI levels for this coin are at 70 (overbought threshold) and 35 (near oversold). At the start of the current leg, during the holiday session, volatility increased strongly, and TAO managed to break through its swing resistances. If RSI pushes above 70 and enters the overbought zone, the coin could experience a solid bullish move.
🕯 The number of green candles has been increasing, and TAO also reacted well to the channel top. At the same time, a major resistance at $322 was broken, with all sell orders at that level fully absorbed.
🪙 Looking at the TAO/BTC pair on the 4-hour timeframe, we can see that after breaking through its previous resistance, the pair is currently consolidating and completing a pullback at this zone. Once the pullback is confirmed with a setup candle, we could have a strong trade confirmation.
💡 The key alarm zones for this coin are:
Around $322, where a reaction followed by a bounce can push the price higher.
With a successful breakout above $327, TAO could gain momentum and continue its bullish trend.
❤️ Disclaimer : This analysis is purely based on my personal opinion and I only trade if the stated triggers are activated .

BTC 1H Analysis - Key Triggers Ahead | Day 48❄️ Welcome to the cryptos winter , I hope you’ve started your day well.
⏰ We’re analyzing BINANCE:BTCUSDT on the 1-Hour timeframe .
👀 On the 1-hour timeframe, Bitcoin previously formed a consolidation box at a higher range. After breaking the bottom of that box, it moved down to its support area around $108,800. Since the start of the weekend, price has been ranging in this zone, forming a new consolidation structure. The bottom of this range overlaps with the Tether Dominance resistance, creating a key confluence level. Candle size has been shrinking, signaling an incoming decision point for the next move.
A break above the range high at $109,755 could trigger upward momentum. An important detail here is the fakeout at the top of the range, where buyers failed to push higher and sellers drove price back down.
🧮 The RSI oscillator shows two key levels:
52: Slightly above the 50 baseline, acting as momentum resistance.
30: At the oversold boundary, where a breakdown could start a stronger move.
The previous fakeout at the range high was aligned with a rejection from the RSI resistance around 52, which reinforces the validity of this level. A momentum breakout through this zone could support a long setup.
🕯 Candle size and volume have significantly decreased due to consolidation and the weekend lull. With increased volume at the start of the new week, we can expect stronger candles. It doesn't matter which direction initiates the move — the breakout from this range will likely occur through a whale candle that clears the orderbook in one direction.
💵 From earlier Tether Dominance analysis, a break below 4.46% could inject bullish volume into the market and allow Bitcoin to break its range high and begin a new upward leg. However, a break above 4.72% on Tether Dominance could trigger deeper correction in Bitcoin, pushing it toward lower supports.
🧠 Two main scenarios for Bitcoin positions are currently in play:
1️⃣ Long Setup :
Wait for multiple rejections to complete and for Tether Dominance to lose the 4.46% support. A small green indecision candle before the breakout on Bitcoin would offer a clean entry with a tight stop. As volume increases and confirmation appears, the long position can be held to a suitable reward target. This setup can be taken in inverse correlation to Tether Dominance, using bearish candles there as confirmation.
2️⃣ Short Setup :
If Tether Dominance breaks above resistance and Bitcoin loses its current range support — combined with RSI dropping below 30 and price stabilizing under current support, ideally with a red indecision candle — a short setup becomes valid. However, note that Bitcoin demand is currently rising, and upward movement could occur at any moment. Personally, you prefer not to take short positions here.
❤️ Disclaimer : This analysis is purely based on my personal opinion and I only trade if the stated triggers are activated .
