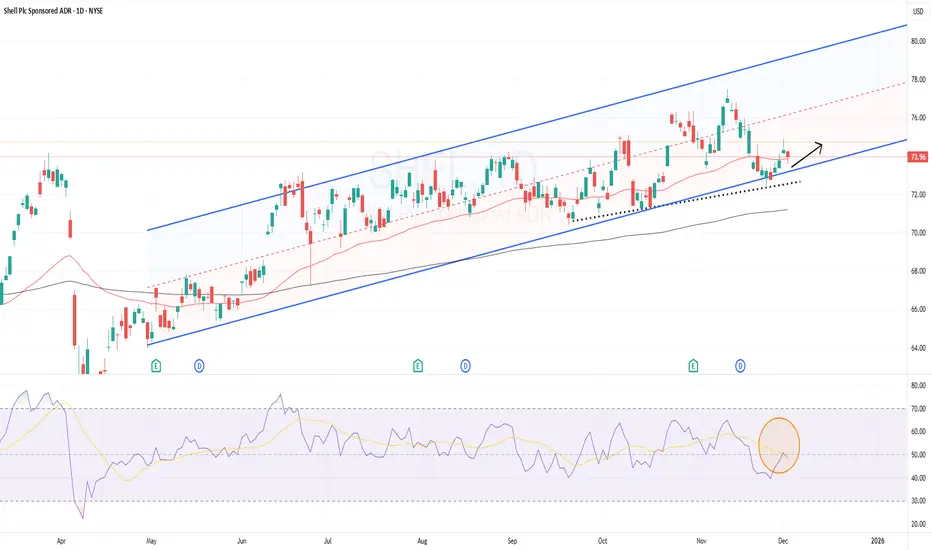
$SHEL offers a good entry point
I’m watching Shell closely — its Q3 2025 results showed strong cash flow: adjusted earnings of $5.4 billion and operating cash flow over $12 billion.
Meanwhile, the company just kicked off a fresh $3.5 billion share buyback, and continues to pay a healthy dividend, which signals confidence in its cash-generation.
On the chart — assuming technical structure holds — the setup looks attractive: price is near the lower end of its ascending channel, 50EMA remains above 200EMA, and dips have tended to bounce off support.
That said, I’m keeping an eye on oil-price volatility and macro headwinds; those could test sentiment if commodity prices slide or demand softens.
Bottom line: Shell looks like a solid dividend-plus-value play right now — I’d consider entry on a dip, with a medium-term horizon.
Oscillators
Possible Long Trade in USDJPY 1 HR TimframeReading raw price action has given us an impression that Buyers have taken control of the market. Advance Technical Analysis tools used.
1. Price Action Reading
2. Pitchforks
3. Market Manipulation techniques
4. Relative Strength Index
5. Frequency Shifting

USD/NOK bears on wedge watchUSD/NOK finds itself coiling within a rising wedge following a prolonged downtrend earlier this year, fitting the textbook definition of a bearish continuation pattern. With the pair now testing uptrend support, traders should be alert to the risk of a bearish breakdown that may open the door to lower levels.
While an eventual bearish break is favoured, traders may want to wait for confirmation of the breakdown before entry, with support at 10.1000 and the important 50DMA located just beneath. The preference would be to wait for a close beneath the latter before considering the setup, allowing for a stop to be placed above the 50DMA or 10.1000 to protect against reversal.
The psychologically important 10.0000 level looms as a key nearby hurdle for bears, with 9.9525 support another level to keep on the radar. Should the pair eventually clear the June low of 9.8650, the September lows would loom as the eventual trade target.
There is no definitive signal from RSI (14) and MACD when it comes to directional bias, other than upside strength is waning quickly, placing more emphasis on price action and signals to determine how to proceed.
Good luck!
DS

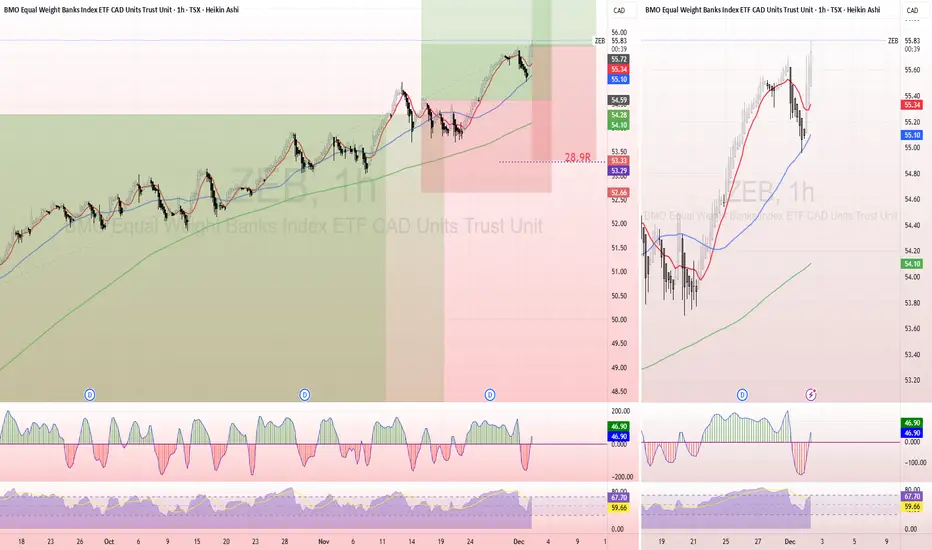
ZEB – Trend Structure Intact - 3rd Entry Following Strategy RuleRe-entered ZEB for the 3rd time as it rotated cleanly back into strength. Price respected the trend structure again- higher lows, higher highs- and reclaimed both the 20MA and 50MA on the 1h.
This entry follows my system rules exactly:
Trend confirmed (20MA > 50MA, both rising).
Pullback held structure inside the model’s “buy window.”
Heikin-Ashi flip back into momentum.
RSI + CCI reset without breaking the broader trend.
Risk stays constant by placing the stop below the structural invalidation.
This ETF doesn’t move fast, but it respects structure exceptionally well. I’m treating it as a slow, steady trend trade with compounding opportunity.
Trade Plan
Entry: Current reclaim of the trendline and MA cluster
Stop: Below the previous structural low (invalidates the setup)
Risk: Kept identical to prior entries 1% total account
If the trend continues, I’ll trail the stop behind Daily 50 MA and keep adding only when structure supports it.
Sticking to the plan > feelings.
#ZEB #TSX #Banks #ETF #TrendFollowing #HeikinAshi #RiskManagement
Mastering Divergence in Technical AnalysisIn technical analysis, a divergence (also called a “momentum divergence” or “price/indicator disagreement”) is one of the most powerful early warning signals available to traders. In simple terms, divergence occurs when price and a momentum indicator (such as RSI, MACD, or Awesome Oscillator etc.) move in opposite directions.
This disagreement often signals that the current trend is losing strength and that a pause, pullback, or full reversal may be approaching.
1. What Is Divergence?
Normally, in a healthy trend:
In an uptrend, price makes higher highs and momentum indicators also make higher highs.
In a downtrend, price makes lower lows and momentum indicators also make lower lows.
A divergence appears when this alignment breaks.
Typical example with RSI or MACD:
Price makes a higher high,
But the indicator makes a lower high.
This tells us that, although price has pushed to a new extreme, the underlying momentum is weaker. Smart money may be taking profits, and the late participants are driving the final leg of the move.
2. Types of Divergence
There are two main families of divergence:
Regular (classic) divergence – often associated with potential trend reversals.
Hidden divergence – often associated with trend continuation after a correction.
Within each family, we have bullish and bearish versions.
2.1 Regular Bullish Divergence – Potential Trend Reversal Up
This suggests that sellers are still pushing price to new lows, but momentum is no longer confirming the strength of this selling pressure. The downtrend is weakening and a bullish reversal may develop.
Context where it’s most powerful:
After a prolonged downtrend.
At or near a higher-timeframe support level (daily/weekly support, major demand zone, trendline, or Fibonacci confluence).
2.2 Regular Bearish Divergence – Potential Trend Reversal Down
This signals that buyers are still able to push price higher, but each new high is supported by less momentum. The uptrend is aging, and a bearish reversal or deeper correction becomes more likely.
Context where it’s most powerful:
After a strong, extended uptrend.
Around major resistance levels, supply zones, or upper trendlines.
2.3 Hidden Bullish Divergence – Trend Continuation Up
Here, price structure still shows an uptrend (higher lows), but the indicator has overshot to the downside. This often appears during pullbacks within an uptrend, suggesting that the correction is driven more by short-term emotion than by real structural weakness.
Interpretation:
Hidden bullish divergence indicates trend continuation. Bulls remain in control, and the pullback may provide an opportunity to join the uptrend at a better price.
2.4 Hidden Bearish Divergence – Trend Continuation Down
Price structure still favors the bears (lower highs), but the indicator has spiked higher, often due to a sharp counter-trend rally. This suggests that the bounce is corrective rather than the start of a new uptrend.
Interpretation:
Hidden bearish divergence favors continuation of the downtrend and often appears before the next impulsive bearish leg.
3. Which Indicators to Use?
Divergence can be spotted on many oscillators, but the most commonly used are:
RSI (Relative Strength Index) – very popular for spotting overbought/oversold zones and divergences.
MACD (and its histogram) – useful for trend and momentum, especially on higher timeframes.
Stochastic Oscillator – often used in range-bound environments.
Awesome Oscillator, CCI, etc. – alternative momentum tools, depending on your preference.
The concept is the same: price and indicator should generally confirm each other. If not, you have a divergence.
4. Timeframes and Reliability
Divergences can be found on all timeframes, but their reliability increases with higher timeframes:
On M5–M15, divergences are frequent but often short-lived. Better for scalpers.
On H1–H4, signals have more weight and can lead to multi-session moves.
On Daily/Weekly, divergences can mark major tops and bottoms, but they may take longer to play out.
A good practice is to:
Identify major divergences on higher timeframes (H4, Daily).
Refine entries on lower timeframes (M15, M30, H1) using structure and price action.
5. How to Trade Divergences (Practical Framework)
Divergence by itself is not a complete trading system. It is a signal of potential imbalance, which should be combined with:
Key levels (support, resistance, supply/demand zones).
Trend structure (higher highs/lows or lower highs/lows).
Price action confirmations (reversal candles, break of structure, etc.).
Risk management (position sizing, stop loss, invalidation level).
6. Common Mistakes When Using Divergences
- Trading every divergence blindly.
Not every divergence leads to a big reversal. Many will result in only minor pullbacks.
- Ignoring the trend.
Regular divergences against a strong trend can fail multiple times before a real top or bottom forms. Hidden divergences are often more reliable in trending markets.
- Forcing divergences where they don’t exist.
Only connect clear, obvious swing highs and lows on both price and indicator. If you have to “stretch” the lines, the signal is probably weak.
- No risk management.
A divergence is just a probability edge, not a guarantee. Always define invalidation and manage position size accordingly.
7. Best Practices
Combine divergence with market structure (trendlines, channels, higher highs/lows).
Use higher-timeframe context and drop to lower timeframes for refined entries.
Pay attention to confluence:
Divergence + key level + candlestick signal is stronger than any single factor.
Keep a trading journal of divergence setups, including screenshots from your charts. Over time, you will see which conditions work best for your style.
Divergences are not magic, but they are one of the cleanest ways to see when price and momentum disagree. Used correctly, they can:
Help you avoid entering late in a trend,
Alert you to potential reversals before they are obvious to the crowd, and
Provide high-probability continuation entries via hidden divergences within strong trends.
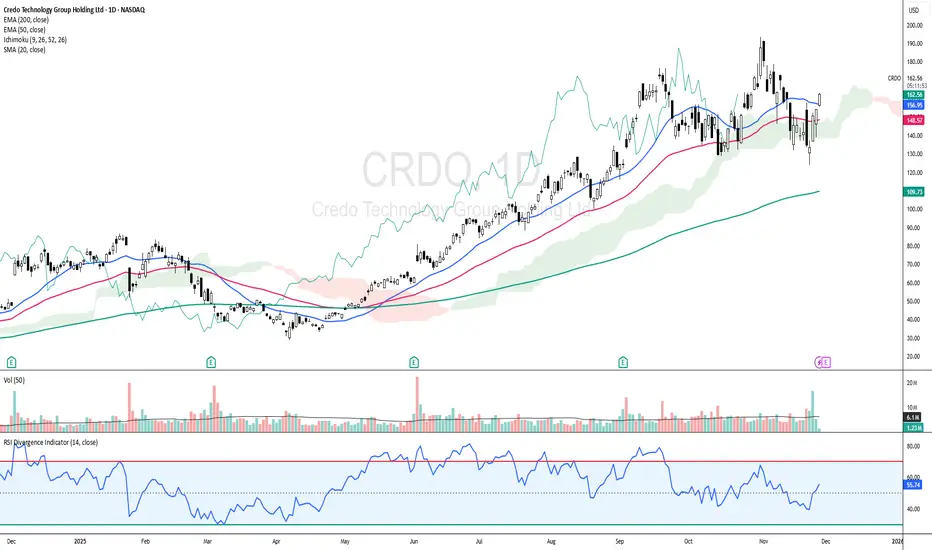
CRDO: Cloud + EMAs Aligning for Upside ContinuationCRDO - CURRENT PRICE : 162.95
CRDO is showing a bullish reversal setup as price rebounds and closes back above the EMA50 while holding firmly above the Ichimoku Cloud , signaling the major trend remains intact. Momentum is improving with RSI rising above 50 and not yet overbought, supported by increasing volume on the recent bullish white candlestick.
Today’s move above the 20-day SMA adds a positive layer to the short-term trend structure. Short term targets are 175.00 and 185.00 while support is 148.00.
ENTRY PRICE : 160.00 - 162.95
FIRST TARGET : 175.00
SECOND TARGET : 1.85
SUPPORT : 148.00
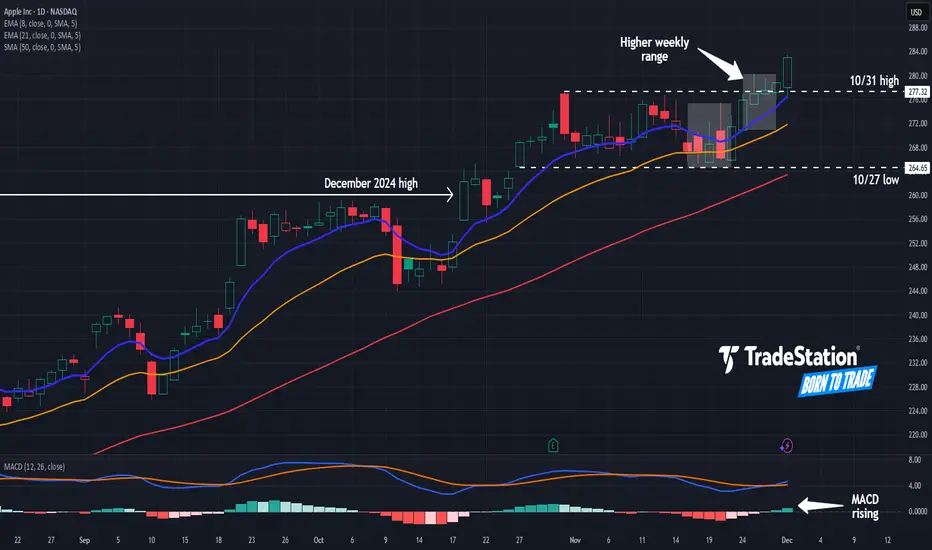
Apple May Be AcceleratingApple spent November quietly consolidating, and it may be accelerating in December.
The first pattern on today’s chart is the $260.10 level, a previous all-time high from December 2024. AAPL crossed above that price in late October and has remained there since, which could mean old resistance has broken.
Second, the smartphone giant made a weekly low of $264.65 on October 27. It’s remained above that level since. That may suggest that new support has been established.
Third, last week’s range featured a higher high and a higher low relative to the previous week. The stock also closed above a previous high of $277.32 from October 31.
Such price action is potentially consistent with a gradual breakout.
Next, the stock is above its 50-day simple moving average and its 8-day exponential moving average (EMA) is above its 21-day EMA. MACD is also rising. Those signals may reflect a bullish trend.
Finally, AAPL is a highly active underlier in the options market. (Its average daily volume of 808,100 contracts ranks fifth in the S&P 500, according to TradeStation data.) That may help traders take positions with calls and puts.
TradeStation has, for decades, advanced the trading industry, providing access to stocks, options and futures. If you're born to trade, we could be for you. See our Overview for more.
Past performance, whether actual or indicated by historical tests of strategies, is no guarantee of future performance or success. There is a possibility that you may sustain a loss equal to or greater than your entire investment regardless of which asset class you trade (equities, options or futures); therefore, you should not invest or risk money that you cannot afford to lose. Online trading is not suitable for all investors. View the document titled Characteristics and Risks of Standardized Options at www.TradeStation.com . Before trading any asset class, customers must read the relevant risk disclosure statements on www.TradeStation.com . System access and trade placement and execution may be delayed or fail due to market volatility and volume, quote delays, system and software errors, Internet traffic, outages and other factors.
Securities and futures trading is offered to self-directed customers by TradeStation Securities, Inc., a broker-dealer registered with the Securities and Exchange Commission and a futures commission merchant licensed with the Commodity Futures Trading Commission). TradeStation Securities is a member of the Financial Industry Regulatory Authority, the National Futures Association, and a number of exchanges.
Options trading is not suitable for all investors. Your TradeStation Securities’ account application to trade options will be considered and approved or disapproved based on all relevant factors, including your trading experience. See www.TradeStation.com . Visit www.TradeStation.com for full details on the costs and fees associated with options.
Margin trading involves risks, and it is important that you fully understand those risks before trading on margin. The Margin Disclosure Statement outlines many of those risks, including that you can lose more funds than you deposit in your margin account; your brokerage firm can force the sale of securities in your account; your brokerage firm can sell your securities without contacting you; and you are not entitled to an extension of time on a margin call. Review the Margin Disclosure Statement at www.TradeStation.com .
TradeStation Securities, Inc. and TradeStation Technologies, Inc. are each wholly owned subsidiaries of TradeStation Group, Inc., both operating, and providing products and services, under the TradeStation brand and trademark. When applying for, or purchasing, accounts, subscriptions, products and services, it is important that you know which company you will be dealing with. Visit www.TradeStation.com for further important information explaining what this means.
Gold Continued Support Feasible - Next Target for $4500? I believe if the oscillators play out, we can have another trendline support, even with aroon down, it could be quite minimal and a retracement for $4500 support per oz is possible. Gold as an asset and commodity seems to be getting scarcer and the demand for Gold including even in electronics is something I expect will increase. As always, none of this is investment or financial advice. Please do your own due diligence and research.

FireHoseReel | Aster: ASTER Bears Are Taking Control🔥 Welcome to FireHoseReel !
Let’s dive into the ASTER analysis.
⚡️ ASTER was moving along a bearish curve, broke its key support, and has now printed a 4H candle close below 1.078 — which confirms the breakdown.
📊 ASTER volume has dropped significantly.
This low volume suggests that a strong expansion may be ahead, and if the next move aligns with the trend, it could offer a solid risk-to-reward setup.
🧮 The RSI oscillator is now testing the 37.5 level.
This zone represents the 4H oversold area for ASTER, which can help accelerate bearish price movement if momentum continues.
✍️ There is currently one main scenario for ASTER, detailed below.
🔴 Short Position Scenario
If ASTER continues to close below this level, accompanied by rising sell volume and RSI breaking below 37.5, the bearish trend can be considered confirmed.
🛞 Risk Management & Disclaimer
Please remember to always use proper risk management and position sizing. Nothing in this analysis is financial advice. The market can change quickly, so always trade based on your own strategy, research, and risk tolerance. You are fully responsible for your own trades.

Bitcoin's daily chart on fire
Daily time frame with a medium-term view
1. Market trend:
Downward trend
2. Supports and resistances:
Support levels:
1- 84.646
2- 76.236
3- 67.672
Resistance levels:
1- 100.889
2- 110670
3- 123.410
3. Technical tools and indicators:
The RSI oscillator has reached near the oversold zone again after a short-term rest, and if it enters the oversold zone, it could signal further price declines.
4. Price patterns:
No specific pattern is observed.
5. Trade volume:
The trading volume is increasing in the downward trend.
Market scenarios ahead:
- Price increase scenario (bullish):
For the bullish scenario, we need the price to close above 100889; in that case, the targets of 110670 and 123410 are accessible.
- Price decrease scenario (bearish):
If the candle closes below the price of 84646, we enter the bearish scenario, in which case the targets of 76236 and 67672 are accessible.
Final note:
This view is merely a personal analysis, and the responsibility for trading transactions rests entirely with the trader. Always consider proper and safe risk management.
#Technical_Analysis #Financial_Markets #closetrader

Why I Think GBPJPY Might Continue Selling...Technical Analysis Hey Rich Friends,
Happy first day of December! I wanted to share my analysis of GBPJPY. I haven't made any moves yet but I will be looking at it for a sell. This is only my technical analysis so I encourage you to check the news and cross-reference the indicators on your own chart. Here is what I am looking at:
- Price has crossed and closed below the previous level of support at 205.730 on H4. This is a bearish confirmation for me.
- The selling momentum has picked up over the last couple of hours
- The stochastic is below 20 on H4. This is a bearish confirmation for me.
Additional information:
- I will be setting sell stops and TPs at previous lows. A will choose a previous high as my SL.
- It's consolidating a little bit right now, but I have more sell confirmations.
Good luck if you decide to take this trade or trade this week.
Peace and Profits,
Cha

Taiwan Semi: Uptrend Intact?Taiwan Semiconductor trended higher earlier this year, and some traders may see potential for further upside.
The first pattern on today’s chart is the September 25 low of $270.19. TSM probed that level on November 21 but closed above it. That kind of false breakdown, followed by gains, may indicate that support is in place.
Second, the chip foundry made a series of lower highs in the first half of November. However it broke through that falling trendline last week, which could suggest its pullback has ended.
Third, prices are above the 8- and 21-day exponential moving averages. MACD is also turning higher. Are bulls taking control of the short-term trend?
Next, the stock is holding near its 50-day simple moving average. That may be consistent with an intermediate-term uptrend.
Finally, TSM is an active underlier in the options market. That could help traders take positions with calls and puts.
TradeStation has, for decades, advanced the trading industry, providing access to stocks, options and futures. If you're born to trade, we could be for you. See our Overview for more.
Past performance, whether actual or indicated by historical tests of strategies, is no guarantee of future performance or success. There is a possibility that you may sustain a loss equal to or greater than your entire investment regardless of which asset class you trade (equities, options or futures); therefore, you should not invest or risk money that you cannot afford to lose. Online trading is not suitable for all investors. View the document titled Characteristics and Risks of Standardized Options at www.TradeStation.com . Before trading any asset class, customers must read the relevant risk disclosure statements on www.TradeStation.com . System access and trade placement and execution may be delayed or fail due to market volatility and volume, quote delays, system and software errors, Internet traffic, outages and other factors.
Securities and futures trading is offered to self-directed customers by TradeStation Securities, Inc., a broker-dealer registered with the Securities and Exchange Commission and a futures commission merchant licensed with the Commodity Futures Trading Commission). TradeStation Securities is a member of the Financial Industry Regulatory Authority, the National Futures Association, and a number of exchanges.
Options trading is not suitable for all investors. Your TradeStation Securities’ account application to trade options will be considered and approved or disapproved based on all relevant factors, including your trading experience. See www.TradeStation.com . Visit www.TradeStation.com for full details on the costs and fees associated with options.
Margin trading involves risks, and it is important that you fully understand those risks before trading on margin. The Margin Disclosure Statement outlines many of those risks, including that you can lose more funds than you deposit in your margin account; your brokerage firm can force the sale of securities in your account; your brokerage firm can sell your securities without contacting you; and you are not entitled to an extension of time on a margin call. Review the Margin Disclosure Statement at www.TradeStation.com .
TradeStation Securities, Inc. and TradeStation Technologies, Inc. are each wholly owned subsidiaries of TradeStation Group, Inc., both operating, and providing products and services, under the TradeStation brand and trademark. When applying for, or purchasing, accounts, subscriptions, products and services, it is important that you know which company you will be dealing with. Visit www.TradeStation.com for further important information explaining what this means.

USDJPY | Testing the Top of a Multi-Year Triangle – Wave E?USDJPY has started to soften as markets lean toward further Fed easing while the Bank of Japan signals its strongest willingness yet to continue normalizing policy. With yield spreads narrowing and intervention risk staying loud, the pair is losing upside momentum at a structurally important level.
Technical Lens:
The chart highlights a multi-year contracting triangle (A–B–C–D–E) with price reacting at the upper boundary, which aligns with the most recent swing marked as wave D. The rejection from that resistance coincides with a zone of historically stretched USDJPY readings. If this structure continues to play out, the next leg of the pattern would point toward a wave E rotation lower, targeting the lower boundary of the formation.
Scenarios:
If the D-wave boundary continues to hold → price may begin developing a broader E-wave decline, with room toward prior mid-range zones and potentially the lower triangle support.
If price breaks above the D-wave resistance → the broader triangle thesis weakens, opening the door for a reassessment of the overall structure.
Catalysts to Watch:
December BoJ meeting (hike potential, balance-sheet tone).
US data leading into FOMC (jobs, inflation, ISM).
Any intervention headlines or “excess volatility” comments from Japan’s MoF.
Global risk sentiment swings that may drive safe-haven JPY flows.
Takeaway:
This upper trendline remains the key inflection point — as long as price stays capped here, the structure argues for a potential wave E rotation within the multi-year triangle.

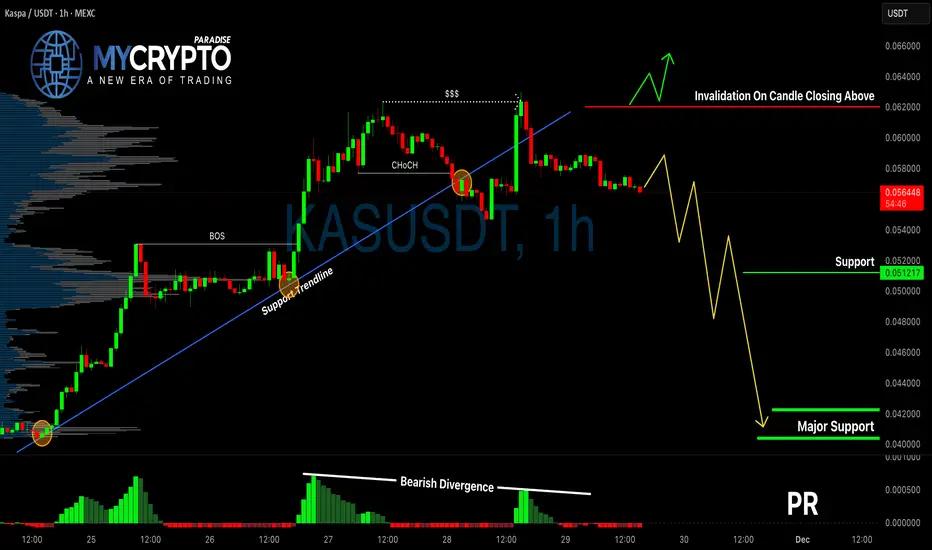
KASUSDT Breakdown Confirmed?Yello Paradisers, have you already positioned yourself on KASUSDT’s bearish move, or are you about to get trapped by a false bounce? The market just gave us a major clue, and ignoring it could cost you.
💎KASUSDT has officially broken below a critical supportive trendline, which was previously holding the structure intact. This breakdown wasn’t random—it came with a clean bearish CHoCH (Change of Character), and the MACD histogram is flashing a clear bearish divergence. These combined signals significantly increase the probability that this is not just a minor pullback, but the beginning of a more aggressive downside move.
💎From the current market level, there is already a straightforward 1:1 risk-reward opportunity on the table. However, if price pulls back toward the previous support (now resistance), that would offer a much better entry zone with improved risk-reward. But don’t jump in blindly—what we want to see at that level is a bearish candlestick confirmation. Without it, you're only guessing. With it, you’re trading with probability on your side.
💎On the flip side, if KASUSDT breaks out and closes decisively above the invalidation level, that would fully invalidate the current bearish thesis. In that case, it’s smarter to stay on the sidelines and wait for a new high-probability setup to form. This market doesn’t reward impulsive decisions—it rewards patience, discipline, and precision.
🎖Strive for consistency, not quick profits. Treat the market as a businessman, not as a gambler.
MyCryptoParadise
iFeel the success🌴
A Thesis Of A Trade: Developing A Story For Each TradeThe plan is the same, but each pair has a different story and different thesis. Previously, I have reported that I open a batch of trades and closing them all when I reach a certain profit percentage based on the Stochastic Plan.
Last week the batch stayed negative, but all are still within the plan and not a single one broke the idea of the reason why they were opened. This opened the door for me to start treating each trade on its own instead of opening and closing batches. This is something that I wanted to implement but did not have the heart for it, especially that this is the first time for me to trade the scary daily time frame.
Today is Monday, and accidentally it is the 1st of the month, and the 1st of December. This month I am going to try to keep at the methodology of treating each trade independently and create a thesis for each trade.
Such a methodology with a thesis for each trade allows, as one of the comments of one of my previous videos here suggested, to create structural Stop Loss and Take Profit points. The thesis will tell a story of the pair. Why I opened the trade and where do I see it going based on the stochastic trigger and the chart elements.
The thesis will also show when is the thesis going to be negated and no more stands and therefore needs to be stopped even at a loss. A break of thesis means that the reason why a trade was opened no longer exists and I need to get out of it.
In the same manner, the thesis will look at the chart elements and see potential areas where the price might stop moving in my direction and this is again a point where I would close the trade in my favor.
Everyday now I feel closer to reaching a solid Forex trading plan that I can depend on, and the day of funding a live account is getting closer. I am looking at funding an account by the end of this month to start the year 2026 trading live.

AUD/USD eyes wedge breakoutAUD/USD starts the new month testing downtrend resistance dating back to the highs set on September 17. Coiling within a falling wedge, convention suggests a bullish breakout could see the pair retest .6700.
Should we see a clean break above the downtrend, longs could be established above the level with a stop beneath for protection. Given the first attempt in holiday-thinned trade last Friday failed, some may prefer to wait for a close above the trendline before considering the trade.
The November high of .6580 looms as the first topside test, although there’s no meaningful resistance until .6625, where price was capped for lengthy periods earlier in the year. If that level breaks, only minor resistance at .6660 stands between a retest of the September highs above .6700.
The momentum picture remains mixed but is quickly shifting in favour of bullish setups, with RSI (14) now pushing higher above 50 while MACD has crossed the signal line from below and is moving quickly towards positive territory. Should these trends persist, it would favour bullish setups over shorts, increasing the appeal of the trade if a breakout occurs.
Good luck!
DS

AUDUSD Sell Setup 4H Chart
AUD/USD on the H4 timeframe is offering a potential short opportunity, but only with confirmation. The RSI being overbought aligns with the expectation of a near-term pullback, yet the decisive element will be a bearish engulfing candle at the channel resistance.
Until that appears, this remains a watch-and-wait environment, not an early entry zone. Market Structure:
Channel-Bound Price Action
On the 4-hour timeframe, AUD/USD has been respecting a clearly defined descending channel. Price is currently trading near the upper boundary, which typically acts as dynamic resistance.
Key implications:
The closer the price is to the top of the channel, the higher the probability of a corrective pullback. However, channels often break when momentum and fundamentals align, so resistance must be confirmed by price rejection — not assumed.
Momentum Conditions: RSI Overbought
RSI on the H4 chart has moved into overbought territory.
This signals short-term exhaustion in bullish momentum. Increased likelihood of a corrective move lower. However, RSI becoming overbought in an uptrend can indicate strength, not necessarily a reversal.
3. Candlestick Confirmation: Bearish Engulfing as Key Trigger
Given the context, a bearish engulfing candle at channel resistance offers exactly the kind of confirmation needed before entering a short position. So we'll wait for that trigger.
Targets
First target (T1): Middle Channel midline.
Second target (T2): Opposite boundary of the channel.

FireHoseReel | USDT Dominance Is Loading a Market Shakeout🔥 Welcome To FireHoseReel !
Let's dive into DominanceUSDT Structure .
🎯 After breaking its bullish curve, USDT Dominance formed a higher low on the 4H timeframe compared to the previous bottom.
A sharp drop alongside a strong Bitcoin rally was needed to break its supports — but that scenario did not happen.
🌪 USDT.D has now broken its descending trendline and is facing resistance at 6.073%.
A breakout above this zone could restart a broader market correction and trigger a retest of the 4H high.
🧮 On the 1H timeframe, RSI has formed an overbought level.
A momentum break above this zone could drive USDT dominance sharply higher.
💡 Summary: USDT dominance still has bullish strength.
If it continues to move upward, our short position triggers could become active.
🛞 Risk Management & Disclaimer
Please remember to always use proper risk management and position sizing. Nothing in this analysis is financial advice. The market can change quickly, so always trade based on your own strategy, research, and risk tolerance. You are fully responsible for your own trades.

FireHoseReel | BNB Daily Analysis #10🔥 Welcome To FireHoseReel !
Let's dive into BinanceCoin Structure Analysis.
👀 On the 1H timeframe, BNB failed to activate our long trigger and has now broken its key support at $875, closing a candle below this level.
📊 BNB volume has dropped sharply, which actually helps clarify the chart. Whenever volume contracts like this, it often signals that the next major move is getting closer.
🧮 The RSI oscillator is now near its oversold zone.
If RSI breaks below and holds under the 36.5 level, it can accelerate bearish momentum and strengthen the downside move.
✍️ Below are the key scenarios for BNB, which you can use alongside your own trading setup:
🟢 Long Scenario:
A breakout above $902 with rising buy volume.
🔴 Short Scenario:
A break below $875 with increasing sell volume, combined with RSI falling below 36.5, can provide a clean short or exit setup.
🛞 Risk Management & Disclaimer
Please remember to always use proper risk management and position sizing. Nothing in this analysis is financial advice. The market can change quickly, so always trade based on your own strategy, research, and risk tolerance. You are fully responsible for your own trades.

asdhy this matters for long-term performance:
• 🎯 Buying SPY during volatility spikes has historically delivered superior forward returns compared with adding exposure during low-volatility periods.
• 💰 High VIX readings correspond to discounted prices, elevated risk premia, and stronger 6–12 month forward outcomes.
• 🟡 Low VIX environments, like the current one, signal complacency and a less attractive asymmetry for new entries.
In our view, the present volatility reset — with the VIX back near its lower range while the S&P 500 hits new highs — argues for ca

VRT – Mini Downtrend Break & Momentum Turning UpVRT - CURRENT PRICE : 179.73
VRT breaks out from a minor down channel while holding strongly within the long-term ascending trend channel. 📊 The breakout candle shows renewed buying interest, supported by RSI turning higher from the mid-zone and MACD showing early bullish improvement. 💪 With momentum improving and the long-term trend intact, the setup supports a buy-on-breakout strategy toward the upper channel.
ENTRY PRICE : 176.00 - 179.73
FIRST TARGET : 195.00
SECOND TARGET : 215.00
SUPPORT : 160.00

$BTC Cycle Analysis - ISM vs 4-Year CycleRiddle me this...
If crypto just runs off the ISM and it topped in March 2021 then why did we get a second HIGHER peak in November 2021 ???
All social and risk metrics topped at the same time as the ISM as well...
It's almost as if 🤔

#BCHBTC #1W (Binance) Big falling wedge breakoutCRYPTOCAP:BCH just regained 50MA weekly support in sats, performing better than CRYPTOCAP:BTC
Seems likely to continue bullish towards 200MA resistance, probably after a pull-back.
⚡️⚡️ #BCH/BTC ⚡️⚡️
Exchanges: Binance
Signal Type: Regular (Long)
Amount: 7.0%
Current Price:
0.004885
Entry Targets:
1) 0.004657
Take-Profit Targets:
1) 0.006329
Stop Targets:
1) 0.003987
Published By: @Zblaba
CRYPTOCAP:BCH BINANCE:BCHBTC #BitcoinCash #PoW bitcoincash.org
Risk/Reward= 1:2.5
Expected Profit= +35.9%
Possible Loss= -14.4%
Estimated Gaintime= 4-7 months
