Where Is ETH Going This Cycle? (Educational Perspective)
Every cycle brings the same question:
Where is Ethereum heading next? Most look for price guesses, but that’s a distraction. The real advantage comes from knowing what factors will drive ETH’s direction. Understanding the drivers doesn’t require prediction, it requires planning.
A Look Back: ETH in Previous Cycles
Ethereum has repeatedly proven its resilience and innovation leadership:
2016–2017: Breakout fueled by ICO boom—ETH became the token-launch backbone.
2018–2019: Bear market and ICO collapse—but builders persisted.
2020–2021: DeFi and NFT surge—Ethereum powered the blockchain economy as “digital oil.”
2022–2023: Post-Merge era—transition to PoS and reduced issuance amid regulatory uncertainty.
Through every phase, ETH stayed central to crypto’s evolution.
On-Chain Metrics to Watch
Ethereum’s transparency lets us monitor structural strength in real time:
Active addresses gauge real network use.
Staking levels shrink available supply—over 35M ETH (≈30%) staked by mid-2025.
ETH locked in DeFi reflects collateral demand.
Gas fee burn continues to tighten supply post-EIP-1559.
Macro & Narrative Drivers (2024–2025 Upgrades & ETF Momentum)
Stories move markets, and Ethereum has some strong ones now:
Spot ETH ETF Launch: Nearly $500M in institutional inflows since mid-2024.
Staking Supply Constraint: Record ETH locked → tighter supply.
Technical Enhancements: Dencun (2024) and Pectra (2025) improving scalability and validator usability.
Regulatory & Macro Tailwinds: GENIUS Act, institutional adoption, favorable policies.
The Real Question Traders Should Ask
Price targets are clickbait. The real question is:
“Which factors will move ETH this cycle?”
By tracking ETF flows, staking ratios, upgrades, and macro conditions, traders avoid being surprised.
Community ideas

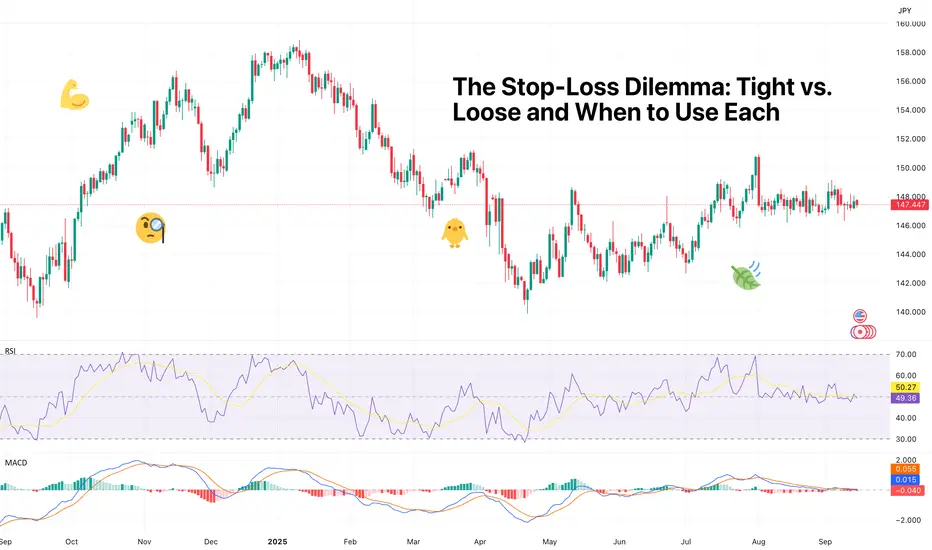
The Stop-Loss Dilemma: Tight vs. Loose and When to Use EachToday we talk about stop losses. Love them or hate them, but don’t forget them, especially when things get wild out there.
Some traders think of them as the trading equivalent of a safety net: you hope you’ll never need it, but when you slip off the tightrope, you’re grateful it’s there to catch you.
Others believe they’re like training wheels that you can ditch when you think you’ve made it. But no matter your style, every trader eventually faces the same question: tight stop or loose stop?
Let’s unpack.
🎯 What a Stop Loss Really Is
At its core, a stop loss is an exit plan for the bad times (or learning times if you prefer). It’s not about being right, it’s about how wrong you want to be. You set a price level that says: “If the market gets here, I don’t want to be in this trade anymore.” That’s it.
The dilemma starts when you realize how wide that safety net should be. Too tight, and you’re out of trades faster than you can say “fakeout.”
That usually happens when the market gets too tough, especially around big news releases. But that’s why you have the Economic Calendar .
Too loose, and you risk turning a small misstep into a full-blown account drain.
📏 The Case for Tight Stops
Tight stops are for the traders who believe in precision. Think scalpers, intraday traders, or anyone not willing to take overnight risk, especially in the unpredictable corners of the crypto universe . These stops are fast, efficient, and don’t have any tolerance for error.
And it happens quick: if you still have your position an hour or two later, you know you’ve survived.
Pros:
Keeps losses small. Risk per trade is limited.
Forces you to be disciplined with entries (you need good timing).
Frees up capital for more setups since each trade risks a relatively small amount.
Cons:
Markets love to hunt tight stops. Wiggles, noise, and random candles can boot you out of a perfectly good trade.
Requires near-perfect timing. Short before the upside is over and you’re out.
Can lead to overtrading – you may start seeing opportunities that aren’t really there.
Tight stops can work if you’re trading liquid instruments with clear technical levels. But if you’re placing them under or over every tiny wick, you’re basically donating to the market makers’ La Marzocco fund.
🏝️ The Case for Loose Stops
Loose stops are the opposite vibe. They belong to swing traders, position traders, and anyone who thinks the market needs “room to breathe.” A loose stop gives your trade the flexibility to be wrong in the short term while still right in the long run.
It’s fairly boring trading. You open a relatively small position, you widen the stop and you forget about it.
Pros:
Avoids getting stopped out by random intraday noise.
Lets you capture bigger moves without micromanaging.
Works well in trending markets.
Cons:
You lock up capital if the trade moves sideways, i.e. risk missing out on other moves.
Larger stops mean smaller position sizes (unless you enjoy blowing up accounts).
Can tempt you to “hope and hold” instead of cutting losers early.
Loose stops demand patience and conviction. They’re not an excuse to set a stop 30% away and take a vacation. They’re strategic, placed around real levels of support/resistance, trendlines, or even moving averages.
⚖️ Finding the Balance
The reality? It’s not tight vs. loose – it’s about context. Your stop should reflect:
Timeframe : Scalping the S&P 500 SP:SPX ? Tight. Swing trading Ethereum BITSTAMP:ETHUSD ? Looser (notice the double “o”).
Volatility : In calm markets, tighter stops work. In choppy ones (like individual stocks during earnings season ), they’ll get shredded.
Strategy : Breakout traders often need loose stops (false breakouts happen). Mean-reversion traders can keep them tight.
Think of it as tailoring your stop to the market’s mood. A tight stop in a trending, low-volatility stock might be perfect. That same stop in crypto? Time to say goodbye.
📉 The Asymmetric Opportunity
Here’s where stop-loss talk gets spicy: risk-reward ratios . A tight stop with a big upside target creates an asymmetric bet. You risk $1 to make $5 or even $15. The problem is, you’ll get stopped out more often. A loose stop, on the other hand, lowers your win rate risk but demands patience and confidence to ride out volatility.
Neither is better. It’s about whether you want more home runs with strikeouts (tight stops) or steady base hits with fewer fireworks (loose stops).
🧠 The Psychological Trap
Stop losses aren’t just math, they’re psychology. Traders often tighten stops after a bruising loss, thinking they’ll “play it safe.” Then they get stopped out again and again. Others loosen stops out of fear, giving trades space, until their account looks like a shrinking balloon.
The trick? Decide your stop before you enter. Not in the heat of the moment. Not after a candle fakes you out. Plan it. Write it down . Stick to it.
🚦 The Takeaway
Stop losses aren’t about being tight or loose – they’re about being intentional. A good stop loss fits your strategy, your timeframe, and your psychology. It’s a line in the sand that says: “I’ll risk this much to make that much.”
Next time you set a stop, are you protecting your capital or just trying to feel safe? Because the market doesn’t care about your comfort zone – it only respects discipline .
👉 Off to you : do you keep your stops tight, loose, or do you freestyle it? Let us know in the comments!
How to Close a Losing Trade?Cutting losses is an art, and a losing trader is an artist.
Closing a losing position is an important skill in risk management. When you are in a losing trade, you need to know when to get out and accept the loss. In theory, cutting losses and keeping your losses small is a simple concept, but in practice, it is an art. Here are ten things you need to consider when closing a losing position.
1. Don't trade without a stop-loss strategy. You must know where you will exit before you enter an order.
2. Stop-losses should be placed outside the normal range of price action at a level that could signal that your trading view is wrong.
3. Some traders set stop-losses as a percentage, such as if they are trying to make a profit of +12% on stock trades, they set a stop-loss when the stock falls -4% to create a TP/SL ratio of 3:1.
4. Other traders use time-based stop-losses, if the trade falls but never hits the stop-loss level or reaches the profit target in a set time frame, they will only exit the trade due to no trend and go look for better opportunities.
5. Many traders will exit a trade when they see the market has a spike, even if the price has not hit the stop-loss level.
6. In long-term trend trading, stop-losses must be wide enough to capture a real long-term trend without being stopped out early by noise signals. This is where long-term moving averages such as the 200-day and moving average crossover signals are used to have a wider stop-loss. It is important to have smaller position sizes on potentially more volatile trades and high risk price action.
7. You are trading to make money, not to lose money. Just holding and hoping your losing trades will come back to even so you can exit at breakeven is one of the worst plans.
8. The worst reason to sell a losing position is because of emotion or stress, a trader should always have a rational and quantitative reason to exit a losing trade. If the stop-loss is too tight, you may be shaken out and every trade will easily become a small loss. You have to give trades enough room to develop.
9. Always exit the position when the maximum allowable percentage of your trading capital is lost. Setting your maximum allowable loss percentage at 1% to 2% of your total trading capital based on your stop-loss and position size will reduce the risk of account blowouts and keep your drawdowns small.
10. The basic art of selling a losing trade is knowing the difference between normal volatility and a trend-changing price change.

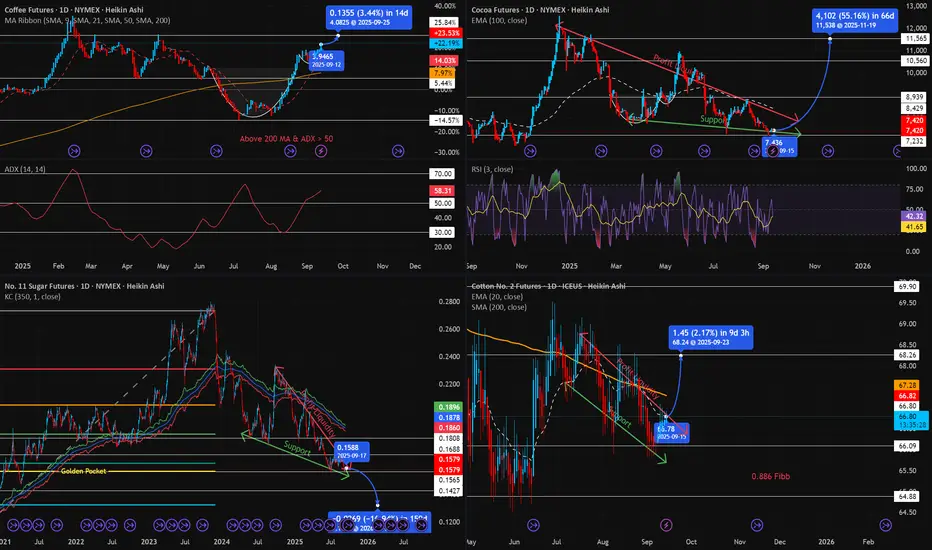
Cocoa, Sugar, Coffee & Cotton Rotation📌 The Soft Commodities Super Guide: Cocoa, Sugar, Coffee & Cotton
Soft commodities — crops grown rather than mined — are among the oldest traded goods in human history. From cocoa beans once used as currency in Central America, to cotton powering textile revolutions, to sugar driving global trade and colonization, and coffee fueling productivity worldwide, these markets remain essential and volatile today.
On exchanges like ICE, CME, and NYMEX, traders can access futures and ETFs to speculate, hedge, or diversify portfolios. Soft commodities are especially attractive because of their strong seasonal patterns, geographic concentration of supply, and sensitivity to weather, politics, and demand shifts.
This guide will cover:
Seasonality of Cocoa, Sugar, Coffee & Cotton
Major Price Drivers
Trading Strategies & ETFs/Stocks
Yearly Rotation Playbook
🔹 1. Seasonality of Major Soft Commodities
Seasonality refers to recurring, predictable patterns of price strength or weakness tied to planting, harvest, and demand cycles.
📈 Cocoa (ICE: CC Futures)
Strongest: Summer (Jun–Sep) → Demand builds, weather risk in West Africa.
Weakest: Winter (Dec–Feb) → Fresh harvest supply hits markets.
📌 Example: June–Sep 2020 rally (+20%) from droughts + demand recovery.
📈 Sugar (ICE: SB Futures)
Best Months: Feb, Jun, Jul, Nov, Dec.
Strong seasonal window: May–Jan (fuel demand + holiday consumption).
Weakest: Mar–Apr (harvest pressure).
📌 Example: Nov–Dec 2020 sugar rally (+15%) as Brazil shifted cane to ethanol.
📈 Coffee (ICE: KC Futures)
Strongest: Late Winter to Summer (Feb–Jul).
Weakest: Fall harvest months (Sep–Oct) → new supply weighs on prices.
📌 Example: Frost in Brazil (Jul 2021) cut supply → Coffee futures spiked +60%.
📈 Cotton (ICE: CT Futures)
Strongest: Winter & Spring (Nov–May) → Textile demand, planting risk.
Weakest: Summer & Fall (Jun–Oct) → Harvest & oversupply pressures.
📌 Example: Nov 2020–May 2021 rally (+25%) from China demand + U.S. weather risks.
🔹 2. What Moves These Markets Most?
~ Cocoa
Weather in Ivory Coast & Ghana (70% of supply).
Labor disputes, political unrest, crop diseases.
Global chocolate consumption, health trends.
~ Sugar
Ethanol demand (linked to oil prices, Brazil cane allocation).
Government subsidies & tariffs (India, EU).
Brazil’s currency (BRL) & weather.
~ Coffee
Brazil & Vietnam crops (60% of global production).
Frosts, droughts, El Niño.
Consumer demand trends (premium coffee, emerging markets).
~ Cotton
U.S., India, China output (~65% global supply).
China’s stockpiling/import policy.
Substitute fabrics (polyester), energy prices.
Apparel demand cycles.
🔹 3. Trading Strategies & Investment Vehicles
Futures
Cocoa (CC), Sugar (SB), Coffee (KC), Cotton (CT) traded on ICE.
Provide direct, leveraged exposure.
ETFs & ETNs
Cocoa: NIB (iPath Cocoa ETN).
Sugar: CANE (Teucrium Sugar Fund), SGG (iPath Sugar).
Coffee: JO (iPath Coffee ETN).
Cotton: BAL (iPath Cotton ETF).
Stocks with Exposure
Cocoa: Hershey (HSY), Mondelez (MDLZ).
Sugar: Cosan (CZZ), ADM, Bunge (BG).
Coffee: Starbucks (SBUX), Nestlé, JM Smucker (SJM – owns Folgers).
Cotton: Levi’s (LEVI), VF Corp (VFC), Ralph Lauren (RL), Hanesbrands (HBI), Gildan (GIL).
🔹 4. Soft Commodities Yearly Rotation Playbook
Here’s how traders can rotate positions through the year for maximum seasonal edge:
📌 Example Rotation:
Start year in Sugar & Cotton (Jan–Feb).
Shift into Cocoa & Coffee (Jun–Aug).
Rotate back into Sugar & Cotton (Nov–Dec).
📌 Conclusion: The Soft Commodities Super Strategy
Soft commodities offer traders multiple edges:
✅ Seasonality: Cocoa (summer), Sugar (winter), Coffee (spring/summer), Cotton (winter/spring).
✅ Macro Drivers: Weather, politics, energy, government policies.
✅ Cross-Market Links: Oil prices → ethanol (sugar); apparel cycles → cotton; consumer demand → cocoa/coffee.
✅ Portfolio Benefits: Diversification vs. equities & metals.
The best strategy is to rotate across the year:
Long Sugar & Cotton (winter/spring),
Long Cocoa & Coffee (summer),
Rotate out during weak harvest windows.
Softs may be volatile, but for disciplined traders, they provide predictable, repeatable seasonal opportunities with both futures and equities exposure.
The Technical Analysis Superpower (That Isn’t Real)Imagine this: You spot the perfect candlestick pattern. It feels like the market’s secret code just unlocked. You hit buy. An hour later you’re staring at a loss, asking yourself: “What the hell just happened?”
That’s the illusion of control at play. I’ve been there. We all have.
How the illusion shows up:
You believe one pattern guarantees the next move.
You stack indicators thinking more = more control.
You convince yourself you’ve finally “cracked the code.”
The emotional side:
It feels good to play wizard. Technical analysis (TA) gives us tools, but it doesn’t give certainty. The market doesn’t care about your Fibonacci line or your perfect breakout. TA only tilts the odds—not controls them.
So what actually matters?
Keep it simple: 2–3 tools max. Start with trend. When you are following the higher timeframe bias, you are following the trend. The top 5-6% of traders get 90-100% of their profit from a selective bias.
Always ask: “If I’m wrong, where’s my exit? wher's my Stop loss?”
Backtest and track results. Aim for probability, not perfection.
Respect patience. Most fakeouts die fast—wait for confirmation.
Bottom line:
TA is not a superpower. It’s a probability framework. The real edge isn’t in control—it’s in discipline, trend recognition, and managing yourself when the market doesn’t care.
👉 What’s your biggest illusion of control story? Drop it in the comments—I want to hear how TA has tricked you.
— Skeptic

Bitcoin Ready To Moon Or Crash Crowd Mindset DecidesIs now the time to buy, or should we run away?
Why do most traders make the wrong move at the most critical moment?
Bitcoin today is not just an asset, it’s a live psychology test of the entire crowd.
Hello✌️
Spend 2 minutes ⏰ reading this educational material.
🎯 Analytical Insight on Bitcoin:
Bitcoin has convincingly broken above its three-week resistance with strong bullish momentum 📈. Trading volume is exceptionally high, suggesting a continuation toward new highs. The first target indicates a potential 7% gain, while the next major level could reach $124,000 🚀.
Now , let's dive into the educational section,
🧠 Greed The Hidden Enemy of Traders
Greed often begins with a simple thought: “Let’s hold a little longer, maybe it goes higher.” That single idea has wiped out millions of dollars in this market. In bull runs, crypto is designed to trigger this feeling. Green candles in a row, optimistic news, and analysts calling for unrealistic targets all convince traders to keep holding.
😨 Fear The Trigger of Wrong Sells
If greed traps you at the top, fear traps you at the bottom. The moment screens turn red, fear dominates. Panic spreads through news headlines, social posts, and rumors. Your mind wants to escape pain, so you smash the sell button.
🐳 Whales and Their Psychological Games
Whales are the best psychologists in the market. They know how the crowd thinks, fears, and reacts. By injecting sudden buy or sell pressure, they create fake moves that trigger thousands of liquidations.
For example, in futures markets whales often manipulate price just enough to hit stop-loss clusters. Retail traders believe “the market is against me,” but in reality they are against themselves. The whales don’t move price randomly they move it exactly where the crowd’s emotions are most vulnerable.
🔍 Why Technical Analysis Alone Is Not Enough
Indicators are great, but they can’t explain why you panic at support or get greedy at resistance. A trendline won’t tell you why you exit right before a reversal. Technical analysis is only the map; trading requires controlling emotions while driving on that map.
That’s why two traders can look at the same chart and get completely different results: one profits because he manages his psychology, the other loses because he doesn’t.
🚀 Ready for Explosion or Collapse?
Right now Bitcoin stands at a turning point. Macro news, trading volumes, and the Fear and Greed Index all show a sensitive zone. A single spark could push BTC into new highs or deep corrections.
But the real driver won’t be candles or lines it will be the crowd’s reaction to them. If traders once again follow fear and greed blindly, the cycle repeats. If they finally learn to step aside from the crowd, they have a real chance to win.
📊 TradingView Tools and Market Psychology
When it comes to Bitcoin, nothing is more important than understanding crowd sentiment. The Fear and Greed Index is one of the best tools you can integrate into TradingView charts for a bigger picture. When this index shows extreme fear, it means the majority is selling and that’s exactly where big players step in. On the other hand, extreme greed often signals serious danger.
Another useful TradingView feature is the Volume Profile indicator. It shows where most trades occurred and in which zones traders are mentally trapped. When you combine this with the Fear and Greed Index, you get a clear vision of when the crowd is about to face either a massive breakout or a brutal sell-off.
You can also apply Sentiment Indicators and Social Volume Tools directly on TradingView charts to see how emotions reflect in real-time. For example, when social discussion around Bitcoin spikes while price stays flat, the market is quietly preparing for a major move. This makes your analysis more than just price action; it becomes a psychological guide for every trader reading it.
🎯 Conclusion
Bitcoin’s market is not just numbers and charts it’s a battlefield of emotions. With the right tools on TradingView, you can see crowd psychology more clearly and prepare ahead of the masses. The secret to survival is simple: manage your emotions before the market manages them for you.
💡 Five Golden Advices for Survival in This Market
Always define your exit plan before entering a trade, never after.
If everyone is buying with excitement, pause the market usually rewards those who wait.
In moments of extreme fear, don’t rush to sell; check volume and sentiment indicators on TradingView first.
Never risk all your capital on one position; proper risk management is your lifeline.
Treat your emotions as an indicator; if you feel extreme fear or excitement, that’s your signal to wait, not to act.
✨ Need a little love!
We pour love into every post your support keeps us inspired! 💛 Don’t be shy, we’d love to hear from you on comments. Big thanks, Mad Whale 🐋
📜Please make sure to do your own research before investing, and review the disclaimer provided at the end of each post.

Explanation of the Basic Trading Strategy
Hello, fellow traders!
Follow me to get the latest information quickly.
Have a great day.
-------------------------------------
To understand the charts, the basic trading strategy is the concept used.
Let's look at an example.
---------------------------------------------------------
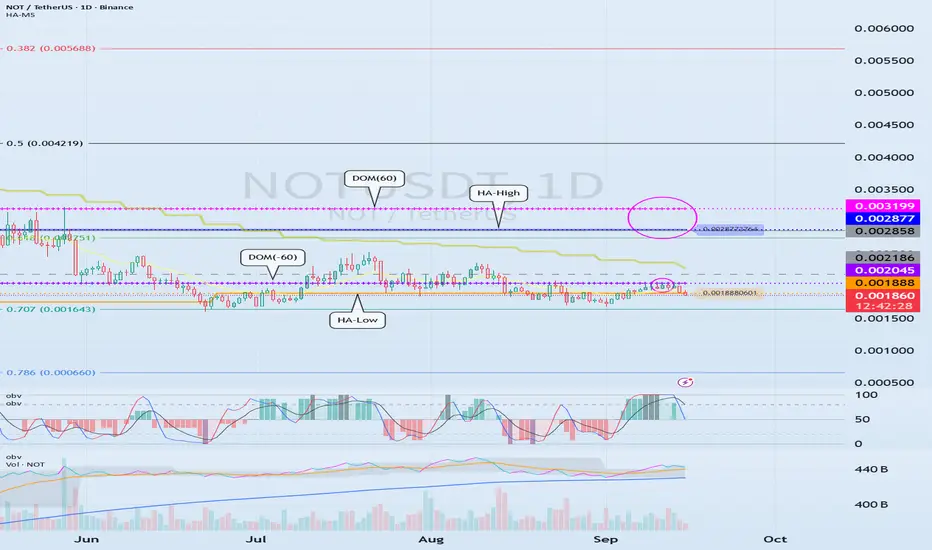
The OBV indicator, which follows the Low Line ~ High Line channel, has shown an upward trend as it has broken above EMA 1 and EMA 2.
Afterwards, the DOM(60) and HA-High indicators were formed, ultimately returning the price to its original position.
Since the HA-Low indicator is forming at 0.001888, we need to examine whether it can find support and rise around this level.
In other words, a buy signal is in the 0.001888-0.002045 range, where support is found and the price rises.
Since the HA-Low and HA-High indicators have converged, a sharp rise is expected if the sideways movement ends and the price rises above 0.002877-0.003199.
-
The basic trading strategy is based on the HA-Low and HA-High indicators, indicators developed for trading on Heikin-Ashi charts.
The basic trading strategy is to buy in the DOM(-60) to HA-Low range and sell in the HA-High to DOM(60) range.
However, if the price rises from the HA-High to DOM(60) range, a step-like upward trend is likely, while if it falls from the DOM(-60) to HA-Low range, a step-like downward trend is likely.
Therefore, the basic trading strategy should be a segmented trading approach.
Therefore, rather than predicting trends based on the movements of one or two indicators, you should prioritize developing a basic trading strategy.
-
If the HA-Low indicator touches and rises to meet the HA-High indicator, the wave should be considered closed.
Furthermore, if the HA-High indicator touches and falls to meet the HA-Low indicator, the wave should also be considered closed.
Remember that the closing of these waves serves as a benchmark for creating new trading strategies.
Previous waves should be forgotten and new trading strategies developed.
-
Thank you for reading to the end.
I wish you successful trading.
--------------------------------------------------
Long TLT/SPY📌 Bonds Explained: What They Are, How They Work & Key Risks
Bonds are one of the oldest and most important financial instruments in global markets. They are used by governments, corporations, and institutions to raise money, and by investors to earn income, diversify portfolios, and manage risk.
At their core, a bond is a loan:
The issuer (borrower) raises capital by selling bonds.
The investor (lender) provides money in exchange for periodic interest payments (coupon payments) and the return of the principal (face value) at maturity.
🔹 1. What is a Bond?
When you buy a bond, you are lending money to the issuer. The issuer promises:
Interest payments (usually fixed) on a regular schedule (semiannual or annual).
Repayment of principal (the original investment amount) when the bond matures.
📌 Example:
You invest $1,000,000 in a 10-year bond paying 3% annually (semiannual coupons).
Every 6 months, you receive $15,000 in interest payments.
At the end of 10 years, you (hopefully) receive back your original $1,000,000 principal.
🔹 2. Why Do Companies and Governments Issue Bonds?
Governments → Fund infrastructure, social programs, defense, or refinance existing debt.
Corporations → Finance expansion, research, acquisitions, or refinance loans.
Municipalities → Build schools, hospitals, and roads.
Bonds allow issuers to access large pools of capital without giving up ownership (like stocks).
🔹 3. Why Do Investors Buy Bonds?
Stable Income: Regular coupon payments.
Capital Preservation: Return of principal at maturity (assuming no default).
Diversification: Bonds often behave differently from stocks, balancing risk.
Hedging Inflation/Interest Rates: Certain bonds (like TIPS) protect against inflation.
Relative Safety: High-quality government bonds are considered safe-haven assets.
🔹 4. Key Types of Bonds
Government Bonds
Issued by sovereign states.
Example: U.S. Treasuries, UK Gilts, German Bunds.
Generally low risk, lower yields.
Corporate Bonds
Issued by companies.
Higher yields than government bonds but higher risk.
Municipal Bonds
Issued by local governments or agencies.
Often come with tax benefits for investors.
High-Yield (Junk) Bonds
Issued by lower-credit issuers.
Higher potential returns, but much riskier.
Inflation-Protected Bonds
Coupon/principal linked to inflation.
Example: U.S. TIPS (Treasury Inflation-Protected Securities).
🔹 5. Three Main Risks of Investing in Bonds
Even though bonds are often seen as “safe,” they carry risks that investors must understand:
1️⃣ Credit Risk (Default Risk)
The issuer may fail to pay coupons or repay the principal.
Higher with corporate bonds and emerging market government bonds.
Mitigated by credit ratings (Moody’s, S&P, Fitch).
📌 Example:
If a company defaults, you may lose part or all of your investment.
2️⃣ Interest Rate Risk
Bond prices move inversely to interest rates.
If rates rise, existing bond prices fall (since new bonds offer better yields).
If you sell before maturity, you could face a loss.
📌 Example:
You bought a 10-year bond at 3%. A year later, rates rise to 5%. Your bond’s market value falls, because investors prefer newer bonds paying higher coupons.
3️⃣ Inflation Risk (Purchasing Power Risk)
Even if you hold the bond to maturity, rising inflation erodes the real value of your returns.
A 3% coupon loses attractiveness if inflation rises to 6%.
📌 Example:
Your bond pays $30,000 annually, but inflation pushes up costs by $40,000 per year → you are effectively losing purchasing power.
🔹 6. Bonds vs. Stocks
Bonds: Debt, fixed income, contractual obligation, lower risk, limited upside.
Stocks: Equity ownership, dividends (optional), higher risk, unlimited upside.
In a company bankruptcy, bondholders are paid before shareholders.
🔹 7. How Investors Use Bonds in Portfolios
Income generation: Retirees and pension funds rely on coupon payments.
Diversification: Bonds often rise when stocks fall, reducing portfolio volatility.
Risk management: Safe-haven bonds (like Treasuries) act as “insurance” during crises.
Speculation: Traders can bet on interest rate moves via bond futures and ETFs.
🔹 8. Bonds vs. Stocks: The TLT–SPY Correlation
One of the most widely followed relationships in global markets is the correlation between:
TLT → iShares 20+ Year Treasury Bond ETF (tracks long-dated U.S. Treasury bonds).
SPY → SPDR S&P 500 ETF (tracks U.S. equities).
📈 Historical Relationship
Over the past two decades, TLT and SPY have often moved in opposite directions. (The Correlation between SPY/TLT often hovers around 0.)
Why? When stocks sell off, investors typically seek safety in Treasuries, pushing bond prices up (yields down).
This negative correlation makes bonds a powerful diversifier in equity-heavy portfolios (60/40).
📌 Example:
2008 Financial Crisis → SPY plunged ~37%, while long-dated Treasuries (TLT) surged as investors fled to safety.
March 2020 COVID Crash → SPY fell ~34% peak-to-trough, TLT spiked ~20% as the Fed cut rates and investors piled into Treasuries.
🐂 Strategy #1 (MA):
Buy SPY when TLT crosses below the 95 MA.
Sell SPY when TLT crosses above the 95 MA.
🔄 But the Correlation Can Shift
In inflationary environments, bonds and stocks can fall together.
2022 is a perfect example:
Inflation spiked → Fed hiked rates aggressively.
TLT dropped ~30% (yields surged).
SPY also fell ~19%.
Both asset classes sold off simultaneously, breaking the hedge.
🐂 Strategy #2 (Re-Balancing):
Buy TLT at the close of the seventh last trading day of the month.
Sell TLT at the close of the last trading day of the month.
Sell TLT short at the close of the month.
Cover TLT at the close of the seventh trading day of the month.
Higher Returns after rate hikes.
📊 Why This Matters for Investors
In normal times: TLT acts as a counterweight to SPY, smoothing portfolio volatility.
In inflationary shocks: Both can decline, reducing diversification benefits.
Lesson: Don’t assume bonds will always hedge equities — context (inflation, Fed policy, growth cycles) matters.
📌 Practical Uses of the TLT–SPY Correlation
Portfolio Diversification
A 60/40 portfolio (60% stocks, 40% bonds) relies on the negative correlation.
Works best when inflation is low and stable.
Risk-On / Risk-Off Gauge
If both SPY and TLT rise → markets are calm, liquidity flows into both risk and safety.
If SPY falls while TLT rises → classic risk-off move (flight to safety).
If both fall → inflation or policy tightening environment (no safe haven).
Trading Signals
Divergence trades: When SPY rallies but TLT also rallies strongly, it may signal equity rally exhaustion (risk-off brewing).
Macro hedge: Long TLT positions can offset downside risk in SPY-heavy portfolios — but only in disinflationary or deflationary shocks.
🔹 9. EWJ–TLT Correlation: Japan Equities vs. U.S. Treasuries
EWJ → Tracks Japanese equities (large & mid-cap companies).
TLT → Tracks U.S. long-dated Treasuries.
Unlike the classic SPY–TLT inverse correlation, the EWJ–TLT relationship is more complex, shaped by:
Global risk sentiment (risk-on/risk-off flows).
Currency effects (USD/JPY exchange rate).
Japan’s ultra-low interest rate environment (BoJ policy).
📈 Historical Tendencies
1️⃣ Risk-Off Periods (Global crises → flight to safety):
TLT rallies (U.S. Treasuries bid).
EWJ often falls, as Japanese equities are highly cyclical and export-driven.
Negative correlation dominates.
📌 Example:
2008 Crisis → TLT surged; EWJ plunged with global equities.
2020 COVID Crash → Same pattern: safety flows to Treasuries, Japanese stocks sold.
2️⃣ Risk-On Periods (Liquidity, global growth optimism):
EWJ rallies with global equities.
TLT may drift lower (yields rising on stronger growth).
Correlation weak to moderately negative.
📌 Example:
2016–2018: Global growth rebound → EWJ rose, TLT fell as U.S. yields climbed.
3️⃣ Currency Channel (USD/JPY)
Japanese equities (EWJ) are sensitive to the yen.
A stronger USD/JPY (weaker yen) boosts exporters (good for EWJ).
TLT rallies often coincide with USD weakness (yields down, dollar down), which can hurt Japanese exporters, adding another layer of inverse correlation.
🔄 Shifts Over Time
Long-term average correlation: Mildly negative (similar to SPY–TLT, but weaker).
During inflation shocks (2022): Correlation turned positive at times:
TLT fell as U.S. yields spiked.
EWJ also struggled due to global tightening & yen weakness.
Both moved down together, breaking the hedge.
📊 Why EWJ–TLT Matters
Global Diversification Check: Investors often think Japanese equities diversify U.S. equities, but they can be just as cyclical. Adding TLT creates the real hedge.
Risk-Off Signal: When both EWJ and TLT rise, it may indicate global liquidity easing (rare but bullish).
Currency Overlay: Always factor USD/JPY → sometimes EWJ’s move is more about currency than equities.
🐂 Strategy #3 (EWJ):
When Japanese stocks are above their 150-day moving average, go long TLT (US long-term Treasury). When the average is below the 150-day average, stay out. The correlation between TLT and EWJ can serve as a breath signal.
📌 Conclusion: Bonds as the Foundation of Finance
Bonds are the backbone of the global financial system, connecting borrowers (governments, corporations) with lenders (investors).
✅ Bonds provide regular income and capital preservation.
✅ They carry risks: credit, interest rate, and inflation.
✅ They are essential for diversification and risk management.
✅The TLT–SPY correlation is dynamic. Historically negative, providing diversification. In inflationary shocks (like 2022), the correlation turns positive, breaking the hedge.
✅ EWJ–TLT is a Global Macro Hedge, But Fragile. Usually inverse: Risk-off = TLT up, EWJ down. Sometimes aligned: Inflation shocks or synchronized global tightening → both down. Currency filter essential: USD/JPY often mediates the relationship. This makes EWJ–TLT correlation a powerful barometer of global macro regimes: Disinflationary slowdowns → Strong hedge. Inflationary crises → Hedge breaks.
For investors, understanding bonds is crucial, even if you primarily trade equities or commodities, because bond yields influence everything: stock valuations, mortgage rates, and even currency markets.

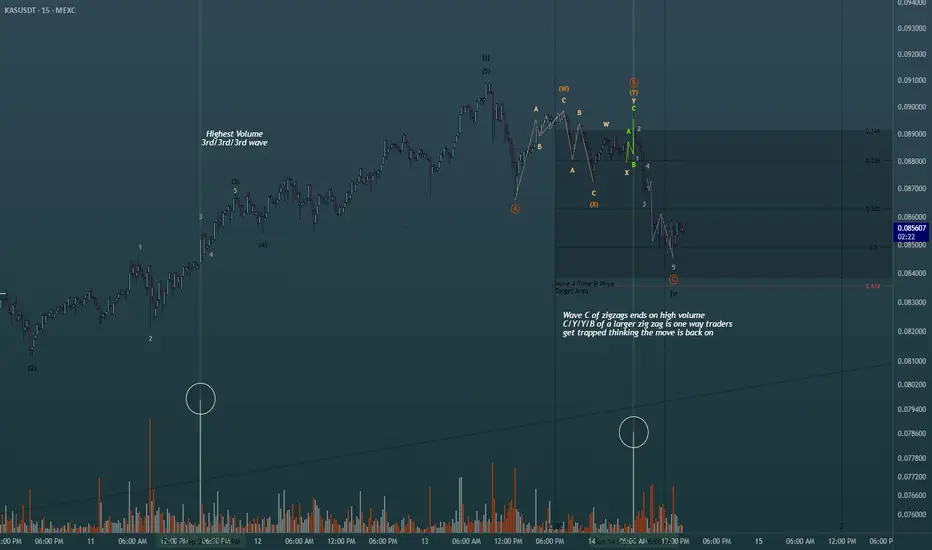
Using simple volume for added confluence in Elliott Wave Theory!Shown on the chart is 2 of the ways you can use the highest volume spikes on the chart to find out where you are in the wave count. Easiest way is to find the highest volume with the steepest slope of trend to label as your third wave. Same concept whether its bearish bars printing or bullish bars. The highest volume shown is actually part of the retracement, albeit in one of the actionary waves (moving with trend), alot of buying happened at the termination of the wave C of the zig zag shown in green. Perfect scenario to rake in buy orders from retail then dump on them to finish out the WXY pattern. This is just 2 of the many scenarios in which you can find help from the volume oscillator to give you a directional bias in Elliott Waves. Happy Trading
The Impact of News on Price: Should You React?"
In trading, news has always been a powerful factor capable of moving markets by double digits within hours. A single headline in the financial media or a tweet from a politician can send an asset soaring or crashing, wiping out stop-losses and creating waves of panic. Many traders have faced moments when a sudden “breaking story” ruined carefully built plans: technical analysis showed a steady trend, but a flood of headlines turned the market in the opposite direction. Naturally, the question arises: should we react to news immediately, or is it better to stay calm?
Most traders make their biggest mistakes during such moments. The temptation appears to jump straight into a position or close one in fear. Emotions take over: fear of missing out and greed for quick profits. The problem is, these decisions rarely come from a system. More often, they turn trading into gambling, where outcomes depend on luck instead of analysis.
The truth is, news itself doesn’t always have a straightforward impact on the market. What matters more is how participants react. The same piece of information can trigger a rally or a sell-off depending on how major players interpret it. Blindly following the headlines rarely leads to consistent results.
A more effective approach is to treat news as background, not as a direct call to action. At the core of successful trading lies discipline and an understanding of levels, not headlines. If the price is approaching a pre-marked zone, that zone—not a comment on a news feed—defines the scenario. This way, the trader avoids guessing crowd reactions and focuses on what is objectively visible on the chart.
Consider two scenarios. In the first, a trader sees news that a large fund has purchased crypto and instantly opens a long. In the second, the same trader reads the same news but acts only after confirming the move technically, at pre-defined levels. The difference is striking: the first approach is emotional, the second is structured. And it’s the latter that reduces chaotic mistakes.
To trade this way, it’s not enough to simply recognize levels—you need a system to control them. That’s where structured analysis comes in: viewing price step by step, turning trading into a managed process. With this approach, profit targets, risk zones, and scenarios are mapped out in advance. Strong news flow becomes a side factor, not the core driver of decisions.
Experienced traders know that news will always shake markets. Instead of chasing every headline, it’s more effective to build trades that can withstand volatility. What helps here is having a process that removes emotions and focuses on numbers. Automation of analysis and clear visualization of key levels transform trading from chaotic reactions into a disciplined plan.
So, should you react to news? The answer is: yes, but not directly. React through your system. If the news aligns with the technical picture, it can add conviction. If it contradicts it, the priority remains with structure, not emotion. This is what allows you to operate calmly, without panic or euphoria.
Markets will never stop being unpredictable, and news is just one facet of that uncertainty. But discipline, technical analysis, and structured control can turn even the noisiest events into a manageable process. In the end, it’s not the headlines that matter most, but your ability to stay focused and consistent. And this is exactly where tools that automate the process, reduce chaos, and keep logic at the center become indispensable."
Gan strategy’s In dow jones has return after determining and calculating it’s considered my angle is 90 dgree and for time angle i calculated 90 candle though. Its in square shape and maybe it completes all major angles which is 360 last one
The smal rectangle consider price / time
And the trend line is my bias which golden one is major road and red is for selling and green is for buying.
Les see

stacey burkes tradingstacey burkes trading This is how you can trade the week using a fibonoci technique. the system is easy once you do the same process daily and countinue to see the trades. You got this!!

On-Chain Analysis: Understanding the Real Behaviour of BTC & ETHHello everyone, trading crypto isn’t just about looking at charts. To stay ahead, you need to understand the actual behaviour of holders, large capital flows, and buying/selling pressure – and that’s the power of on-chain analysis.
1️⃣ MVRV – Profits Reveal Market Sentiment
MVRV = Market Value / Realized Value. Simply put, it shows the average profit/loss of holders.
High MVRV → many holders are in profit → risk of selling increases.
Low MVRV → many holders are at a loss → the market is more likely to bounce.
Practical example: BTC dropping to a low MVRV zone during a long-term uptrend is often a good entry, because weaker holders are less likely to sell and price can rebound.
2️⃣ NUPL – Market Psychology in a Single Number
NUPL = Net Unrealized Profit/Loss, measuring total unrealized gains or losses of holders.
NUPL > 0.6 → market is greedy, pullbacks likely.
NUPL < 0 → market is fearful, cheap buying opportunities emerge.
Combining NUPL with price action and volume helps you choose buying/selling moments wisely and avoid FOMO.
3️⃣ Whale Activity – Tracking Big Players
Monitor large wallets (usually ≥1,000 BTC/ETH).
Moving coins to exchanges → potential selling → price under downward pressure.
Moving coins to private wallets → supply decreases → price may rise.
Watching whale activity ahead of major moves helps spot real trends, which ordinary charts might not reveal.
4️⃣ Exchange Inflow/Outflow – Let the Money Speak
Large inflow → more BTC/ETH on exchanges → higher selling pressure, price drops.
Large outflow → coins withdrawn → supply tightens, price tends to rise.
Combine this with trend, breakout points, and crypto news to confirm upcoming moves.
5️⃣ Application Tips
No single on-chain metric is a guaranteed signal. The strength lies in combining them: MVRV + NUPL + whale activity + inflow/outflow + price action + volume.
Example: BTC enters a low MVRV zone, NUPL < 0, whales withdraw → potential buying zone, confirmed by H4/D1 chart breakout.
Wishing you all successful trading and profitable sessions!

Using imbalanced candle ranges will change your analysis foreverIn this video you will learn how imbalanced candle ranges affect price. When an imbalanced range prints, mark them out and start observing how they affect price 💎

Best Lot Size for Gold Trading (XAUUSD) Explained
If you trade Gold with fix lot, I prepared for you a simple manual how to calculate the best lot size for your XAUUSD trading account.
Step 1
Find at least the last 10 trades that you took on Gold.
Step 2
Measure stop losses of all these trades in pips
Step 3
Find the trade with the biggest stop loss
In our example, the biggest stop loss is 680 pips
Step 4
Open position size calculator for XAUUSD
Step 5
Input your account size, 1,5% as the risk ratio.
In "stop loss in pips" field, write down the pip value of your biggest stop loss - 680 pips in our example.
Press, calculate.
For our example, the best lot size for Gold will be 0.22.
The idea is that your maximum loss should not exceed 1,5% of your account balance, while the average loss will be around 1%.
❤️Please, support my work with like, thank you!❤️
I am part of Trade Nation's Influencer program and receive a monthly fee for using their TradingView charts in my analysis.

Revealing The Secrets Of Pro Traders👋Hello everyone, if you’re just starting out with trading, this post is for you.
Trading can be exciting, but if you’re not careful, you’ll quickly become prey. Here are 5 common mistakes beginners often make:
1. Opening Too Many Positions At Once
When I first started, I thought using high leverage would help me make money quickly. But opening multiple trades at once can wipe out your account after just a small market reversal.
Example: A trader uses high leverage to buy XAUUSD, but when the price drops 10%, his account gets completely “burned.”
Solution: Always assess your personal conditions, calculate the profit you expect, how much loss you can handle, and set clear goals. I actually have a formula for this — if you’d like to know, just leave me a comment below.
2. Chasing Losses… And Losing Even More
It’s that feeling of desperation, right? You take a big loss on your first trades, then try to win it all back in the next ones, doubling down again and again… only to lose more.
I know the feeling of wanting to recover your money right away. But trying to chase losses by overtrading only makes things worse. Stop when you realize you’re acting out of emotion. Sometimes it’s better to accept a small loss and wait for a better opportunity, rather than risk blowing your account completely. That’s a hard lesson I learned from multiple wipeouts.
3. Ignoring Risk Management
Tell me you’re not guilty of this one. Many beginners think stop-losses or take-profits aren’t necessary because they believe they’ll “get lucky.” But skipping risk management is exactly why accounts get wiped out.
Example: A trader ignores stop-loss, and then unexpected news hits the market. The price reverses instantly, and the account vanishes “in a heartbeat.”
That’s why I always remind my students: set TP and SL on every trade and keep a close eye on important market news.
4. FOMO – The Fear of Missing Out
This is one of the feelings almost all of us experience when trading. Forget being an expert for a moment—when you’re new and see prices skyrocketing, with everyone around you buying, it feels like if you don’t jump in right now, you’ll miss your chance. But this impatience often leads to poor decisions. You end up buying without proper market analysis, and when losses come, you don’t even understand why—it’s simply because you were chasing the crowd.
5. The Biggest Factor – Lack of Knowledge
This one overshadows all the other mistakes. Many beginners rely only on tips from others or “tricks” without understanding indicators, technical analysis, or trading strategies. Maybe you’ve thought: “I just need to follow what others do, the market will be fine.” But in the long run, if you don’t fully understand your actions, you can’t control risk and the market will eventually knock you down. At that point, you’ll be left either begging for help or starting from scratch with your learning—too late.
In summary, success in trading comes down to three essentials:
Managing emotions
Managing risk
Continuously building knowledge and practicing consistently
In the coming posts, I’ll share more valuable lessons to help you overcome these challenges. You can study them, practice in a demo account, and then apply them to real trading when you’re ready. It will be incredibly useful.
If today’s lesson resonated with you and you’re excited for the next posts, hit the like button🚀—I’d love your support.
Good luck!

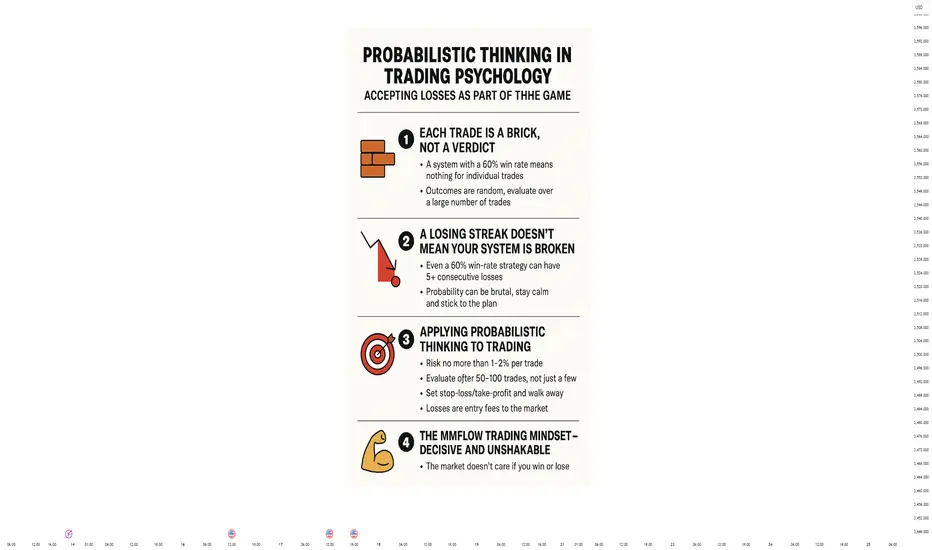
Think in Probabilities, Trade Like a Champion⚡ Probabilistic Thinking in Trading Psychology: Accepting Losses as Part of the Game
Trading psychology separates successful traders from those the market eliminates. In Forex and Gold trading, many lose not because their strategy is weak but because they fail to accept the reality of probability. Every trade is just one sample in a long statistical series—nothing more, nothing less.
🧠 1. Each Trade Is a Brick, Not a Verdict
A system with a 60% win rate sounds impressive. But that percentage only matters over a large number of trades. For individual trades, the outcome is random.
Example: An MMFLOW trader places 100 trades, risking 1% per position. After losing 6 in a row, he remains calm: “These are just 6 steps in a 1,000-step journey.”
During NFP news, Gold drops 300 pips. An inexperienced trader abandons their plan after two stop-loss hits. A professional sticks to the system because probability needs time to show its edge.
📊 2. A Losing Streak Doesn’t Mean Your System Is Broken
Even a 60% win-rate strategy can experience 5–7 consecutive losses. That’s the ruthless yet fair nature of probability. Traders without probabilistic thinking panic, break discipline, or abandon their edge prematurely.
Example: A breakout system shows long-term profitability. After 10 trades, it loses 7 times. A weak-minded trader quits. A seasoned trader stays the course and wins 20 out of the next 30 trades—recovering all losses and more.
🚀 3. Applying Probabilistic Thinking to Forex/Gold Trading
Rock-solid risk management: Risk no more than 1–2% per trade to survive losing streaks.
Long-term evaluation: Judge your system after 50–100 trades, not just a handful.
Non-negotiable discipline: Set stop-loss/take-profit and walk away—emotions don’t press “Close.”
Trading journal: Record outcomes and emotions to identify cognitive biases.
Warrior mindset: Losses are entry fees to the market, not personal failures.
💪 4. The MMFLOW Trading Mindset – Decisive and Unshakable
The market doesn’t care whether you win or lose. The only thing that matters is keeping your statistical edge long enough to let it work. Professionals:
Stay calm through losing streaks.
Refuse to “revenge trade” when emotions flare.
Stick to the plan because 500 trades will speak louder than 5.
📈 5. Conclusion – Mastering Trading Psychology
In Forex and Gold, probabilistic thinking is the shield that protects your mindset. Accepting losses as part of the game helps you:
Reduce emotional pressure and avoid impulsive decisions.
Maintain discipline and effective risk management.
Leverage your system’s long-term edge for sustainable account growth.
Sniper Entries Made Simple: The Power of Confirmation“Smart traders don’t predict.
They wait for the market to confirm their idea — then act.”
Finding a mitigation zone is only half the job.
Confirmation is what separates professional patience from random guessing.
It’s the step that keeps you from catching a falling knife or buying too soon.
Why Confirmation Matters
Jumping in blindly at the zone can work sometimes — but most of the time, it’s a gamble.
Confirmation gives you:
Higher probability setups (not every zone holds)
Tighter entries (better RR)
Fewer unnecessary stop-outs
The Confirmation Playbook
Here’s a simple process you can use.
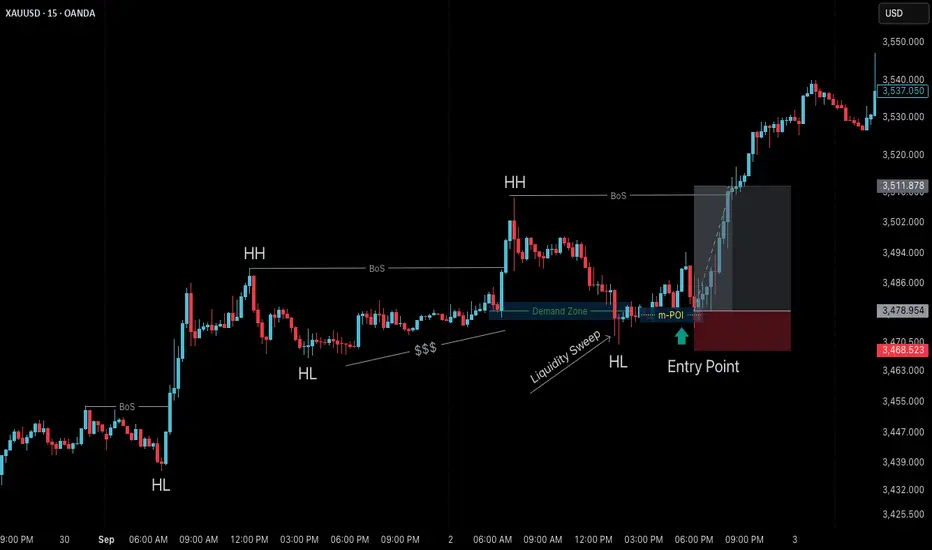
Refer to the Gold M15 Bullish Chart (Sep 2, 2025) above — it shows this process step by step.
Step 1: Mark the Zone
Identify your mitigation block or demand zone after a BoS.
Step 2: Wait for Price to Tap
Be patient — let price react at this zone.
Step 3: Look for a Sweep
Notice how price often sweeps liquidity below the zone first — this fuels the reversal.
Step 4: Drop to Lower Timeframe (M1 or M5)
Watch for micro-structure shift in your favor:
micro-ChoCH
micro-BoS
Strong rejection wicks or engulfing candles
Step 5: Enter with Tight Risk
Take the trade after confirmation and set SL just beyond the sweep.
This gives you a small stop with a high RR potential.
Live Example (Gold)
In the XAUUSD bullish M15 chart above, you can see:
BoS creates a demand zone
Price returns and sweeps liquidity below demand zone
On lower timeframe, we get micro-ChoCH → micro-BoS confirmation
Entry is taken at micro-POI with tight SL, catching the next impulsive leg
Notice how confirmation turned a risky breakout buy into a sniper entry with a clean risk-reward profile.
📘 Shared by @ChartIsMirror
Do you already use confirmation techniques like ChoCH + BoS, or do you prefer instant entries at zones?
Share your experience in the comments — what’s your go-to trigger?
Why Forex Reserves Matter in Trading1. What Are Forex Reserves?
Forex reserves are assets held by a nation’s central bank in foreign currencies, precious metals like gold, Special Drawing Rights (SDRs) from the International Monetary Fund (IMF), and other reserve assets. These reserves are not just passive holdings; they are active instruments used for monetary policy, currency stabilization, and ensuring global payment obligations.
Key Components of Forex Reserves
Foreign Currencies – Typically held in USD, EUR, JPY, GBP, and increasingly CNY.
Gold Holdings – A traditional hedge against inflation and currency risk.
SDRs (Special Drawing Rights) – An IMF-backed reserve asset that supplements official reserves.
IMF Reserve Position – Access to IMF funding if needed.
2. Why Countries Accumulate Forex Reserves
Stability in Currency Markets
Countries need reserves to intervene in forex markets to prevent excessive volatility in their domestic currency.
Confidence for International Trade
Exporters and importers prefer dealing with countries that can guarantee payment stability.
Debt Servicing
Reserves allow governments to service foreign debt obligations without defaulting.
Buffer Against Economic Shocks
Acts as insurance against sudden capital flight, trade imbalances, or geopolitical crises.
Support for Sovereign Credit Ratings
Higher reserves improve investor confidence and reduce borrowing costs.
3. Importance of Forex Reserves in Global Trading
3.1 Stabilizing Currency Values
A currency’s exchange rate plays a central role in trade competitiveness. For example, if the Indian Rupee depreciates too rapidly, imports like oil and electronics become expensive. The Reserve Bank of India (RBI) can sell USD from its reserves to supply dollars in the forex market, stabilizing the rupee.
3.2 Controlling Inflation
Imported inflation is a major risk for countries dependent on foreign goods. By using reserves to maintain a stable currency, central banks reduce inflationary pressures, which directly impacts stock and bond markets.
3.3 Investor Confidence
High reserves attract foreign institutional investors (FIIs) because they see lower risk of capital restrictions. Conversely, low reserves signal vulnerability, causing capital flight.
3.4 Crisis Management
During the 1997 Asian Financial Crisis, countries with low reserves like Thailand suffered massive currency collapses, while nations with higher reserves recovered faster.
4. How Forex Reserves Impact Trading Across Markets
4.1 Currency Trading (Forex Markets)
Traders closely monitor reserve levels to predict central bank interventions.
A rise in reserves indicates strong capital inflows or trade surpluses, usually strengthening the currency.
A fall in reserves may mean heavy intervention to defend the domestic currency, creating volatility.
4.2 Equity Markets
Strong reserves signal economic resilience, attracting long-term investments.
For export-driven companies, reserve usage can stabilize currency swings, reducing earnings risk.
4.3 Bond Markets
Nations with healthy reserves are seen as safer borrowers.
Sovereign bond yields fall when reserves are high, lowering borrowing costs.
4.4 Commodity Trading
Forex reserves influence global demand for commodities. For example, when China builds reserves, it often buys U.S. Treasuries and commodities, boosting global demand.
Gold prices also respond directly to central bank reserve diversification strategies.
5. Case Studies: Forex Reserves and Trading Dynamics
5.1 China
Holds the world’s largest reserves (over $3 trillion).
Uses reserves to keep the yuan stable, ensuring export competitiveness.
Global traders watch China’s reserve reports to gauge trade and commodity flows.
5.2 India
As of 2025, India’s reserves are above $650 billion.
Provides a cushion against oil import costs and FII outflows.
Traders interpret rising Indian reserves as bullish for the rupee and equity markets.
5.3 Russia (Post-Sanctions)
Sanctions froze Russia’s dollar reserves in 2022.
Moscow shifted to gold and yuan, changing global reserve composition.
Traders saw sharp volatility in ruble trading due to limited access to USD reserves.
6. Forex Reserves as a Trading Indicator
For traders, reserves serve as a leading indicator of currency and capital flow trends.
Rising Reserves: Suggests export growth, capital inflows, and stable currency → bullish sentiment.
Falling Reserves: Signals interventions, capital flight, or trade deficits → bearish sentiment.
Traders often combine reserve data with:
Balance of Payments (BoP) reports
Capital account movements
Central bank policy signals
7. Risks of Over-Reliance on Reserves
While reserves are critical, there are risks:
Opportunity Cost – Funds invested in low-yield assets like U.S. Treasuries could have been used domestically.
Geopolitical Risk – Sanctions can freeze reserves held abroad.
Currency Depreciation of Reserve Assets – Holding too many USD assets can hurt if the dollar weakens.
False Security – Excessive reliance may delay structural economic reforms.
8. Future of Forex Reserves in Global Trading
Shift Toward Gold & Yuan – Central banks are diversifying away from the USD.
Digital Reserves (CBDCs) – Future reserves may include digital currencies issued by central banks.
Geopolitical Weaponization of Reserves – The Russia-Ukraine war highlighted how reserves can be frozen, making diversification essential.
AI and Data-Driven Reserve Management – Advanced analytics will improve reserve allocation strategies.
9. Lessons for Traders and Investors
Currency traders should track reserve levels as part of fundamental analysis.
Equity investors should see reserves as a buffer against volatility.
Bond traders should link reserves with sovereign credit risk.
Commodity traders should monitor how reserve diversification affects gold and oil demand.
Conclusion
Forex reserves are not just a financial cushion for governments; they are a critical trading signal that reflects a country’s economic health, ability to withstand crises, and global credibility. From stabilizing exchange rates to influencing global capital flows, reserves touch every corner of financial markets.
For traders, understanding the dynamics of reserves means being able to anticipate currency movements, equity flows, bond yields, and commodity prices with greater accuracy. In a world of heightened volatility, forex reserves remain one of the most powerful forces shaping international trade and financial stability.
Floating vs. Pegged Exchange Rates in the Global MarketUnderstanding Exchange Rate Systems
1. Floating Exchange Rate
A floating exchange rate (also called a flexible exchange rate) is determined primarily by the free interaction of demand and supply in the forex market. Governments and central banks may intervene occasionally to smooth out volatility, but fundamentally, market forces dictate the price.
For example:
If global investors demand more U.S. dollars for trade or investment, the dollar appreciates.
If demand weakens, the dollar depreciates.
Countries like the United States, Japan, the Eurozone, Canada, and the UK operate under floating exchange rate regimes.
2. Pegged Exchange Rate
A pegged or fixed exchange rate system involves a government or central bank fixing its currency’s value relative to another “anchor” currency, often the U.S. dollar or the euro. This peg is maintained through direct intervention in forex markets or monetary policy adjustments.
For instance:
Hong Kong pegs the Hong Kong dollar to the U.S. dollar at a fixed rate of around 7.8 HKD/USD.
Saudi Arabia pegs the riyal to the dollar, ensuring stability for its oil exports priced in USD.
Pegged systems can be hard pegs (currency board arrangements or dollarization) or soft pegs (adjustable or crawling pegs).
Historical Context
The Gold Standard (1870s–1914)
Currencies were pegged to gold at a fixed rate. This ensured global stability but limited monetary flexibility.
Bretton Woods System (1944–1971)
After WWII, countries pegged their currencies to the U.S. dollar, which itself was convertible into gold at $35/ounce. The system collapsed in 1971 when the U.S. suspended dollar-gold convertibility, paving the way for floating exchange rates.
Post-1970s Era
Most advanced economies adopted floating exchange rates, while developing countries often retained pegged systems to ensure stability.
Mechanisms of Floating vs. Pegged
Floating Exchange Rate Mechanism
Market Driven: Currency value fluctuates daily based on demand/supply.
Determinants: Trade balance, interest rate differentials, inflation, speculation, capital flows.
Volatility: High sensitivity to market news, geopolitical events, and investor sentiment.
Pegged Exchange Rate Mechanism
Official Fix: Government declares a fixed parity with another currency.
Central Bank Role: Uses reserves of foreign currency to buy/sell its own currency to defend the peg.
Policy Trade-off: Sacrifices independent monetary policy for stability.
Advantages & Disadvantages
Floating Exchange Rates
Advantages:
Automatic Adjustment – Trade imbalances are corrected naturally. A deficit leads to currency depreciation, making exports cheaper and imports costlier, restoring balance.
Monetary Independence – Central banks can use interest rates for domestic goals (inflation, growth).
Shock Absorption – Floating currencies can absorb external shocks like oil price fluctuations.
No Need for Reserves – Less dependence on large forex reserves.
Disadvantages:
Volatility – Exchange rates can swing dramatically, hurting exporters/importers.
Speculative Attacks – Vulnerable to speculative flows and sudden capital flight.
Imported Inflation – A weaker currency raises import costs.
Uncertainty in Trade – Businesses face risks in cross-border contracts.
Pegged Exchange Rates
Advantages:
Stability – Predictable exchange rates encourage trade, investment, and confidence.
Inflation Control – Pegging to a stable currency (like the USD) can anchor inflation expectations.
Investor Confidence – Reduces currency risk, attracting foreign capital.
Economic Integration – Helps small, open economies integrate into global markets.
Disadvantages:
Loss of Monetary Policy Independence – Central banks cannot freely adjust interest rates.
Risk of Currency Crisis – Maintaining a peg under speculative attack can deplete reserves (e.g., Asian Financial Crisis, 1997).
Distorted Trade Balances – Pegs can create artificial competitiveness or overvaluation.
Cost of Reserves – Countries must hold massive forex reserves to defend the peg.
Global Case Studies
Floating Exchange Rate Examples
United States (USD) – The dollar floats freely, driven by capital flows, interest rate policies of the Federal Reserve, and global demand for safe assets. Despite volatility, it remains the world’s reserve currency.
Eurozone (EUR) – The euro floats against global currencies. The European Central Bank targets inflation, not exchange rate levels, showcasing independence.
Japan (JPY) – Historically intervened to weaken the yen to support exporters but maintains a floating regime.
Pegged Exchange Rate Examples
Hong Kong Dollar (HKD) – Pegged to USD since 1983 at ~7.8. The currency board system ensures credibility but ties Hong Kong’s interest rates to U.S. policy.
Saudi Riyal (SAR) – Pegged to USD to stabilize oil trade revenues. Provides certainty but makes the economy vulnerable to U.S. monetary policy shifts.
China (CNY) – Historically pegged to USD, now operates a managed float. The People’s Bank of China intervenes to guide the yuan’s value, balancing trade competitiveness and stability.
Argentina (1990s) – Pegged peso to USD at 1:1 to fight hyperinflation. Initially successful but collapsed in 2001 due to unsustainable debt and loss of competitiveness.
Impact on Global Markets
Trade Flows
Floating currencies allow natural adjustment, promoting fair competition.
Pegged currencies provide certainty but may lead to trade distortions if misaligned.
Capital Flows & Investment
Stability of pegged systems attracts FDI but risks sudden collapse.
Floating regimes can deter investment due to volatility, though hedging instruments mitigate this.
Financial Stability
Pegged regimes are prone to speculative crises (e.g., Thailand 1997, UK’s “Black Wednesday” 1992).
Floating systems face volatility but rarely collapse outright.
Global Imbalances
Persistent pegs (e.g., China’s undervalued yuan in early 2000s) contribute to global trade imbalances, fueling disputes with trading partners.
Future Trends
Rise of Managed Floats – Pure floats and hard pegs are rare. Most countries adopt intermediate systems for balance.
Digital Currencies & Exchange Rates – Central Bank Digital Currencies (CBDCs) could change how pegs/floats operate in practice.
Multipolar Currency World – As China, India, and others gain influence, multiple anchor currencies may coexist, complicating peg strategies.
Geopolitical Pressures – Sanctions, capital controls, and global fragmentation will influence exchange rate choices.
Conclusion
Floating and pegged exchange rates represent two ends of a spectrum in international monetary policy. Floating systems emphasize market freedom, flexibility, and autonomy, while pegged systems prioritize stability, predictability, and investor confidence. Both have strengths and vulnerabilities, and their suitability depends on a country’s economic structure, development stage, and integration with global markets.
In today’s interconnected world, a majority of nations operate hybrid or managed float systems, reflecting the need for both stability and adaptability. As global trade, digital finance, and geopolitical dynamics evolve, the debate between floating and pegged exchange rates will remain central to discussions on international economic governance.
Role of SWIFT in Cross-Border Payments1. The Origins of SWIFT
1.1 The Pre-SWIFT Era
Before SWIFT, banks relied heavily on telex messages to transmit payment instructions. Telex systems were slow, error-prone, lacked standardized formats, and required human intervention to decode and re-key messages. This often resulted in delays, fraud, and disputes in cross-border settlements.
By the early 1970s, with international trade booming, the shortcomings of telex became unsustainable. Leading banks realized the need for a global, standardized, automated, and secure communication system.
1.2 Founding of SWIFT
In 1973, 239 banks from 15 countries established SWIFT as a cooperative society headquartered in Brussels, Belgium. The goal was to build a shared platform for financial messaging, independent of any single nation or commercial entity. By 1977, SWIFT was operational with 518 member institutions across 22 countries.
2. What SWIFT Does
2.1 Messaging, Not Money Movement
A common misconception is that SWIFT transfers money. In reality, SWIFT does not hold funds, settle payments, or maintain accounts for members. Instead, it provides a standardized and secure messaging system that allows banks to communicate financial instructions such as:
Cross-border payments
Securities transactions
Treasury deals
Trade finance documents
2.2 SWIFT Message Types
SWIFT messages follow standardized formats known as MT (Message Type) series. For instance:
MT103 – Single customer credit transfer (used for cross-border payments)
MT202 – General financial institution transfer
MT799 – Free-format message (often used in trade finance)
In recent years, SWIFT has transitioned to ISO 20022, an XML-based messaging standard that provides richer data, improving compliance, transparency, and automation.
2.3 Secure Network Infrastructure
SWIFT operates through a secure, private IP-based network known as SWIFTNet, supported by data centers in Europe, the U.S., and Asia. Messages are encrypted, authenticated, and routed through SWIFT’s infrastructure to ensure confidentiality, integrity, and availability.
3. Role of SWIFT in Cross-Border Payments
3.1 Standardization of Payment Messages
One of SWIFT’s biggest contributions is standardization. By creating globally accepted message formats, SWIFT eliminates ambiguity in payment instructions. This reduces operational risks, errors, and disputes. For example, an MT103 message is universally understood by banks in over 200 countries.
3.2 Speed and Efficiency
Before SWIFT, payments could take days or even weeks to process. With SWIFT, instructions are transmitted instantly across borders. While actual settlement still depends on correspondent banking arrangements, messaging delays have been nearly eliminated.
3.3 Security and Trust
Cross-border transactions involve huge sums of money, often in the billions. SWIFT provides strong encryption, authentication, and anti-fraud protocols, making it the most trusted network for international payments.
3.4 Connectivity in Global Trade
SWIFT connects over 11,000 financial institutions in more than 200 countries and territories. This global reach makes it the backbone of cross-border trade, enabling corporates, banks, and governments to transact seamlessly.
3.5 Correspondent Banking and SWIFT
Cross-border payments usually require multiple intermediaries (correspondent banks) when two banks don’t have a direct relationship. SWIFT facilitates this process by transmitting messages along the chain of correspondent banks, ensuring funds are eventually credited to the beneficiary.
4. SWIFT in Action: An Example
Imagine a customer in India sending $10,000 to a supplier in Germany.
The Indian customer instructs their bank to transfer the funds.
The Indian bank creates an MT103 message via SWIFT, directing its correspondent bank in Europe to debit its account and credit the German bank.
The German bank receives the SWIFT message and credits the supplier’s account.
The supplier receives funds, while SWIFT has acted only as the messaging medium.
This standardized, secure communication ensures accuracy, speed, and reliability.
5. SWIFT’s Economic and Geopolitical Importance
5.1 Enabler of Globalization
SWIFT underpins international trade by making payments predictable and efficient. Without it, global supply chains, remittances, and investment flows would be significantly slower and riskier.
5.2 Role in Sanctions and Geopolitics
Because of its centrality, SWIFT has become a geopolitical tool. For instance, Iranian banks were cut off from SWIFT in 2012 and again in 2018, severely restricting Iran’s access to global markets. Similarly, Russian banks faced SWIFT restrictions in 2022 after the Ukraine invasion.
5.3 Dependence and Alternatives
The reliance on SWIFT has raised concerns about overdependence. Some countries have developed alternatives:
CIPS (China’s Cross-Border Interbank Payment System)
SPFS (Russia’s System for Transfer of Financial Messages)
UPI-based cross-border initiatives (India)
Still, SWIFT remains the dominant system due to its network effects and global acceptance.
6. Evolution and Innovations in SWIFT
6.1 SWIFT gpi (Global Payments Innovation)
Launched in 2017, SWIFT gpi transformed cross-border payments by introducing:
End-to-end tracking (like a parcel tracking system for money)
Same-day use of funds in many cases
Transparency in fees and FX rates
Confirmation of credit to beneficiary
Today, gpi covers over 80% of SWIFT cross-border traffic, making payments faster, cheaper, and more transparent.
6.2 ISO 20022 Migration
SWIFT is migrating from legacy MT messages to ISO 20022 by 2025. This shift will enable:
Richer data for compliance (e.g., sanctions screening, AML checks)
Better automation and reconciliation
Interoperability with domestic real-time payment systems
6.3 Future Technologies
SWIFT is also experimenting with blockchain, central bank digital currencies (CBDCs), and tokenized assets. For instance, SWIFT has piloted experiments linking CBDCs across different countries, positioning itself as a neutral connector even in a digital currency world.
7. Challenges Facing SWIFT
7.1 Competition from Alternatives
Regional systems like China’s CIPS or blockchain-based solutions like RippleNet challenge SWIFT’s dominance. Fintech innovations promise faster, cheaper transfers without multiple intermediaries.
7.2 Costs and Fees
While SWIFT is efficient, cross-border payments often remain costly due to correspondent bank charges. Fintech challengers are pushing for lower-cost solutions.
7.3 Cybersecurity Risks
Being the backbone of global payments, SWIFT is a prime cyber target. Incidents like the 2016 Bangladesh Bank hack, where hackers exploited SWIFT credentials to steal $81 million, highlight vulnerabilities. SWIFT responded with its Customer Security Programme (CSP) to strengthen defenses.
7.4 Geopolitical Pressures
SWIFT’s role in sanctions makes it politically sensitive. Its neutrality is constantly tested as major powers use access to SWIFT as leverage in global disputes.
8. The Future of Cross-Border Payments and SWIFT
8.1 Towards Instant Payments
Global efforts are underway to make cross-border payments as fast as domestic transfers. SWIFT is adapting by linking with real-time domestic systems and enhancing gpi.
8.2 Digital Currencies and Blockchain
The rise of CBDCs, stablecoins, and blockchain networks may disrupt SWIFT’s role. However, SWIFT’s vast network gives it an edge to act as an interoperability layer, connecting legacy systems with digital currencies.
8.3 Regulatory Harmonization
Cross-border payments face compliance challenges (AML, KYC, sanctions). SWIFT’s data-rich ISO 20022 messages can help improve regulatory oversight while maintaining efficiency.
8.4 Balancing Neutrality and Politics
SWIFT’s survival depends on maintaining neutrality while navigating political pressures. Its governance as a cooperative helps, but geopolitical rivalries may accelerate regional alternatives.
9. Conclusion
For over four decades, SWIFT has been the invisible backbone of cross-border payments. By providing a standardized, secure, and reliable messaging system, it has enabled globalization, facilitated trillions in trade and finance, and connected thousands of institutions worldwide.
Its contributions include:
Standardization of payment messages
Enhanced speed, security, and reliability
Support for correspondent banking
Enabling sanctions enforcement and geopolitical leverage
Constant evolution through SWIFT gpi and ISO 20022
Yet, challenges loom: fintech disruptions, geopolitical tensions, cybersecurity risks, and the rise of digital currencies. SWIFT’s ability to innovate and maintain global trust will determine whether it remains the nerve center of international payments in the digital era.
In summary, while SWIFT does not move money directly, its role as the messenger of global finance is irreplaceable—at least for now. The future of cross-border payments may involve blockchain, CBDCs, or regional systems, but SWIFT’s global reach, trust, and adaptability ensure that it will continue to play a central role in shaping how money flows across borders.
Balance of Payments & World Trade ImbalancesPart I: Understanding the Balance of Payments
1. What is the Balance of Payments?
The Balance of Payments is a systematic record of all economic transactions between residents of a country and the rest of the world. It includes trade in goods and services, cross-border investments, transfers, and monetary flows.
In principle, the BoP always balances: total credits (money coming in) equal total debits (money going out). However, the composition of transactions—whether surpluses or deficits in certain accounts—matters for economic stability.
2. Main Components of BoP
a) Current Account
The current account records trade in goods, services, primary income (investment income, wages), and secondary income (remittances, foreign aid).
Trade balance: Exports minus imports of goods.
Services balance: Exports minus imports of services such as tourism, IT outsourcing, shipping, etc.
Primary income: Interest, dividends, wages.
Secondary income: Transfers like remittances, pensions, grants.
A current account surplus means a country is a net lender to the rest of the world, while a deficit means it is a net borrower.
b) Capital Account
This is usually small and records transfers of capital assets, debt forgiveness, and non-produced, non-financial assets (like patents or natural resource rights).
c) Financial Account
The financial account tracks cross-border investments:
Foreign Direct Investment (FDI): Long-term investments in businesses abroad.
Portfolio Investment: Stocks, bonds, and securities.
Other Investments: Loans, trade credits, banking flows.
Reserve Assets: Central bank reserves (foreign currencies, gold, IMF position).
d) Errors & Omissions
Statistical discrepancies that arise due to imperfect data reporting.
3. Why is BoP Important?
Macro stability indicator: Reveals structural strengths/weaknesses in a country’s economy.
Policy formulation: Helps governments decide on fiscal, monetary, and trade policies.
Investor confidence: Influences credit ratings, exchange rates, and capital inflows.
Global coordination: Used by IMF, WTO, and G20 to monitor systemic risks.
Part II: World Trade Imbalances
1. Defining Trade Imbalances
A trade imbalance occurs when a country persistently runs a trade surplus (exports > imports) or trade deficit (imports > exports). While short-term imbalances are natural, structural and persistent gaps can destabilize the world economy.
2. Causes of Trade Imbalances
a) Differences in Productivity and Competitiveness
Countries with higher productivity (e.g., Germany, Japan) tend to export more, creating surpluses.
b) Currency Valuations
If a country’s currency is undervalued (e.g., Chinese yuan in the 2000s), its exports become cheaper, widening surpluses. Conversely, overvalued currencies contribute to deficits.
c) Consumption and Savings Behavior
The U.S. model: High consumption, low savings → trade deficits.
The Asian model: High savings, export-oriented growth → trade surpluses.
d) Resource Dependence
Oil-exporting nations like Saudi Arabia often run surpluses due to high energy demand.
e) Global Supply Chains
Multinational corporations fragment production globally. Goods may be “assembled in China” but use inputs from multiple countries, complicating trade balance measurement.
f) Government Policies
Subsidies, tariffs, currency interventions, and trade agreements influence competitiveness.
3. Consequences of Trade Imbalances
a) For Deficit Countries
Rising external debt.
Dependence on foreign capital.
Currency depreciation risk.
Political vulnerability (e.g., U.S.–China tensions).
b) For Surplus Countries
Overreliance on external demand.
Domestic underconsumption.
Exposure to global downturns.
Accusations of “unfair trade practices.”
c) Global Impact
Exchange rate misalignments.
Risk of trade wars and protectionism.
Global financial crises (imbalances partly fueled 2008).
Distorted capital flows—surpluses recycled into deficit-country debt markets.
Part III: Historical & Contemporary Case Studies
1. The U.S. Trade Deficit
Since the 1980s, the U.S. has run persistent current account deficits.
Driven by high consumption, dollar reserve currency status, and globalization.
Funded by foreign purchases of U.S. Treasury bonds, especially by China and Japan.
2. China’s Surplus
Export-led industrialization strategy.
Massive trade surpluses in the 2000s, peaking near 10% of GDP in 2007.
Accumulated trillions in foreign reserves.
Gradual rebalancing after 2010, but surplus remains large.
3. Eurozone Imbalances
Germany runs huge surpluses, while southern Europe (Greece, Spain, Italy) historically ran deficits.
Imbalances within a common currency area created debt crises during the 2010 Eurozone crisis.
4. Oil Exporters
OPEC countries run surpluses during high oil prices.
But face volatility when prices crash.
5. Japan
Historically a surplus country due to its manufacturing strength.
Demographic decline now affecting its external balance.
Part IV: Policy Responses to Trade Imbalances
1. Domestic Policy Options
For deficit countries: Promote exports, encourage savings, reduce fiscal deficits.
For surplus countries: Stimulate domestic consumption, allow currency appreciation.
2. Exchange Rate Adjustments
Flexible exchange rates can correct imbalances, but in practice, many governments intervene in currency markets.
3. Trade Agreements & Protectionism
Tariffs, quotas, and trade deals aim to adjust trade balances, though they often create new distortions.
4. Role of International Institutions
IMF: Provides surveillance, loans, and adjustment programs.
WTO: Mediates trade disputes.
G20: Coordinates global responses to imbalances.
Part V: Future Outlook
1. Digital Economy & Services Trade
The rise of digital platforms, e-commerce, and remote services (IT, finance, design) is reshaping BoP structures. Countries strong in digital services (India, U.S., Ireland) may offset merchandise deficits.
2. Geopolitical Shifts
U.S.–China rivalry, reshoring, and supply chain diversification will affect trade balances.
3. Climate Transition
Green technologies, carbon tariffs, and energy transitions will change global trade patterns. Oil exporters may see reduced surpluses in the long term.
4. Multipolar Currencies
The U.S. dollar may gradually lose dominance, with the euro, yuan, and digital currencies playing larger roles in financial accounts.
5. AI & Automation
Advanced technology may reduce labor-cost advantages, altering comparative advantage and global imbalances.
Conclusion
The Balance of Payments is not just a technical accounting statement—it is a powerful lens through which to view the global economy. Persistent world trade imbalances reflect deep structural factors: consumption patterns, savings rates, productivity, resource endowments, and government strategies.
While deficits and surpluses are not inherently “bad,” their persistence at extreme levels poses risks of instability, inequality, and geopolitical friction. Addressing them requires coordinated domestic reforms, international policy cooperation, and adaptive strategies for a rapidly changing world economy.
In the 21st century, as global trade evolves with digitalization, climate change, and shifting geopolitics, the challenge will be to ensure that the Balance of Payments reflects not just imbalances, but sustainable, inclusive, and resilient patterns of global economic exchange.

Role of G7 and G20 in World Markets1. Historical Background
1.1 Origins of the G7
The G7 originated in the 1970s oil crisis and currency instability. The breakdown of the Bretton Woods system (1971) and the 1973 oil shock forced leaders of the US, UK, France, West Germany, Italy, and Japan to coordinate policies.
The first meeting took place in 1975 at Rambouillet, France. Canada joined in 1976, making it the G7.
The forum was designed as an informal space for dialogue among advanced economies, free from the rigid bureaucracy of the IMF or UN.
1.2 Expansion into G20
By the late 1990s, globalization had empowered emerging markets like China, India, Brazil, and South Africa.
The Asian Financial Crisis of 1997–98 exposed the limitations of the G7, which could not represent the interests of developing nations.
The G20 was created in 1999, initially as a forum for finance ministers and central bank governors.
Following the 2008 Global Financial Crisis, the G20 was elevated to a leaders’ summit level, becoming the “premier forum for international economic cooperation.”
2. Membership & Structure
2.1 G7
Members: United States, Canada, United Kingdom, France, Germany, Italy, Japan, and the EU (as an observer).
Characteristics: Advanced, high-income democracies with strong global financial markets.
Focus: Monetary policy coordination, financial stability, trade, development aid, sanctions, and geopolitical security.
2.2 G20
Members: 19 countries + European Union. Includes major emerging economies like China, India, Brazil, Russia, South Africa, Mexico, Indonesia, Turkey, Argentina, Saudi Arabia, and others.
Coverage: Represents 85% of global GDP, 75% of international trade, and two-thirds of the world’s population.
Focus: Broader economic and financial stability, trade, infrastructure investment, climate change, digital economy, inclusive development.
3. Role in Financial Markets
3.1 Market Stability
The G7 historically acted as a currency stabilizer. For example, the Plaza Accord (1985) coordinated interventions to weaken the US dollar, reshaping forex markets.
The Louvre Accord (1987) similarly stabilized exchange rates. These decisions had immediate effects on bond yields, commodity prices, and stock market sentiment.
The G20, after 2008, coordinated stimulus packages worth trillions of dollars. This joint effort restored investor confidence, stabilized equity markets, and prevented a deeper depression.
3.2 Regulatory Standards
Both groups influence the Basel Committee on Banking Supervision, which sets global banking capital requirements.
The G20’s Financial Stability Board (FSB) was established in 2009 to monitor risks, enforce transparency, and reduce systemic threats. This has reshaped financial markets, particularly derivatives and shadow banking oversight.
3.3 Debt Management & Sovereign Risk
G7 finance ministers often negotiate debt relief for low-income countries, working alongside the IMF and World Bank.
The G20 launched the Debt Service Suspension Initiative (DSSI) in 2020, allowing the poorest nations to defer debt payments during the pandemic—affecting global bond market pricing of sovereign risk.
4. Role in Global Trade
4.1 G7’s Trade Leadership
G7 economies historically dominated WTO negotiations and set the tone for trade liberalization.
The G7 often pushes for open markets, free trade agreements, and intellectual property rights protection.
However, it has also been accused of protectionism—for instance, through agricultural subsidies or technology restrictions.
4.2 G20 and Trade Balancing
The G20 plays a bigger role in mediating between advanced and emerging economies.
After 2008, the G20 pledged to avoid protectionism and keep markets open. This was crucial in preventing a collapse of world trade.
More recently, the G20 has dealt with US-China trade tensions, global supply chain resilience, and reforms of the WTO dispute system.
5. Role in Investment & Infrastructure
5.1 Investment Flows
G7 countries, as capital exporters, dominate foreign direct investment (FDI) and global finance. Their regulatory policies shape global flows.
The G20 promotes inclusive investment frameworks, encouraging capital flows into Africa, Asia, and Latin America.
5.2 Infrastructure Financing
The G20 launched the Global Infrastructure Hub (2014) to connect investors with large-scale infrastructure projects.
The Partnership for Global Infrastructure and Investment (PGII), promoted by G7 in 2022, was designed as a counter to China’s Belt and Road Initiative (BRI).
6. Role in Crisis Management
6.1 2008 Financial Crisis
G7 alone lacked credibility, as emerging markets were now critical players.
The G20’s emergency summits (2008–2009) led to coordinated fiscal stimulus, global liquidity injections, and bank recapitalizations. This stabilized world stock markets.
6.2 Eurozone Debt Crisis (2010–2012)
G7 central banks coordinated to provide liquidity and backstop the euro.
G20 forums pressured European leaders to balance austerity with growth measures.
6.3 COVID-19 Pandemic (2020–2021)
G20 pledged $5 trillion in economic stimulus, central banks slashed interest rates, and liquidity lines were extended across borders.
G7 coordinated on vaccine financing (COVAX) and kept supply chains for medical goods functioning.
7. Role in Currency & Monetary Policy
G7 historically managed exchange rate diplomacy (e.g., Plaza Accord).
The G20 now addresses global imbalances, such as China’s currency valuation, US trade deficits, and emerging market vulnerabilities.
Both groups’ central banks’ policies (Fed, ECB, BOJ, PBOC, etc.) directly influence capital markets worldwide.
8. Role in Technology & Digital Economy
G7 promotes data governance, cybersecurity standards, AI regulations, and digital taxation frameworks.
G20 addresses digital inclusion, fintech growth, cross-border payment systems, and crypto regulation.
These policies affect stock valuations in the tech sector, investor confidence, and cross-border capital mobility.
9. Future Outlook
The G7 will likely remain a strategic and political coordination forum for Western democracies, focusing on sanctions, technology standards, and security-linked economics.
The G20 will remain the central platform for global economic governance, especially in addressing:
Climate financing
Sustainable debt frameworks
Digital currencies (CBDCs)
AI-driven market disruptions
Geopolitical risks in trade and energy
Their role will be critical as the world transitions into a multipolar economic order where no single power dominates.
10. Conclusion
The G7 and G20 act as twin pillars of global economic governance. While the G7 provides leadership from advanced democracies, the G20 reflects the diversity of the modern global economy. Their combined influence extends across financial markets, trade, investment, crisis management, energy security, and digital governance.
Though criticized for exclusivity, lack of enforcement, or internal divisions, both remain indispensable. In times of global crisis—whether financial collapse, pandemics, or geopolitical shocks—they have demonstrated the capacity to restore market confidence and stabilize the world economy.
Ultimately, the G7 and G20 do not replace institutions like the IMF, World Bank, or WTO, but they provide the political will and high-level coordination necessary to steer the world through uncertainty. In a world of interconnected markets, their role will only deepen in shaping the future of global capitalism.