Trading Psychology 101: Master Your Mind Before the MarketWhen people first start trading, most of their attention goes to entries, indicators, and strategies. It feels like the secret to success must be hidden in the charts.
Over time, traders realize something uncomfortable: the biggest challenge isn’t the market—it’s themselves.
You can learn technical analysis, understand risk management, and even copy profitable strategies. Yet, if fear, greed, or impatience take over, the outcome will be inconsistent.
Research suggests that trading performance depends far more on mindset than on technical skill alone.
Here are a few patterns almost every trader will recognize:
Entering too quickly because of FOMO.
Closing winners too early out of fear they will reverse.
Holding on to losers, hoping they will turn around.
Ignoring rules after a streak of good trades because of overconfidence.
Each one might feel harmless in the moment, but over time they erode consistency.
Imagine two traders using the exact same strategy with a 60% win rate.
Trader A lets emotions dictate actions. They cut winners short, stretch losers, and end up losing money.
Trader B follows rules calmly. Losses are accepted, winners are allowed to run. Over the same number of trades, this trader ends profitable.
The system is identical, but psychology makes all the difference.
5. The Real Lesson
Markets are unpredictable. Strategies are never perfect. What you can control is how you respond.
Strong psychology allows you to execute consistently and let probabilities play out. Without it, even the best system will eventually fail.
6. Benefits of a Solid Mindset
Building psychological strength in trading gives you:
Patience to wait for quality setups.
1. Discipline to stick with your plan.
2. Resilience to handle losing streaks.
3. Consistency across weeks and months.
4. Mental clarity to make rational decisions under stress.
Community ideas
Bitcoin Halving Approaches Fear?? or Greed??Do you believe Bitcoin will repeat its historical halving pattern, or could this time be different?
Which emotion do you think dominates the market now fear of correction or greed for new highs?
Among TradingView’s tools (Fear & Greed Index, Volume Profile, 200-day MA, Fibonacci), which one do you personally trust the most during halving cycles?
Hello✌️
Spend 2 minutes ⏰ reading this educational material.
🎯 Analytical Insight on Ethereum:
Ahead of the upcoming Bitcoin halving, a notable pullback appears likely 📉. Ethereum has broken below its descending channel, indicating bearish momentum. A potential drop of around 15% could target the $3,800 level ⚡.
Now , let's dive into the educational section,
Bitcoin Halving Approaches: Fear of Correction or Greed for Records?
What is halving? Every four years, the block reward for Bitcoin miners gets cut in half. This event means new supply becomes more limited over time. History has shown that after each halving, Bitcoin usually enters a new bullish cycle. But before the real move starts, the market often goes through sharp volatility, creating both fear and greed at extreme levels.
This time the same question repeats itself: will Bitcoin break into new all-time highs after the halving, or will a heavy correction surprise everyone before that happens?
🧠 Psychology of Fear and Greed
Around halving, traders get stuck between two opposite feelings. On one side, the fear of losing money in a possible correction. On the other side, the fear of missing out on massive gains. This psychological battle often causes rushed entries and early exits.
🐋 The Role of Whales
Whales perfectly understand how collective emotions work. At moments of extreme hope or extreme panic, they place heavy orders to flip the market in the opposite direction. Right before halving, this psychological game intensifies more than usual.
⏳ Halving History
Looking back at the three previous halvings, a similar pattern stands out: short-term corrections around the event, followed by a powerful long-term rally. This repetitive history fuels greed and drives many traders to ignore risk management completely.
📊 TradingView Tools
To avoid being trapped by emotions, having the right tools is essential. TradingView provides several key indicators:
The Fear & Greed Index measures overall sentiment. When it shows extreme greed, that’s usually a moment to be cautious.
The Volume Profile highlights price ranges with the highest trading activity. Around halving, these levels often turn into psychological support and resistance zones.
The 200-day Moving Average remains one of the strongest trend indicators, respected in all previous halving cycles.
Even a simple Fibonacci retracement can reveal zones where the biggest emotional battles happen, especially near the golden 0.618 level.
🔑 Conclusion
Bitcoin halving is more of a psychological event than a purely technical one. Charts and indicators provide guidance, but in the end, your mindset determines success or failure. History favors those who resisted collective emotions and followed structured plans.
Three Golden Advices :
Always review Bitcoin’s halving history before making big decisions.
Never forget risk and capital management, especially when greed is high.
Let TradingView tools guide your analysis, not the noise of the crowd.
✨ Need a little love!
We pour love into every post your support keeps us inspired! 💛 Don’t be shy, we’d love to hear from you on comments. Big thanks , Mad Whale 🐋
📜Please make sure to do your own research before investing, and review the disclaimer provided at the end of each post.

Liquidity in Trading: The Basics You Must Understand👉 If you can’t identify liquidity, you become the liquidity.
It's not an indicator, It's not a pattern. It's not a theory.
It's how the markets actually move.
Every trader has seen it happen: you take a position at the “obvious” level, only to get stopped out by a quick wick — and then the market runs exactly where you expected. That wasn’t bad luck. That was liquidity.
In this post, you’ll learn few main forms of liquidity that move markets and how to avoid being stop hunted and actually use such a phenomena for your advantage.
Don't be a liquidity
Price doesn’t move randomly inside ranges. It hunts liquidity at the edges.
• Retail trap: Traders pile orders right at the range high/low.
• Smart money: Hunt's edges of range before starting the move.
Wait for the sweep of those levels. The stop runs happen first, the real move comes after.
⚠️ If a pivot level gets tapped multiple times, it's on purpose. Smart money are creating illusion of strong support / Resistance.
Les informed traders trades patterns like : Double bottom, Double top and they put the stop losses above the range - This creates a Liquidity cluster which smart money needs to execute their orders. They will come for it before the real move happen.
How to enter continuation
Even in strong trends, price doesn’t move in straight lines.
• Consolidation → Expansion: Liquidity builds during pullbacks or sideways pauses, then gets released in a sharp move.
• Retracement → Expansion: don’t chase the first pullback. Wait for at least 50% pullbacks. Not earlier. Best setup is when it has all like the one below.
Double top as liquidity, range, 50% pullback , stop hunt
• Double tops and Triple tops are engendered liquidity if you see it expect price go thru that levels
The win isn’t catching the exact bottom. It’s catching a clean entry with strong Trend continuation - low timeframe reversal and with right timeframe allignements.
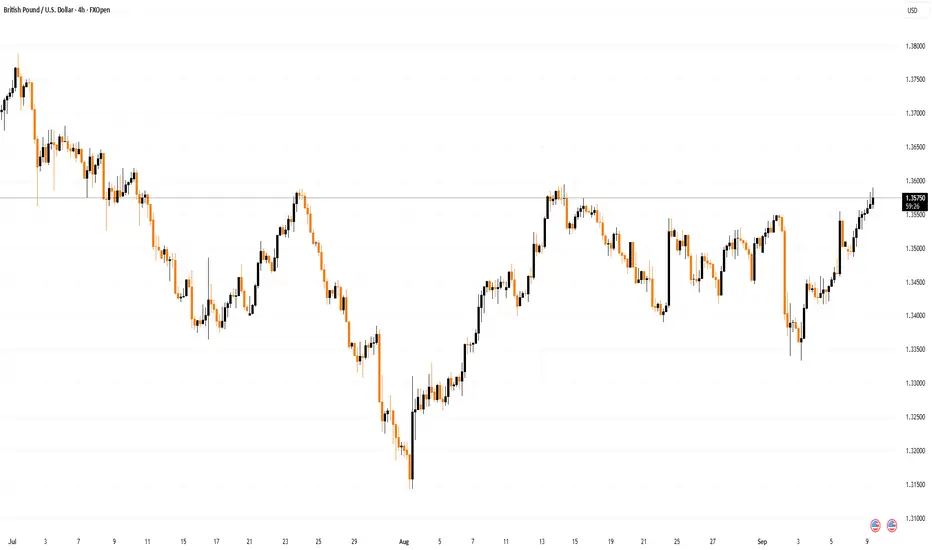
So here is again GBPUSD example where we had the weekly range, stop hunt to 50% of the swing.
After stop hunt occurs you wait for. H4 OB being created in other words engulf of last bulky down candle and clean close above. Then you can enter with SL below the stop hunted lows, not only that traders was liquidated there but also another group of traders entered shorts and they will be now liquidated above that double top and its your target.
Importance of key level
Even when smart money moves price to the highs where it seems there is not key level always look left price mostly stop just right above or below the key level. Ranges for some time makes false move in the direction which sucks traders in to to a trade and then they hit key level and go that direction.
If the move is not going from key level it's a trap. We can use many types of levels, but here is a tip for the forex Whole, quarter, half levels are strong. If your order block, supply / demand occurs or classic support occurs around that level it will have higher probability and its not because of psychological level. It's because these levels are what institutions are trading.
Stop hunts are not your enemy — unless you ignore it. The market makers hunts liquidity before it moves. By starting thinking about the markets this was way you will recognize and will be able to visualize future movements.
Summary
Big challenge is waiting patiently for the stop hunt to happen. And yes sometimes price moves without a stop hunt and you will miss a move. But it's always better not to be in a trade you want to be than being In trade you dont want to be.
Shift from being the exit liquidity to being the trader who patiently waits, confirms, and executes with precision.
🩸 Spot the trap. 🩸 Wait for the sweep. 🩸 Trade with intention.
Dont trust me and fact check this on your chart for your confidence. It's only way to start to see markets differently.
David Perk aka Dave FX Hunter
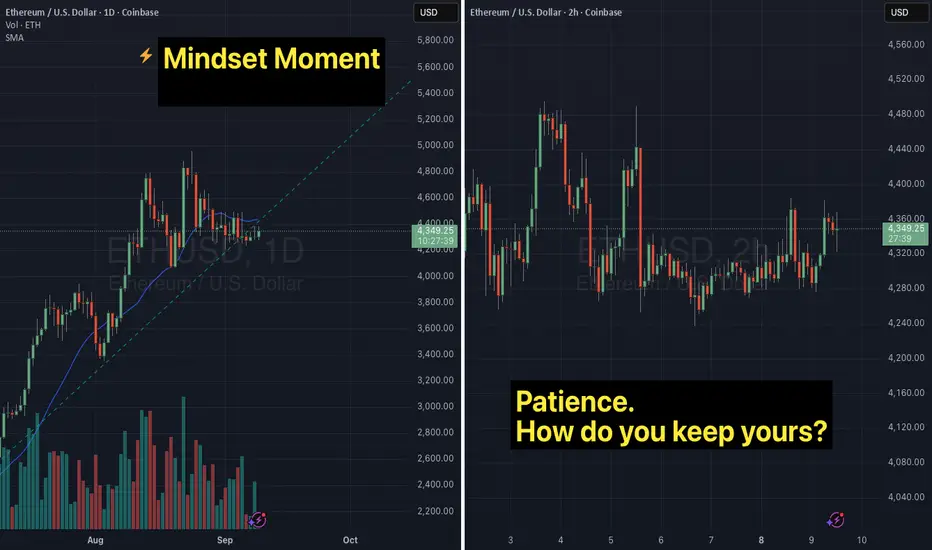
Patience: Is a virtue but it's damn hard...NOTE - This is a post on Mindset and emotion. It is NOT a Trade idea or strategy designed to make you money. If anything, I'm taking the time here to post as an effort to help you preserve your capital, energy and will so that you are able to execute your own trading system as best you can from a place of calm, patience and confidence'.
Here's a scenario:
You want the trade to hurry up… but the market has no reason to move on your timeline.
Here on Ethereum we see consolidation.
We can imagine traders framing for a break in either direction.
There will certainly be plenty trying their hand at getting ahead of the move and getting chopped.
Patience is one of the hardest skills for traders to master. The market doesn’t reward impatience it punishes it. If I'm honest, when I first started out, I certainly didnt think of patience as a 'skill' - but it's certainly essential. Without it, I've either wasted a lot of 'ammunition' in trying - or missed the whole point of a trade once I was depleted of will.
So offering some thoughts for you. Please take what resonates and ignore what doesn't work for you:
How impatience shows up:
You close trades too early because the profit feels “good enough.”
You jump into setups that haven’t confirmed because you’re tired of waiting.
You watch price drift sideways and feel an urge to “make something happen.”
You start to entertain thoughts that undermine your confidence.
You get distracted and do something else entirely risking missing the signal all together.
Emotional side:
Impatience often hides anxiety the need for relief, action, or certainty. Your body feels restless, your mind races with “what ifs,” and you start convincing yourself to bend your rules.
This is not 'woo'. It's an actual internal angst that causes one to act / behave in a way and at a time that is against ones intention. Ironically - as much as we ignore it - it' drives our behaviour.
So how can we get ahold of this to try and ensure it doesn't sabotage our intentions?
Consider the following and see if it works for you.
Shift your mindset
See patience as an active discipline and not just something that's passive. If we practice and nurture patience with mindfulness, the stronger the muscle to holding your ground, sticking to your process and letting the probabilities play out on their own clock not yours.
Practical tips .. the How ..:
When you feel that urge rising:
- notice where in your body you're feeling impatience.
- recognise how it's showing up for you (tension, irritation, restlessness - something else)
- notice what you are saying to yourself
- consider and assess : when was the last time I had a drink of water, had something to eat?
- do something physical to diffuse the feeling and get some energy back in the body:
stretch, breathe, walk away from the screen for a moment
put some music on and dance your ass off, do some burpees
set an alert on your screens, phone etc
Reminder yourself ... 'Waiting is a position too'.
I hope this helps. Interested in hearing what you do to instill and respect your patience
ONGCTrend:
From 2020 lows (~₹50), ONGC rallied sharply to ~₹345 (2022 peak).
Since then, it has been in a corrective downtrend, now stabilizing near ₹205–₹230.
Still inside a rising channel (support & resistance lines drawn).
Support Levels:
Strong support near ₹200–205 (trendline + horizontal level).
If broken, next support lies around ₹175–180.
Resistance Levels:
Immediate resistance near ₹230–235 (horizontal + channel mid-zone).
Higher resistance near ₹275–280, then ₹320–345 (all-time high).

FX Professor 101: How I Start My Charts with Trendlines & FibFX Professor 101: How I Start My Charts with Trendlines & Fib Levels 🧠📈
Some of you asked me to show my charting process again — so here it is, strictly educational, using Pepper as the example (because a few of you believe in it and asked about it). Let’s build this chart together from scratch. 🛠️
Step 1: Get Full Historical Context 📜
I always start by selecting a chart with the most data available. More history = more structure to work with. No shortcuts here.
Step 2: Anchor with Horizontal Trendlines 📏
I look for a clear support → resistance → support pattern with no manipulation. That becomes my anchor level.
Then I scan for secondary levels – if they’re too close or manipulated, I keep them dotted and as references.
Zooming in helps. Don't hesitate to get granular when needed. 🔍
Step 3: Respect the Manipulation 🤨
If a chart feels overly manipulated (wicks, fakeouts, no clear rejections), I lose trust in it. But sometimes even within manipulation, valid levels emerge — and I mark them clearly.
Step 4: Fibonacci Confirmation 🔢✨
Once I place the trendlines, I overlay Fibonacci retracements to see if they align. In this case, one of my levels landed exactly on 0.618 – no cap! 😂 That’s when experience meets structure.
Final Notes 🧘♂️
• Only two levels made the final cut
• Secondary levels marked with dotted lines
• 0.618 Fib validated the primary structure
• Support at 929 is looking strong as of now
This is my process. It’s how I start every serious chart. Nothing fancy — just history, structure, and experience. If it helps even one of you out there, I’m happy. 💙
One Love,
The FXPROFESSOR 💙
Food for Trading Thought:
From my experience as an AI developer, I’ve come to one firm conclusion — AI will never replace us. It can assist, but it can’t see what you see or feel what you feel. The real edge in trading is your human intuition, patience, and discipline.
Trading is a game — a risky game. Play it right if you're going to play it at all.
Stay human and remember: the best Blockchain is YOU, the best Altcoins are your loved ones and your work/creation/purpose in life. 🎯

What Is Value at Risk, and How Do Traders Use It in Trading?What Is Value at Risk, and How Do Traders Use It in Trading?
Value at Risk (VaR) is a widely used risk metric that helps traders and institutions estimate potential losses over a given timeframe. By quantifying downside risk, VaR provides a structured way to assess exposure across different assets and strategies. This article explains the VaR definition, how it’s calculated, and how traders use it in real-world markets to refine risk management.
What Does VaR Stand For?
So what is Value at Risk? Value at Risk, abbreviated to VaR, is a statistical measure used to estimate how much a trader, portfolio, or institution could lose over a set period under normal market conditions. It provides a single risk figure, making comparison of different assets, portfolios, or strategies more straightforward.
VaR is defined by three key components:
- Time Horizon – The period over which the potential loss is measured, such as one day, week, or month.
- Confidence Level – Expressed as a percentage, typically 95% or 99%, indicating the probability that losses will not exceed the calculated VaR amount.
- Potential Loss – The estimated maximum amount or percentage that could be lost within the given timeframe, based on historical or simulated market movements.
For example, if a portfolio’s Value at Risk has a one-day 95% risk estimate of £10,000, it means that under normal conditions, there is a 95% chance that losses won’t exceed £10,000 in a single day. However, the remaining 5% represents extreme events where losses could be greater.
VaR is widely used in trading, portfolio management, and regulatory frameworks because it quantifies risk in monetary terms. It helps traders set position limits, assess exposure, and compare risk across different assets. However, while VaR is useful, it does not account for rare but extreme losses, which is why it’s often combined with other risk measures.
How Value at Risk Is Calculated
There are three main ways to calculate VaR, each with its own approach to estimating potential losses: the historical method, the variance-covariance method, and the Monte Carlo simulation. Each method has strengths and weaknesses, and traders often use a combination to cross-check risk assessments.
1. Historical Method
This approach looks at past market data to estimate future risk. It takes the historical returns of an asset or portfolio over a given period—say, the last 250 trading days—and ranks them from worst to best. The VaR is then set at the percentile corresponding to the chosen confidence level.
For example, in a 95% confidence level VaR calculation using 250 days of data, the worst 5% (12.5 worst days) would indicate the expected loss threshold. If the 13th worst loss was £8,000, that would be the VaR estimate. This method is simple and doesn’t assume a normal distribution, but it relies on past data, which may not capture extreme events.
2. Variance-Covariance Method
The Variance-Covariance (VCV) method assumes that potential returns follow a normal distribution and estimates risk using standard deviation (volatility).
One of the main advantages of the VCV method is its simplicity and efficiency, particularly for portfolios with multiple assets. However, its accuracy depends on the assumption that potential returns are normally distributed, which may not always hold, especially during extreme market conditions.
3. Monte Carlo Simulation
Monte Carlo simulations generate thousands of hypothetical market scenarios based on random price movements. It models different potential outcomes by simulating how prices might evolve based on past volatility and correlations. The resulting dataset is then analysed to determine the percentile-based VaR estimate.
This method is more flexible and can handle complex portfolios but is computationally intensive and requires strong assumptions about price behaviour.
How Traders Use Value at Risk in Trading
Traders use Value-at-Risk models to measure potential losses, manage exposure, and make decisions about position sizing. Since VaR quantifies risk in monetary terms, it provides a clear benchmark for setting risk limits on individual trades or entire portfolios.
One of the most practical applications of VaR is in position sizing. A trader managing a £500,000 portfolio might have a risk tolerance of 1% per trade, meaning they are comfortable with a potential £5,000 loss per trade. By calculating VaR, they can assess whether a given trade aligns with this limit and adjust the position size accordingly.
Hedge funds, proprietary trading firms, and institutional investors use VaR to allocate capital efficiently. If two trades have the same expected returns but one has a higher VaR, a trader may adjust exposure to avoid exceeding risk limits. Large institutions also use portfolio-wide VaR to monitor overall exposure and assess whether they need to hedge positions.
Another key use is stress testing. Traders often compare historical VaR to actual market moves, especially during volatile periods, to gauge whether their risk model holds up. If markets experience larger-than-expected losses, traders may refine their approach by incorporating additional risk measures like Conditional VaR (CVaR) or adjusting exposure to tail risks.
Ultimately, VaR is a risk filter—it doesn’t dictate decisions but helps traders identify when exposure might be higher than expected, so they can adjust accordingly.
Strengths and Limitations of VaR
Value at Risk is widely used in trading and portfolio management because it provides a single, quantifiable measure of potential loss. However, while it’s useful for assessing risk, it has limitations that traders need to be aware of.
Strengths of VaR
- Straightforward risk measure: VaR condenses complex risk exposure into a single number, making comparison of different assets and strategies more straightforward.
- Applicable across asset classes: It works for stocks, forex, commodities, and fixed income, allowing traders to standardise risk assessment across different markets.
- Useful for position sizing: Traders can align their risk limits with VaR calculations to try keeping exposure within predefined boundaries.
- Regulatory and institutional use: Banks and hedge funds use VaR to comply with risk management regulations.
Limitations of VaR
- Does not account for extreme losses: VaR shows the potential loss up to a given confidence level but does not measure tail risk—severe market events beyond that threshold.
- Assumes normal market conditions: Some VaR methods rely on historical data or normal distribution assumptions, which may not hold during volatile periods or financial crises.
- Sensitive to calculation method: Different approaches (historical, variance-covariance, Monte Carlo) can produce different VaR figures, leading to inconsistencies in risk estimation.
- Past data may not reflect future risks: Markets evolve and historical price patterns may not always be reliable indicators of future behaviour.
Because of these limitations, traders often combine VaR with other risk measures, such as Conditional VaR (CVaR), drawdowns, and volatility analysis, for a more comprehensive risk assessment.
Real-World Examples of VaR in Financial Markets
Value at Risk is used by traders, hedge funds, and financial institutions to assess market exposure and manage risk. It plays a key role in everything from daily trading operations to large-scale regulatory compliance.
J.P. Morgan and the Birth of VaR
VaR gained prominence in the 1990s when J.P. Morgan developed its RiskMetrics system, which set a standard for institutional risk measurement. The firm used VaR to estimate potential losses across its trading desks, providing a consistent risk measure for its global operations. This approach became so influential that it was later adopted by regulators and central banks.
Long-Term Capital Management (LTCM) – A VaR Misstep
It’s believed that the reliance of the hedge fund Long-Term Capital Management (LTCM) on VaR to manage its highly leveraged positions in the late 1990s led to the fund’s collapse. While its models suggested limited downside risk, LTCM’s reliance on normal market conditions led to catastrophic losses when a position in Russian debt unravelled. The fund’s VaR calculations underestimated extreme market moves, contributing to a collapse that required a $3.6 billion bailout from major banks.
Goldman Sachs During the 2008 Crisis
During the 2008 financial crisis, Goldman Sachs relied on VaR to monitor trading risk. At the peak of market volatility in late 2008, its daily VaR jumped significantly, highlighting the increased risk in its portfolio. The firm adjusted exposure accordingly, reducing positions in high-risk assets to manage potential losses.
The Bottom Line
Value at Risk provides traders with a clear, quantifiable measure of potential losses, helping them manage exposure and refine risk strategies. However, while useful, it is combined with other metrics for a more complete risk assessment.
FAQ
What Is VaR?
The Value at Risk, or VaR, meaning refers to a statistical measure used to estimate the potential loss of an asset, portfolio, or trading strategy over a specific timeframe with a given confidence level. It helps traders and institutions assess market exposure and manage risk.
What Does VaR Mean in Trading?
In trading, VaR quantifies the potential downside of a position or portfolio. It provides a single number that represents the maximum expected loss over a set period, such as one day or one week, under normal market conditions.
How to Calculate Value at Risk?
VaR is typically calculated using three methods: historical simulation, which uses past market data; the variance-covariance method, which assumes a normal distribution of potential returns; and Monte Carlo simulation, which generates potential future price movements to estimate risk.
What Is a VaR Strategy?
A VaR strategy involves using VaR to set position limits, manage exposure, and allocate capital efficiently. Traders and institutions often integrate VaR into broader risk management frameworks to balance potential risk and returns.
What Does 95% VaR Mean?
A 95% VaR means there is a 95% probability that losses will not exceed the calculated VaR amount over the chosen period. The remaining 5% represents extreme market events where losses could be higher.
This article represents the opinion of the Companies operating under the FXOpen brand only. It is not to be construed as an offer, solicitation, or recommendation with respect to products and services provided by the Companies operating under the FXOpen brand, nor is it to be considered financial advice.
My EU 2nd Entry Learn!OHLC CONCEPT or OLHC CONCEPT.
This reversal concept implies that a trader can easily project the move of any higher timeframe Candle by catching the Open of the candle, it's mitigation to an area of Interest or Sweep of Liquidity creating the High/ Low , targeting the next Area of Interest(AOI) or Liquidity (liq) creating the Low/ High and the Closing at Market Price.
This Concept works on any Higher timeframe Candle i.e 4hr, Daily, Weekly & Monthly candles. The aim is to look for your entry setup on the Lower timeframe which is (Sweep of Liquidity while mitigating Area of Interest (AOI), Market Structure shift, and retracement to mitigate Imbalance, OB, or Breaker and targeting AOI's or Liquidities confirming your Bias.
Take continuous entries and stack as price goes in your direction while taking partial profits too.
Go to your charts and practice this. See you all later. :)

Market Structure is Actually EASY- Hear me outUnderstanding Market Structure Through Arcs
Market structure always seems simple when explained on YouTube. But open up a chart, and suddenly it feels puzzling, inconsistent, even frustrating. Imagine this: you’re analyzing the structure of a forex pair, confidently tracking highs and lows. Everything makes sense. Then you switch to a different pair—or even just a different date on the same chart—and suddenly it feels like your skill vanished. Yesterday you “understood” market structure, but today you don’t. So, what’s happening?
The truth is, when this confusion sets in, it’s usually because you’re looking for the wrong signs. Traders often get caught up searching for zigzags, breaks of structure (BoS), market shifts, supply and demand zones, or liquidity sweeps. But the key to truly understanding market structure comes down to one core skill: identifying strong and weak structures.
Redefining Market Structure
Market structure is not simply a zigzag. It’s not just supply and demand. Market structure is a collection of structures that, when viewed together, naturally form zigzags, supply/demand areas, and BoS/market shift levels.
And here’s the important part: not all structures are created equal. But don’t worry—you don’t need to memorize dozens of “types.” There are only two: strong structures and weak structures.
How to Identify Structures
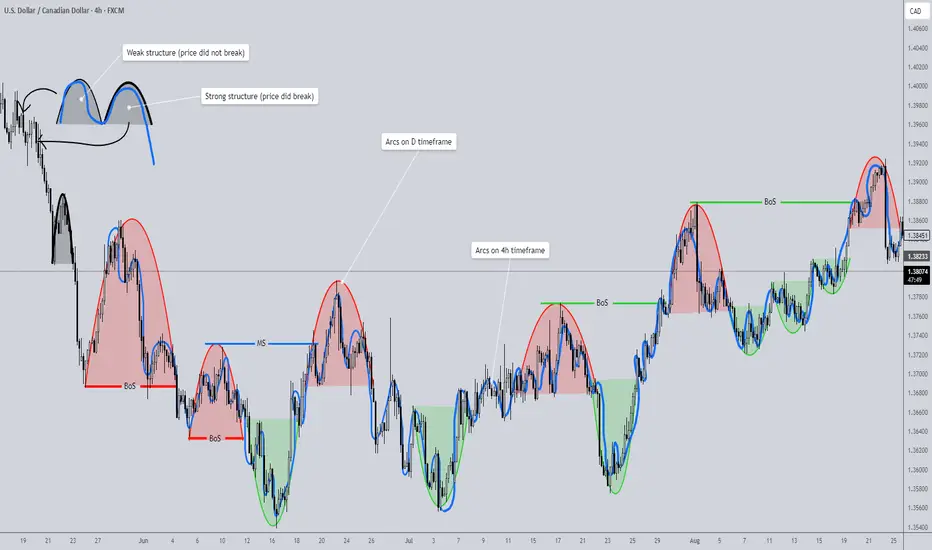
This is where things get surprisingly simple. To identify structure, look for arcs. Yes—the charting tool no one ever uses. An arc represents price dipping and then returning to its prior high or low.
• If price closes beyond the previous high/low, the structure is strong.
• If price fails to break the previous high/low and closes within it, the structure is weak.
That’s it. Look at the chart example provided—you’ll see how clear this becomes once you train your eye. The Red/Green arcs represent arcs that were identified on the D timeframe (HTF). The blue squiggly line represents a collection of arcs identified on the 4h timeframe (LTF).
Multi-Timeframe Power
Here’s where arcs become even more powerful. A structure on one timeframe (say, the 4H) is essentially a supply/demand zone. Drop down to a lower timeframe (4H → 1H), and that same structure becomes a full swing move. This allows you to navigate multiple timeframes seamlessly—simply by plotting structures on the higher timeframe.
The Arc as the Foundation
Once you learn to spot arcs, everything clicks into place. An arc is supply and demand. It is liquidity boundaries. It defines strong/weak highs and lows. It creates the zigzag. In short: structure identification is the only skill you need to master market structure—and it’s surprisingly quick to learn.
Additional Notes
• A valid arc requires at least three candles. Anything less is not structure.
• Two candles may represent a reaction to supply/demand or a liquidity sweep, but they don’t form a structure.
• Why? Because structure requires balance—a brief pause where price enters, slows, stabilizes, and then reverses. That balancing process cannot be captured in one or two candles.
My Advice
For now, set aside the broader concept of “market structure” and focus only on arcs.
1. Practice identifying arcs in live price action—don’t worry about backtesting yet.
2. Mark them on your chart, and classify them as strong or weak.
3. Once you’re comfortable spotting them, move into backtesting. Watch arcs unfold in motion.
4. With enough practice, you’ll be able to recognize them instantly and without hesitation.
That’s when you return to market structure as a whole. With the skill of arc recognition in place, you’ll finally see how everything ties together—and your understanding will be unshakable.
Previous Post; Complete Market Structure: Order Flow and Multiple Timeframes
Although I felt that this was a great take on market structure, the indicator provided falls short in a sense that market it relies on alternating internal shifts, when in market structure shifts can happen consecutively instead of strictly alternating. I have developed a different tool that will help identify structural levels without missing a single arc. It is called Supply/Demand Zones (Synthetic SMA Candles). I will provide a link below. It identifies arcs and classifies them as supply/demand zones. It also provides alerts which can be helpful if you are the type of trader that likes to trade passively without being glued to the charts.
Arc Identifying Indicator (Supply/Demand)
Global Soft Commodity Trading1. What Are Soft Commodities?
Soft commodities are agricultural products that are cultivated, harvested, and consumed globally. They are often seasonal, perishable, and dependent on climatic conditions. The main categories include:
Grains & Oilseeds
Wheat
Corn (maize)
Soybeans
Barley
Rice
Tropical Products
Coffee (Arabica, Robusta)
Cocoa
Sugar
Fibers
Cotton
Wool
Livestock & Others
Orange juice
Lumber
Dairy (in some markets)
These commodities are not only traded for consumption but also serve as raw materials for industries (e.g., cotton for textiles, soybeans for animal feed, sugar for ethanol production).
2. Historical Evolution of Soft Commodity Trading
Soft commodity trading is as old as civilization itself. The rise of agriculture allowed communities to specialize and trade surplus harvests for other goods. Some key historical milestones include:
Ancient Civilizations: Wheat and barley were traded in Mesopotamia, rice in Asia, and cotton in India and Egypt.
Medieval Period: The spice trade connected Asia to Europe, paving the way for global trading routes.
Colonial Era: European colonial powers exploited tropical regions for sugar, cotton, cocoa, and coffee plantations, fueling global demand.
Industrial Revolution: The textile boom drove massive cotton demand, while sugar and cocoa became staples in Western diets.
20th Century: Modern futures exchanges like the Chicago Board of Trade (CBOT) formalized grain trading, creating standardized contracts.
21st Century: Technology, globalization, and financialization have turned soft commodities into highly liquid and globally traded assets.
3. Key Global Soft Commodities and Their Markets
3.1 Coffee
Second most traded commodity after crude oil (by value).
Grown mainly in Brazil, Vietnam, Colombia, and Ethiopia.
Traded on ICE Futures U.S. (Intercontinental Exchange).
Prices are highly sensitive to weather, pests, and demand from developed countries.
3.2 Cocoa
Primary ingredient in chocolate.
Grown mainly in West Africa (Ivory Coast, Ghana), with smaller producers in Indonesia and Latin America.
Highly volatile due to labor conditions, political instability, and climate.
3.3 Cotton
Integral to the textile industry.
Major producers: India, China, USA, Pakistan.
Traded on ICE Cotton No.2 futures.
Sensitive to weather, pests, and industrial demand.
3.4 Sugar
Dual use: food consumption & biofuel (ethanol).
Brazil is the largest producer and exporter.
Weather patterns (El Niño/La Niña) impact global supply.
3.5 Grains (Wheat, Corn, Rice, Soybeans)
Staple foods for billions worldwide.
U.S., Russia, Ukraine, China, and India dominate production.
Corn is also used for livestock feed and biofuels.
Soybeans are critical for animal protein and vegetable oils.
4. Global Trading Hubs for Soft Commodities
Chicago Board of Trade (CBOT) – grains and oilseeds.
Intercontinental Exchange (ICE) – coffee, cocoa, cotton, sugar.
New York Mercantile Exchange (NYMEX) – certain agricultural futures.
Euronext (Paris) – milling wheat.
Multi Commodity Exchange (MCX) – India – cotton, sugar, and agricultural futures.
Dalian Commodity Exchange (DCE) – China – soybeans and related products.
These exchanges provide futures contracts that allow producers, traders, and investors to hedge risks and speculate on price movements.
5. Participants in Soft Commodity Trading
5.1 Producers
Farmers, cooperatives, and agricultural companies.
Seek to hedge against falling prices by selling futures contracts.
5.2 Consumers
Food companies, textile firms, and beverage manufacturers.
Hedge against rising input costs.
5.3 Traders
Middlemen who connect producers with consumers.
Examples: Cargill, Louis Dreyfus, Archer Daniels Midland (ADM), Bunge.
5.4 Speculators
Hedge funds, institutional investors, and retail traders.
Provide liquidity but increase volatility.
5.5 Governments
Regulate exports, impose subsidies, or control food inflation.
6. Trading Mechanisms
Soft commodities can be traded in several ways:
6.1 Spot Market
Immediate delivery at current prices.
Common for physical buyers like millers, roasters, or exporters.
6.2 Futures Contracts
Standardized contracts traded on exchanges.
Allow hedging and speculation. Example: CBOT Wheat Futures.
6.3 Options on Futures
Provide the right, not obligation, to buy/sell futures.
Used to manage risks.
6.4 Over-the-Counter (OTC) Contracts
Customized private agreements between parties.
6.5 ETFs & Indices
Investors can gain exposure without physical delivery.
Examples: Teucrium Wheat ETF, iPath Coffee ETN.
7. Factors Influencing Soft Commodity Prices
Weather & Climate
Droughts, floods, hurricanes, and frost can devastate harvests.
El Niño & La Niña cycles strongly impact global production.
Geopolitics
Wars (e.g., Russia-Ukraine conflict impacting wheat exports).
Trade policies, tariffs, and export bans.
Currency Movements
Commodities are priced in USD, so fluctuations in dollar value affect global prices.
Global Demand & Consumption Trends
Rising middle class in Asia → higher demand for coffee, chocolate, meat, and processed foods.
Health trends and biofuel demand shape consumption patterns.
Technology & Productivity
GMOs, irrigation, and fertilizers increase yields.
Mechanization reduces costs but can lead to oversupply.
Speculation & Financialization
Hedge funds and ETFs increase price swings.
8. Risks in Soft Commodity Trading
Price Volatility: Sudden weather events or political decisions can cause sharp movements.
Perishability: Storage costs and risks are higher than for hard commodities.
Market Manipulation: Concentrated players can distort prices.
Geopolitical Instability: African cocoa-producing nations often face coups or civil unrest.
Climate Change: Long-term risk as shifting patterns affect traditional growing regions.
9. Opportunities in Soft Commodity Trading
Portfolio Diversification: Provides a hedge against inflation.
High Liquidity: Futures markets are highly liquid, offering trading opportunities.
Emerging Market Demand: Rising populations in Asia and Africa drive demand growth.
Technological Advancements: AI, blockchain, and satellite monitoring improve forecasting and transparency.
Sustainable Investing: ESG-focused funds look at ethical sourcing of coffee, cocoa, and cotton.
10. Case Studies
10.1 Coffee Price Shock (2014)
Brazil’s drought severely reduced coffee output, leading to a 70% surge in Arabica prices. Traders who anticipated the weather-driven shortage made huge profits.
10.2 Cocoa Market (2020–2022)
Political instability in Ivory Coast and Ghana disrupted supply chains, while rising demand in Asia pushed prices higher.
10.3 Russia-Ukraine War (2022–2023)
Ukraine, a top wheat exporter, was blocked from shipping through Black Sea ports, causing a global food crisis. Futures spiked, and developing nations faced shortages.
Conclusion
Global soft commodity trading is a vital, dynamic, and complex part of the international economy. It touches everything from the morning coffee in your cup to the bread on your table and the cotton in your clothes. Unlike hard commodities, soft commodities are more unpredictable, influenced by weather, politics, and human consumption habits.
For investors and traders, soft commodities present both opportunities for profit and risks of volatility. For policymakers, they represent a tool of food security and geopolitical leverage. For producers, they are a lifeline tied to livelihoods and survival.
As climate change, technology, and shifting consumption patterns reshape the world, soft commodities will remain at the heart of global trade, shaping the balance between supply, demand, and sustainability.
Options Blueprint Series [Basic]: Gold Income or Bargain Entry?The Setup: A Pullback with a Plan
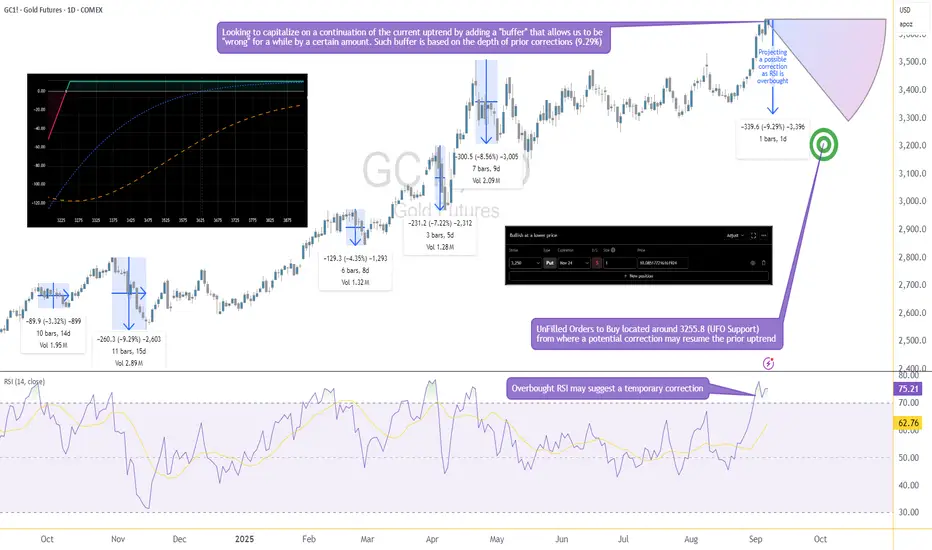
Gold has been riding a strong bullish wave, yet momentum indicators suggest it's time for a breather. RSI is now overbought, and if history repeats, we could see a healthy correction of up to 9.29%, in line with prior pullbacks. This projects price near 3255, where we also find a cluster of UnFilled Orders (UFOs) acting as a potentially relevant support. It’s a key price area where buyers may step in again.
Rather than try to perfectly time the correction or the bottom, we’re applying a more forgiving approach: selling a PUT far below current price—generating income while leaving room to be wrong by over 375 points.
This is not a hedge. This is a standalone income strategy that accepts risk but frames it intelligently using technical context and options structure.
The Strategy: Selling the 3250 PUT on GC
We're using a simple but powerful strategy—selling a naked PUT—which can generate income or result in ownership of Gold at a deep discount if price dips.
Underlying Asset: GCZ2025 – using Gold Futures Options (Nov 24 2025 Expiration)
Strategy: Sell 1x 3250 PUT
Premium Collected: 10.09 points ≈ $1,009
Breakeven Price: 3240
Max Profit: $1,009 (if Gold stays above 3250 until expiration)
Max Risk: Unlimited below breakeven
There are two possible outcomes here:
Gold stays above 3250 → we keep the full premium.
Gold drops below 3250 → we get assigned and become long GC at 3250. From there, we’re exposed to downside risk in Gold, with a breakeven at 3240.
The position benefits from time decay and stable to rising prices, but it does carry the full downside exposure of long Gold futures if the trade moves against us.
We want to be very clear here—this is a naked trade with undefined risk. That doesn’t make it reckless if done with sizing discipline and technical alignment, but it’s not a beginner-friendly strategy.
Gold Contract Specs
Understanding the size and risk of what you're trading is critical—especially with naked options.
✅ GC – Gold Futures (Full Size)
Symbol: GC
Contract Size: 100 troy ounces
Tick Size: 0.10 = $10
Point Value: 1 point = $100
Initial Margin (as of Sep 2025): ~$15,000 per contract (subject to change)
Underlying for the Option: GC Futures
✅ MGC – Micro Gold Futures
Symbol: MGC
Contract Size: 10 troy ounces
Tick Size: 0.10 = $1
Point Value: 1 point = $10
Initial Margin: ~$1,500 per contract (subject to change)
Why does this matter?
Because if GC collapses below 3250 and you're assigned long, you’ll be exposed to full-size futures. That’s $100 per point of movement. A 50-point drop? That's $5,000 in unrealized loss.
That’s where MGC becomes your best ally. Micro Gold futures offer a scalable way to hedge. If price begins moving down or breaks below the support zone, one could short MGC against the Short GC 3250 PUT to cap further losses or rebalance directional exposure with reduced size and margin impact.
The Technical Confluence: Where Structure Meets Strategy
The 3250 strike isn’t just a random number—it’s calculated. Historical RSI-based corrections in Gold have shown recent worse-case scenarios around 9.29%, and projecting that from recent highs lands us precisely near the 3255 zone. This level also aligns with a clear UFO support, where institutional buyers have likely left behind unfilled orders.
That confluence—statistical retracement, technical indicator, and order flow support—gives the 3250 strike an interesting probability structure. Selling a Put beneath it means we are placing our bet below the “floor” and getting paid while we wait.
If Gold never corrects that far, we profit.
If it does, we might get long near a historically meaningful level.
There’s no need to catch the top. There’s no need to nail the bottom.
Just structure the trade where the odds are already potentially skewed in your favor.
Trade Plan: Reward, Risk & Realism
This trade isn’t about precision entry or leveraged glory—it’s about risk-defined logic with a cash-flow twist. Here's the full breakdown:
🧠 Trade Parameters
Strategy: Sell 1x Gold Futures 3250 PUT Options
Premium Collected: 10.09 points = $1,009
Point Value (GC): $100/point
Breakeven Price: 3240 (3250 – 10)
Expiration: Nov 24, 2025
🟩 If Gold Stays Above 3250
You keep the full premium → $1,009 profit
🟥 If Gold Falls Below 3250
You may be assigned 1 GC contra<ct long at 3250
Unrealized losses begin below breakeven (3240)
Losses can be significant if Gold falls aggressively
⚠️ Reward-to-Risk?
Reward is capped at $1,009
Risk is unlimited below breakeven
The trade only makes sense if you're prepared to own Gold, or hedge dynamically via MGC or using any other technique
This isn’t a “set-and-forget” income play—it’s a calculated entry into a structured exposure with a fallback plan.
Risk Management: No Margin for Error
Selling naked options isn’t “free money.” It’s responsibility wrapped in premium. Here's what must be considered:
❗ Undefined Risk
When you sell a naked PUT, you're exposed to the full downside. If Gold drops $100 below your strike, that’s a $10,000 loss. Don’t sell naked options unless you’re ready—and capitalized—to buy the underlying or actively hedge it.
🔄 Use MGC to Hedge
If Gold breaks below 3250, using Micro Gold Futures (MGC) offers a surgical way to hedge risk without overleveraging. A simple short MGC can offset GC losses proportionally, depending on how aggressive the move becomes.
🧮 Precision Matters
Avoid entering trades too early or too large.
Place an “invalidation” point: if price violates the support zone with conviction, reduce or hedge exposure.
Never sell premium just because it’s “high”—sell where structure backs the trade.
📊 Discipline Trumps Direction
This strategy is valid only if risk is respected. The market doesn’t owe anyone consistency—but a structured, risk-controlled approach keeps you in the game long enough to see it.
When charting futures, the data provided could be delayed. Traders working with the ticker symbols discussed in this idea may prefer to use CME Group real-time data plan on TradingView: www.tradingview.com - This consideration is particularly important for shorter-term traders, whereas it may be less critical for those focused on longer-term trading strategies.
General Disclaimer:
The trade ideas presented herein are solely for illustrative purposes forming a part of a case study intended to demonstrate key principles in risk management within the context of the specific market scenarios discussed. These ideas are not to be interpreted as investment recommendations or financial advice. They do not endorse or promote any specific trading strategies, financial products, or services. The information provided is based on data believed to be reliable; however, its accuracy or completeness cannot be guaranteed. Trading in financial markets involves risks, including the potential loss of principal. Each individual should conduct their own research and consult with professional financial advisors before making any investment decisions. The author or publisher of this content bears no responsibility for any actions taken based on the information provided or for any resultant financial or other losses.
Diversification in Practice: My Approach to MarketsThe big project for me at the moment is finding ways to diversify.
Ray Dalio calls diversification the holy grail of investing, and I tend to agree.
If you put the numbers in a volatility formula you will find that going from 1 investment to 8 ones with 20% correlation divides volatility by 2, and going from 1 to 20 with 5% correlation divides volatility by 3.
So diversification could in theory double to triple risk-adjusted returns. To help visualise what this means:
Starting with 10k and making 15% a year for 10 years results in having 40k;
Starting with 10k and making 45% a year for 10 years results in having 410k.
Of course in practice it is not realistic to expect to find that many profit sources with such low correlation.
💰 Asset classes I am focussing on
Even though I am looking to diversify, I will, at least for the time being, only focus on Forex, commodities and a little bit indices.
Forex and Commodities: They have their differences, FX retraces much more than commodities, but in many ways they are similar. They are great for speculating over a few weeks, something I personally favor.
Indices: I rarely trade them, but I did spend a lot of time studying them, and feel comfortable trading them the same way I trade the EUR/USD or gold.
The reasons for ignoring Bonds, cryptos and shares:
- Cryptos and shares behave significantly differently,
- The timeframes are different,
- Stocks gap so much and anyway are highly correlated to the S&P500
- I do not think it would add much to my portfolio, volatility would be the same
💰 Improvements I have made to my diversification
I was able to add some instruments and reduce my exposure to the USD from 33% to 25% on average.
Keep in mind that over small periods exposure can go above the average as I get so many signals.
I went through a period of 1-2 months where 50% of my activity was on the USD, with intraday swings wiping out weeks of progress (it can get close to target then do a 70% retrace to entry in a few hours).
I improved my diversification but it is still not enough. The Euro still amounts to 22% of my activity, and the Yen 18%, everything else is below 12% which is acceptable.
I added several east asian currencies to the watchlist. I had not thought of it but Yen, Yuan and SGD pairs are actually not that expensive, liquid, and trend just like the rest.
I also increased exposure to commodities I already invest in, I added gold and silver quoted in currencies other than USD, as well as Brent Oil (on top of CL1! I have been trading for years).
💰 Other instruments I might consider later on
I could look at extra commodities, ag ones I don't already trade, something like Lumber, Rice or Orange Juice; as well as metals traded on the London Metal Exchange, such as Nickel, Zinc, Aluminum and Lead.
I do not think there is much more I can do with Forex, there is no point trading ultra exotic pairs such as PLN/CZK where the spread is going to be huge, and who knows what could go wrong.
Other than those few examples I mentionned I do not have any other ideas.
If I could reduce my expose to the USD to 20% that would be great. I do not think I can push it further than this.
Do you think I am wrong to ignore some asset classes? Do you know about LME metals and think they are great/terrible? Please let me know dear colleagues.

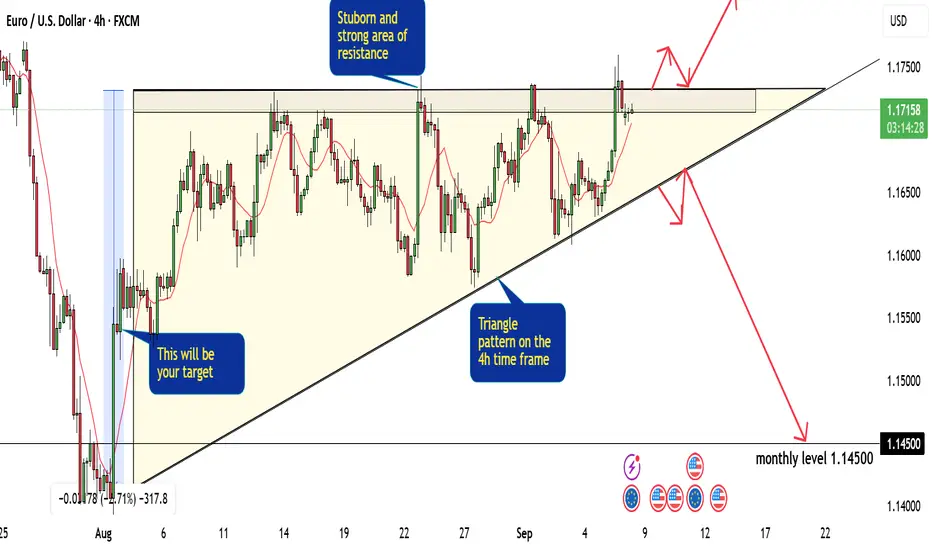
Tips And Trick On How to Trade The Flag Pattern With Perfection!Hey Everyone, in this chart we have a very clear pattern FLAG on the 4H timeframe and on the 1h timeframe. this pattern consists of three sides:
1- the trend line side:
if this side is broken then we will have to wait for a nice retest and then enter our trade which will be in the opposite direction of the trendline ( in our EURUSD it will be a sell trade).
2- the resistance area:
it is a very strong area that pushes the price very hard to the downside, once this area is broken we can enter an easy buy trade directly or we can wait for a good confirmation and a nice retest for the area.
3- the target side :
in most of the chart patterns these patterns gives you an indication of the amount of pips you are waiting for. the third side of the FLAG pattern is actually your target for the trade, try to take between 20 to 50 pips less than what is showed on this side.
so as a conclusion of the EURUSD analysis we are waiting for a good break to the trendline or the resistance area and then we can determine what our next step and if we will enter a buy or sell trade
Scalping in World Markets1. What is Scalping?
Scalping is a short-term trading style where traders aim to profit from small price fluctuations, typically a few pips in forex, a few cents in stocks, or a few ticks in futures. The average trade duration is extremely short – from a few seconds to a few minutes.
Key characteristics of scalping:
High trade frequency – dozens or even hundreds of trades per day.
Small profit targets – usually 0.1% to 0.5% of price movement.
Tight stop-losses – risk is controlled aggressively.
High leverage usage – to magnify small gains.
Dependence on liquidity and volatility – scalpers thrive in active markets.
2. Scalping in Different World Markets
2.1 Forex Market
The forex market is the most popular for scalping because of its 24/5 availability, tight spreads, and deep liquidity.
Major currency pairs (EUR/USD, GBP/USD, USD/JPY) are preferred for scalping due to minimal spreads.
Forex scalpers often use 1-minute and 5-minute charts to identify quick opportunities.
2.2 Stock Market
Scalping in equities focuses on high-volume stocks like Apple, Tesla, or Amazon.
Traders benefit from intraday volatility and liquidity during opening and closing market hours.
Access to Level 2 order book and Direct Market Access (DMA) is crucial for equity scalpers.
2.3 Futures and Commodities
Futures contracts like S&P 500 E-mini, crude oil, and gold are attractive for scalpers.
Commodity scalping requires understanding of economic reports (EIA crude oil inventory, OPEC meetings).
2.4 Cryptocurrencies
Crypto markets are 24/7, offering endless scalping opportunities.
High volatility and liquidity in coins like Bitcoin and Ethereum make them ideal.
However, high transaction fees and slippage can erode profits.
2.5 Global Indices
Scalpers often trade indices like Dow Jones, FTSE 100, DAX, and Nikkei 225.
Indices react quickly to macroeconomic data, providing fast scalping opportunities.
3. Scalping Strategies in World Markets
3.1 Market Making
Involves placing simultaneous buy and sell orders to profit from the bid-ask spread.
Works best in highly liquid instruments.
3.2 Momentum Scalping
Traders ride micro-trends by entering when momentum surges (e.g., after a breakout).
Useful in fast-moving markets like NASDAQ or forex majors.
3.3 Range Scalping
Scalpers trade within tight support and resistance zones.
Buy near support and sell near resistance repeatedly.
3.4 News-Based Scalping
Focuses on volatility caused by economic releases (CPI, NFP, Fed announcements).
High risk but high reward.
3.5 Algorithmic Scalping
Uses bots to execute trades automatically within milliseconds.
Common in institutional trading with access to co-location servers.
4. Tools and Techniques for Scalping
Trading Platforms – MT4/MT5, NinjaTrader, Thinkorswim, Interactive Brokers.
Charts & Timeframes – 1-minute, 5-minute, tick charts, and order flow charts.
Indicators:
Moving Averages (EMA 9, EMA 21)
Bollinger Bands
RSI (1 or 5 period)
VWAP (Volume Weighted Average Price)
Order Book & Level 2 Data – Helps scalpers see liquidity depth.
Hotkeys & Fast Execution – Essential for entering/exiting trades within seconds.
5. Risk Management in Scalping
Scalping is high-risk due to the large number of trades and leverage. Key risk controls include:
Stop-loss orders – Protect from large losses when price moves unexpectedly.
Position sizing – Never risk more than 1% of account per trade.
Spread & commissions – Monitor closely, as these eat into small profits.
Discipline – Avoid overtrading and revenge trading.
6. Advantages of Scalping
Quick Profits – Immediate feedback from trades.
Less exposure to overnight risk – No swing or position holding.
Works in all market conditions – Volatile, range-bound, or trending.
Compounding effect – Small profits add up across multiple trades.
Psychological satisfaction – For traders who like constant engagement.
7. Challenges of Scalping
High Stress – Requires constant focus and fast decision-making.
Costs – Commissions, spreads, and slippage reduce profitability.
Execution speed – Any delay can wipe out gains.
Broker restrictions – Some brokers prohibit or limit scalping.
Psychological fatigue – Scalping can be mentally exhausting.
8. Psychology of a Scalper
Scalping is not just about technical skills; it demands the right mindset:
Patience and discipline – Avoid chasing trades.
Emotional control – Handle stress and avoid panic decisions.
Consistency – Stick to predefined strategies.
Focus – Ability to concentrate for hours without distraction.
9. Regulations and Global Differences
US Markets: FINRA requires $25,000 minimum for pattern day trading in equities.
European Markets: MiFID II rules on leverage (max 1:30 for retail).
Asian Markets: Japan and Singapore allow high-frequency scalping, but require licensing for institutional scalpers.
Forex Brokers: Some brokers discourage scalping due to server load.
Best Practices for Successful Scalping
Focus on liquid assets.
Keep a trading journal.
Test strategies on demo accounts.
Control emotions and avoid overtrading.
Use technology for execution speed.
Conclusion
Scalping in world markets is one of the most challenging yet rewarding trading approaches. It requires discipline, speed, and precision to consistently extract profits from tiny market movements. While technology and globalization have made scalping more accessible, only traders with the right psychology, tools, and risk management can succeed.
As markets evolve with AI, crypto, and faster infrastructures, scalping will continue to be a dominant force in global trading. For traders who thrive under pressure and enjoy high-frequency engagement, scalping offers unparalleled opportunities – but it demands mastery of both strategy and self-control.

Forward & Futures Forex TradingChapter 1: Basics of Forex Derivatives
1.1 What are Forex Derivatives?
A derivative is a financial instrument whose value depends on the price of an underlying asset. In forex, derivatives derive their value from currency exchange rates.
Common forex derivatives include:
Forwards – customized OTC contracts.
Futures – standardized exchange-traded contracts.
Options – rights but not obligations to exchange currencies.
Swaps – agreements to exchange cash flows in different currencies.
1.2 Why Use Forex Derivatives?
Hedging: To protect against adverse currency movements.
Speculation: To profit from expected exchange rate movements.
Arbitrage: To exploit price discrepancies across markets.
Chapter 2: Forward Forex Contracts
2.1 What is a Forward Contract?
A forward contract is a private agreement between two parties to buy or sell a specified amount of currency at a predetermined exchange rate on a future date.
Example:
A U.S. importer agrees today to buy €1 million from a bank in three months at an agreed exchange rate of 1.10 USD/EUR. Regardless of the spot rate in three months, the importer must pay at that rate.
2.2 Key Features of Forward Contracts
Customization: Amount, maturity date, and settlement terms are negotiable.
Over-the-Counter (OTC): Not traded on exchanges, but arranged between banks, institutions, and corporations.
Obligation: Both buyer and seller are bound to fulfill the contract.
No upfront payment: Typically requires no premium, though banks may ask for collateral.
2.3 Types of Forward Contracts
Outright Forward – standard agreement for a fixed amount and date.
Flexible Forward – allows settlement within a range of dates.
Non-Deliverable Forward (NDF) – cash-settled in one currency, often used for restricted currencies (e.g., INR, CNY).
Window Forward – permits multiple drawdowns during a period.
2.4 Participants in Forward Contracts
Corporations – hedge imports/exports.
Banks – provide liquidity and quotes.
Hedge Funds – speculate on currency movements.
Central Banks – occasionally use forwards to manage reserves.
Chapter 3: Forex Futures
3.1 What are Futures Contracts?
A forex futures contract is a standardized agreement traded on an exchange to buy or sell a currency at a predetermined price on a specified future date.
Example:
A trader buys a EUR/USD futures contract expiring in December at 1.1050. If the euro strengthens, the futures price rises, and the trader profits by selling the contract later.
3.2 Key Features of Futures Contracts
Standardization: Contract size, maturity, and tick value are fixed by the exchange.
Exchange-Traded: Offered on platforms like CME (Chicago Mercantile Exchange).
Daily Settlement: Marked-to-market each day, with gains/losses credited/debited.
Margin Requirement: Traders must deposit initial and maintenance margins.
Liquidity: High in major currency pairs like EUR/USD, GBP/USD, and JPY/USD.
3.3 Common Forex Futures Contracts
EUR/USD futures
GBP/USD futures
JPY/USD futures
AUD/USD futures
Emerging market currency futures (less liquid but growing).
3.4 Participants in Futures Contracts
Speculators – retail and institutional traders betting on price moves.
Hedgers – corporations, exporters, and importers.
Arbitrageurs – exploit mispricing between spot, forward, and futures.
Chapter 4: Forwards vs Futures – Key Differences
Feature Forwards Futures
Market OTC (private contracts) Exchange-traded
Standardization Fully customized Standard contract sizes/dates
Settlement On maturity Daily mark-to-market
Counterparty Risk Higher (depends on bank/party) Low (exchange clearinghouse guarantees)
Liquidity Varies by bank relationship High in major pairs
Flexibility High Low
Usage Hedging (corporates) Hedging & speculation (traders/investors)
Chapter 5: Pricing and Valuation
5.1 Forward Pricing Formula
Forward exchange rate = Spot rate × (1 + interest rate of base currency) / (1 + interest rate of quote currency).
Example:
Spot EUR/USD = 1.1000
USD interest rate = 5% p.a.
EUR interest rate = 3% p.a.
1-year forward = 1.1000 × (1.05 / 1.03) ≈ 1.1214
5.2 Futures Pricing
Futures pricing is similar but adjusted for:
Daily settlement (mark-to-market).
Exchange trading costs.
Slight deviations from theoretical parity due to liquidity.
Chapter 6: Strategies with Forwards & Futures
6.1 Hedging Strategies
Importer Hedge: Lock in forward rate to avoid rising costs.
Exporter Hedge: Lock in forward to protect against falling revenues.
Futures Hedge: Use standardized contracts to offset exposure.
6.2 Speculation Strategies
Directional Trades: Bet on EUR/USD rising or falling using futures.
Carry Trade via Forwards: Exploit interest rate differentials.
Spread Trading: Trade differences between spot and futures.
6.3 Arbitrage Opportunities
Covered Interest Arbitrage: Lock in risk-free profits by exploiting discrepancies between forward rates and interest rate differentials.
Cash-and-Carry Arbitrage: Use spot and futures price mismatches.
Chapter 7: Risks in Forward & Futures Trading
7.1 Risks in Forwards
Counterparty Risk – the other party may default.
Liquidity Risk – difficult to unwind before maturity.
Regulation Risk – OTC contracts less transparent.
7.2 Risks in Futures
Margin Calls – sudden volatility can wipe out traders.
Leverage Risk – high leverage amplifies losses.
Market Risk – currency volatility due to geopolitical or economic shocks.
Chapter 8: Real-World Applications
8.1 Corporate Hedging Example
Airline Company: A U.S. airline buying aircraft from Europe may use a forward to lock in EUR/USD exchange rate for payment due in six months.
8.2 Speculator Example
Futures Trader: A hedge fund expects USD to weaken against EUR and buys EUR/USD futures contracts. If EUR rises, profits are made without ever handling physical currency.
8.3 Emerging Market Case
Indian IT Exporter: Uses USD/INR forward contracts to protect revenue from U.S. clients.
Chapter 9: Regulatory Environment
Forwards: Governed by ISDA agreements in OTC markets.
Futures: Regulated by exchanges (CME, ICE) and oversight bodies (CFTC in the U.S., ESMA in Europe).
Basel III Framework: Requires banks to hold capital for counterparty risks in derivatives.
Chapter 10: The Future of Forward & Futures Forex Trading
Digitalization: Rise of electronic platforms for forward trading.
Crypto Futures: Growing demand for crypto/forex hybrid products.
AI & Algo Trading: Automated strategies dominating futures markets.
Emerging Market Growth: Increasing use of forwards in Asia and Latin America.
Conclusion
Forward and futures forex contracts are cornerstones of global currency trading, serving hedgers, speculators, and arbitrageurs alike.
Forwards provide customized, flexible solutions for corporations to hedge currency risk.
Futures offer standardized, liquid, and transparent trading instruments for both hedging and speculation.
Both carry risks—from counterparty risk in forwards to leverage and margin risks in futures—but they remain indispensable tools in managing the uncertainties of currency markets.
In today’s interconnected economy, where exchange rate volatility is influenced by central bank policies, geopolitical events, and global trade flows, forward and futures forex trading will continue to be critical for risk management and investment strategies worldwide.
ICT CONCEPTS BLENDED W/SUPPORT AND RESISTANCE_SELLOn the weekly and Daily timeframes the next market move is not clear, following the trend we're bullish, but there is also a higher timeframe resistance has been met creating a higher high around the 45,774.20 level, and a move to the sell side is very possible, along with recent news events.

DOLLAR INDEX (DXY)...one of the most important tools for a tradeHello TradingView community! Joseph here, just wanted to share some nuggets on the Dollar Index and how it has helped me in my personal trading and profitability in the markets.
In the video I go over
1. The significance of the USD in the markets
2. How using the USD index is necessary for correlation (multi-asset even)
3. How to use the USD index to help better time your own trades in the markets
So sit back, grab your notebook and take some notes because this information WILL help give you an immediate higher chance of success if applied!! Thanks for watching please boost/comment/follow my page for more trading nuggets!
Cheers!

Volume Profile Explained with Application BTC Forecast09/09/2025Price isn’t held up by your tweets — it’s held up by volume. And volume says lower.
By walking through the profile step by step, I explain how:
The thick high-volume nodes act as magnets for price.
The thin low-volume zones provide little support and often get filled quickly.
Bitcoin’s current setup suggests price is more likely to retrace lower to retest the areas where most of the trading volume occurred.
If you’ve ever wondered how to connect the dots between the volume profile and the order book, or why market structure points down when everyone else says up

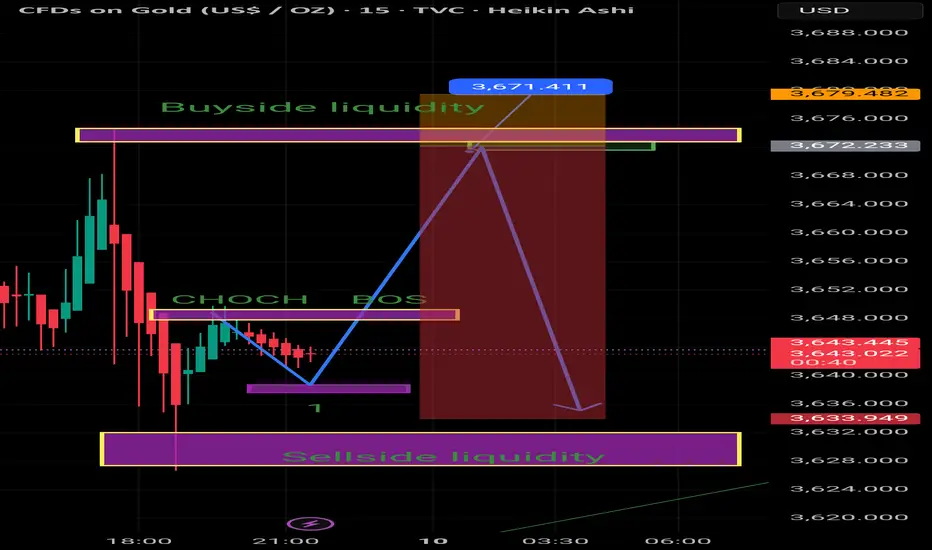
Scalping 15min TF Here is last update of scalp strategies with Fibonacci retracement point and buyside liquidity and sellside liquidity format
Key levels mentioned on published ideas .
How to Use Moving Averages in TradingViewMaster moving averages using TradingView's charting tools in this comprehensive tutorial from Optimus Futures.
Moving averages are among the most versatile technical analysis tools available, helping traders analyze trends, identify overbought/oversold conditions, and create tradeable support and resistance levels.
What You'll Learn:
Understanding moving averages: lagging indicators with multiple applications
Simple moving average basics: calculating price averages over set periods
Key configuration choices: lookback periods, price inputs, and timeframes
How to select optimal lookback periods (like 200-day) for different trading styles
Using different price inputs: close, open, high, or low prices
Applying moving averages across all timeframes from daily to 5-minute charts
Analyzing price relative to moving averages for trend identification
Using 50-day and 200-day moving averages for trend analysis on E-Mini S&P 500
Mean reversion trading: how price tends to return to moving averages
Trend direction analysis using moving average slopes
Famous crossover signals: "Death Cross" and "Golden Cross" explained
Trading moving averages as dynamic support and resistance levels
Advanced moving average types: weighted and exponential moving averages
Applying moving averages to other indicators like MACD and Stochastics
Balancing sensitivity vs. noise when choosing periods
This tutorial may benefit futures traders, swing traders, and technical analysts who want to incorporate moving averages into their trading strategies.
The concepts covered could help you identify trend direction, potential reversal points, and dynamic trading levels across multiple timeframes.
Learn more about futures trading with TradingView:
optimusfutures.com
Disclaimer:
There is a substantial risk of loss in futures trading. Past performance is not indicative of future results. Please trade only with risk capital. We are not responsible for any third-party links, comments, or content shared on TradingView. Any opinions, links, or messages posted by users on TradingView do not represent our views or recommendations. Please exercise your own judgment and due diligence when engaging with any external content or user commentary.
This video represents the opinion of Optimus Futures and is intended for educational purposes only. Chart interpretations are presented solely to illustrate objective technical concepts and should not be viewed as predictive of future market behavior. In our opinion, charts are analytical tools—not forecasting

EURCHF Full Top Down Analysis,Weekly - 1' Q3 W37 D9 Y25EURCHF Full Top Down Analysis,Weekly - 1' Q3 W37 D9 Y25
Full EURCHF ANALYSIS

The #1 Trading Skill: Controlling Your RiskThe secret to trading isn’t winning every trade - it’s about managing risk.
Risk management and trading. This is one of the most important topics if you’re
serious about becoming a profitable trader. Risk management is the foundation of trading. If
you don’t manage your risk you won’t make it. Simple as that.
No one can predict whether the market will go up or down with 100%
certainty. That’s why as traders we can never fully control how much profit we make. But we
can control one thing. How much we lose. And that brings us to the first step in risk
management. Understanding the power of the risk-reward ratio.
When choosing a trading strategy that suits you one of the factors to consider is its risk-reward
ratio. Every strategy has its own balance between risk and potential reward and understanding
this is key. This is where we need to put our math brains to work.
What is the risk-reward ratio? Simply put it tells us how much we stand to gain for every unit
of risk we take. It’s a straightforward but powerful metric that helps determine whether a
strategy can be profitable over time.
Let’s break it down with a simple example:
• If your strategy has a 1:1 risk-reward ratio it means that for every $100 you risk you
aim to make $100 in profit. Win or lose the potential gain and loss are the same.
• If your strategy has a 1:2 risk-reward ratio you risk losing $100, but if the trade goes
your way you make $200. This means your potential reward is twice as big as your risk.
• If your strategy has a 1:5 risk-reward ratio for every $100 you risk you have the
chance to make $500. Here the possible reward is much greater than the risk you take.
Your risk-reward ratio has a big impact on your overall profitability. But the risk-reward ratio
alone doesn’t tell the full story. To know if a strategy is truly profitable you also need to
consider another key factor: Win rate.
Your win rate is the percentage of trades that end in profit. This is where math and probabilities come into play.
• If your strategy has a 50% win rate it means that out of 10 trades 5 are winners and 5
are losers.
• If your win rate is 40% 4 out of 10 trades will be profitable.
The key to long-term success is finding the right balance between risk-reward and win rate.
• If you have a 1:1 risk-reward ratio and a 40% win rate your strategy won’t be
profitable. Over 10 trades you win 4 times and lose 6 times. Since you win and lose the
same amount per trade your losses will be bigger than your gains in the long run.
• But with a 1:5 risk-reward ratio and the same 40% win rate your strategy becomes
profitable. That’s because your winning trades make far more than you lose on your
losing trades.
The takeaway? There’s no such thing as a right or wrong strategy only ones that are profitable
or unprofitable. The key is to find a strategy that gives you a mathematical edge over time.
Global Market Participants1. Classification of Global Market Participants
Global market participants can broadly be divided into the following categories:
Sovereign and Supranational Institutions
Central Banks
Governments and Sovereign Wealth Funds
Multilateral Organizations (IMF, World Bank, WTO)
Institutional Investors
Pension Funds
Insurance Companies
Mutual Funds and ETFs
Hedge Funds
Private Equity and Venture Capital
Market Intermediaries
Investment Banks
Brokerage Firms
Clearing Houses and Exchanges
Corporate Participants
Multinational Corporations (MNCs)
Exporters and Importers
Commodity Producers
Retail Participants
Individual Investors
High-Net-Worth Individuals (HNIs)
Retail Traders
Other Specialized Players
Algorithmic and High-Frequency Traders
Credit Rating Agencies
Regulatory Authorities
2. Sovereign and Supranational Institutions
2.1 Central Banks
Central banks such as the U.S. Federal Reserve, the European Central Bank (ECB), and the Reserve Bank of India are among the most powerful market participants. Their main functions include:
Monetary Policy: Adjusting interest rates and controlling money supply.
Foreign Exchange Interventions: Stabilizing or influencing currency exchange rates.
Market Stability: Acting as lenders of last resort during financial crises.
Example: When the Federal Reserve raises interest rates, global investors reallocate capital toward U.S. assets, strengthening the dollar and affecting equity and bond markets worldwide.
2.2 Governments and Sovereign Wealth Funds
Governments participate in markets through:
Issuing government bonds to fund fiscal deficits.
Establishing sovereign wealth funds (SWFs) to invest surplus revenues, often from natural resources like oil.
Engaging in trade agreements that influence global commerce.
Examples:
Norway’s Government Pension Fund Global is one of the world’s largest SWFs.
Japan issues large amounts of government debt, making its bond market a global benchmark.
2.3 Multilateral Organizations
Institutions like the IMF, World Bank, and WTO play stabilizing roles:
IMF provides emergency funding to countries facing balance-of-payment crises.
World Bank funds infrastructure projects that stimulate global trade.
WTO regulates international trade to ensure fair practices.
3. Institutional Investors
3.1 Pension Funds
Pension funds manage retirement savings for millions of workers. They are long-term investors and major players in equity, bond, and real estate markets.
Example: The California Public Employees’ Retirement System (CalPERS) manages over $400 billion.
Impact: Pension funds provide stability since their investment horizon spans decades.
3.2 Insurance Companies
Insurance companies collect premiums and invest them to generate returns before claims are paid out. They are significant participants in bond and fixed-income markets because of their need for stable cash flows.
3.3 Mutual Funds and ETFs
Mutual funds pool money from investors to buy diversified portfolios.
ETFs (Exchange-Traded Funds) have become popular for their low fees and ability to track indices.
Their collective influence is massive, often moving markets based on inflows and redemptions.
3.4 Hedge Funds
Hedge funds use aggressive strategies (short-selling, leverage, derivatives) to achieve high returns. They are often criticized for market volatility but also praised for market efficiency.
3.5 Private Equity and Venture Capital
Private Equity (PE): Acquires and restructures established companies.
Venture Capital (VC): Invests in early-stage startups, fueling innovation.
These funds play a crucial role in business expansion and technological progress.
4. Market Intermediaries
4.1 Investment Banks
Investment banks such as Goldman Sachs, Morgan Stanley, and JPMorgan act as intermediaries between corporations and capital markets. Their roles include:
Underwriting IPOs and bond issues.
Advising on mergers and acquisitions (M&A).
Facilitating large trades for institutional clients.
4.2 Brokerage Firms
Brokerages connect retail and institutional investors to markets. They earn through commissions, spreads, or subscription models.
4.3 Clearing Houses and Exchanges
Stock exchanges (NYSE, NASDAQ, LSE) provide platforms for trading securities.
Clearing houses ensure smooth settlement and reduce counterparty risk.
5. Corporate Participants
5.1 Multinational Corporations (MNCs)
MNCs such as Apple, Toyota, and Reliance Industries are active participants in currency, equity, and bond markets. They hedge risks using derivatives and issue corporate bonds to raise capital.
5.2 Exporters and Importers
Global trade participants engage in hedging to protect against currency fluctuations. For example, an Indian exporter to the U.S. may hedge against USD/INR volatility.
5.3 Commodity Producers
Oil companies, mining firms, and agricultural producers are vital to commodity markets. They hedge using futures contracts to protect against price swings.
6. Retail Participants
6.1 Individual Investors
Retail investors trade in stocks, bonds, mutual funds, and cryptocurrencies. With the rise of fintech platforms, their participation has grown exponentially.
6.2 High-Net-Worth Individuals (HNIs)
HNIs use private banking services for wealth management, often investing in alternative assets like real estate, art, and private equity.
6.3 Retail Traders
Short-term traders focus on daily or intraday movements. With online platforms, they contribute significantly to trading volumes, especially in equities and forex.
7. Specialized Players
7.1 Algorithmic and High-Frequency Traders
These participants use complex algorithms to execute trades within microseconds. While they enhance liquidity, they also raise concerns about “flash crashes.”
7.2 Credit Rating Agencies
Agencies like S&P, Moody’s, and Fitch evaluate creditworthiness. Their ratings influence borrowing costs for governments and corporations.
7.3 Regulatory Authorities
Regulators such as SEBI (India), SEC (U.S.), and ESMA (EU) oversee markets to protect investors, maintain fairness, and reduce systemic risks.
8. Interactions Among Participants
Markets function as ecosystems where participants are interdependent:
Retail investors provide liquidity.
Institutional investors drive long-term capital flows.
Central banks set the tone with monetary policy.
Corporates raise funds and provide underlying assets.
Example: During COVID-19, central banks provided liquidity, governments issued bonds, institutional investors allocated capital, and retail investors entered markets in record numbers.
9. Challenges for Global Market Participants
Geopolitical Risks – Wars, sanctions, and trade conflicts disrupt markets.
Technological Disruptions – AI trading, blockchain, and cybersecurity risks.
Regulatory Changes – Increased scrutiny on hedge funds and cryptocurrencies.
Environmental, Social, and Governance (ESG) – Pressure to adopt sustainable investment practices.
Market Volatility – Rising due to global interconnection and speed of information.
10. Opportunities in Global Markets
Emerging Markets: Offer higher growth potential despite risks.
Digital Assets: Cryptocurrencies, tokenized securities, and DeFi.
Sustainable Finance: Green bonds and ESG-focused investments.
Cross-Border Investments: Enhanced by globalization and technology.
Conclusion
Global market participants form a complex web where each plays a unique role in shaping financial markets. From central banks and sovereign funds to retail investors and algorithmic traders, their collective actions determine the flow of capital, the allocation of resources, and the stability of economies.
In an era of globalization, digitization, and sustainability, market participants must adapt to changing conditions while maintaining the delicate balance between risk and opportunity. Understanding their functions and interactions is essential for grasping the mechanics of global finance and preparing for the future of markets.