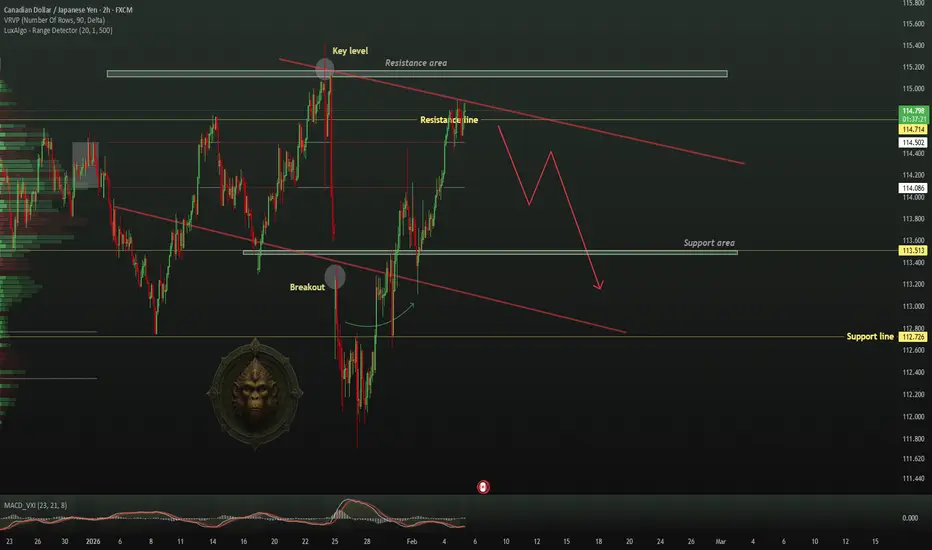
TheGrove | CADJPY Sell | Idea Trading AnalysisYou can expect a reaction in the direction of selling from the specified Resistance area
CADJPY moving higher as it tests the strong resistance level..
We expect a bearish move from the confluence zone.
Hello Traders, here is the full analysis.
I think we can soon see more fall from this range! GOOD LUCK! Great SELL opportunity CADJPY
I still did my best and this is the most likely count for me at the moment.
-------------------
Traders, if you liked this idea or if you have your own opinion about it, write in the comments. I will be glad 🤝
Community ideas
The Bitcoin Bottom Indicator (BBI) signaled a macro bottom!The BBI has triggered a bottom on Bitcoin. The first trigger since January 2023. The overall risk is not quite at bottom levels yet (based mainly on the calendar seasonality indicators), but four of the eleven individual indicators have triggered. Two of the other individual indicators (the MVRVZ and the PUELL) are very close to triggering as well. In the past the BBI has delivered a string of triggers at the bottom ranges, so there should be time to build confluence.
--Da_Prof

The Graph · Moves within opportunity buy-zone —Easy 686% PPThe "extreme opportunity buy-zone," do you agree?
Good afternoon my fellow Cryptocurrency trader and good weekend, I hope you are doing good today.
How is the market treating you?
Everything is happening now, just now, right now... We are witnessing the start of a much anticipated and awaited bullish wave.
How long will it last?
We've been here many times before.
Can I do good this time around?
Will I be able to profit big?
Will I hold beyond the bullish wave?
Questions and answers... It all depends on your strategy of course.
If you take the time to plan now, you can do awesome my friend. We can all do the great. The market gives, the market takes.
You can set your take profits target and once the level is hit never look back.
"But what if prices continue rising after I sell?"
What about it? Aren't you happy with 100%-200%?
What if prices start dropping and continue down for six months? What then?
It is better to plan ahead; sell portions at each target on the way up. If you are active, well, you already know. Hold until the chart shows there isn't room for anything higher and sell.
People use also a trailing stop-loss and that works well.
Whatever works for you. You have my support, I thank you for yours.
The Graph —GRTUSDT
Just a standard, medium-sized bullish wave on GRTUSDT can produce 686% profits, that's the potential mid-term. This can all unravel in just 30-60 days.
The Graph just hit a new all-time low and the action is happening within the extreme opportunity buy-zone. A great "place" to buy and hold.
Namaste.

XAUUSD – H4 OutlookXAUUSD – H4 Outlook: Technical Rebound as Precious Metals Stabilise | Lana ✨
Precious metals are showing early signs of stabilisation after a period of heavy volatility. As silver rebounds sharply from intraday lows, gold is also attempting to rebuild structure following a strong corrective sell-off.
This move appears to be a technical recovery, not yet a full trend reversal, but it provides important clues about the next directional phase.
📈 Market Structure & Price Action
After failing to hold above the upper supply zone near 5,500, gold experienced a sharp bearish displacement, breaking previous structure and accelerating lower. However, price found strong demand around the 4,600–4,650 support zone, where selling pressure was absorbed.
From this base, gold is now forming higher lows, indicating a short-term recovery within a broader corrective structure. The descending trendline remains intact, keeping the market in a decision-making phase.
🔍 Key Technical Zones
Strong Support / Demand: 4,600 – 4,650
This area acted as a clear liquidity base and remains critical for any recovery scenario.
Near-Term Resistance / Reaction Zone: ~4,900 – 4,920
Price is currently reacting here. Acceptance above this level would strengthen bullish momentum.
Mid Resistance: ~5,050 – 5,100
A key zone aligned with prior structure and imbalance.
Major Supply Zone: ~5,500
This remains the upper boundary where sellers previously regained control.
🎯 Possible Scenarios
Base Case:
Gold continues to consolidate above 4,600–4,650, building structure before attempting a push toward 4,900–5,050.
Bullish Extension:
Acceptance above 5,050 could open the door for a broader recovery toward higher supply zones.
Failure Scenario:
A breakdown below 4,600 would invalidate the rebound and shift focus back to lower liquidity.
🌍 Intermarket Context
Silver’s sharp rebound after a deep sell-off suggests panic-driven liquidation is easing across metals. Historically, such moves often support short-term recoveries in gold, even if volatility remains elevated.
🧠 Lana’s View
This is a recovery-in-progress, not a market to chase. The focus should remain on how price behaves at key resistance zones, especially near 4,900–5,050.
Patience is key while the market decides whether this rebound develops into a broader trend shift or remains corrective.
✨ Respect the structure, trade the levels, and let the market confirm the next move.

#EUR/USD Sell Trade Scenario.Here’s an up-to-date EUR/USD Sell trade outlook (technical + fundamental) to help you assess whether positioning for a Downside makes sense right now.
Thank You......

US30 | Bearish Pressure Below 49670US30 | Bearish Bias Below Pivot, Recovery Needs Breakout
The Dow Jones remains under pressure as price trades below a key pivot zone, keeping downside risk active unless buyers regain control.
Technical Outlook
The index maintains a bearish structure while trading below 49670.
As long as price remains below this level, downside pressure is expected toward 49240.
A break below 49240 would confirm bearish continuation toward 48840.
On the upside, a 1H candle close above 49680 would invalidate the bearish bias and support a bullish continuation toward 49980, followed by 50150.
Key Levels
• Pivot: 49530
• Support: 49240 – 48840
• Resistance: 49980 – 50150

Are we going to revisit ATH's on APLD? OptionsMastery:
🔉Sound on!🔉
📣Make sure to watch fullscreen!📣
Thank you as always for watching my videos. I hope that you learned something very educational! Please feel free to like, share, and comment on this post. Remember only risk what you are willing to lose. Trading is very risky but it can change your life!

ETHUSD (2H) — clear picture...ETHUSD (2H) — clear picture
Here’s the clean breakdown based on what’s on my chart.
Market Structure
Strong bearish trend
Price is below Ichimoku cloud → trend still bearish
Descending trendline holding as resistance
No bullish structure break yet
Sell Targets 🎯
From current price area (~2190–2200):
TP1: 2,050 – 2,020
Minor support / first liquidity grab
TP2: 1,950 – 1,920
Strong horizontal support (my first marked target)
Final Target: 1,750 – 1,700 🔥
Major demand zone
Matches my second target point + full bearish continuation
Invalidation / SL
If 2H candle closes above 2,300–2,330
→ bearish setup weak
Safe SL: above 2,350
Bias
📉 Bearish continuation until ETH reclaims 2,350+ with structure break

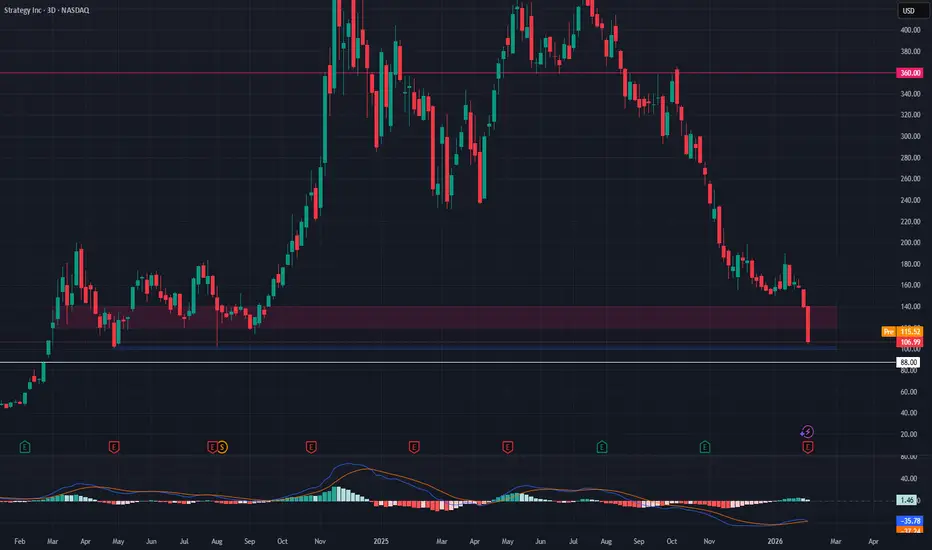
MSFT - High-Risk Reaction Trade at HTF SupportNASDAQ:MSFT is now down nearly 80% from its all-time high, approaching a major higher time frame (HTF) support zone. This is not a trend reversal play — it's a reaction trade at a critical level where a bounce is possible if sentiment stabilizes. The risk is high, but so is the short-term reward potential if the level holds.
📌 Trade Setup:
Entry Zone: $100 – $102
Take Profit: $120 – $140
Stop Loss: $88.00
This trade relies on a tight risk management strategy, given the strong downtrend. We’re looking for a bounce, not a reversal — if support cracks, we’re out.
USD/JPY: Takaichi trade & 162 intervention risk—Gap up or crash?USD/JPY is the most critical pair to watch right now, despite yesterday's mixed close. With Japan’s snap election on Sunday, we are facing a massive volatility event at the open. The pair is caught between a global risk-off crash triggered by Amazon's Q4 earnings and the potential for a "Takaichi landslide" that could send the yen plummeting. Technically, a break of 159.46 opens the door to the intervention danger zone at 162.00 that formed back in 2024. A Takaichi victory could force the Bank of Japan into a corner.
Key topics:
Crash : How Amazon’s spending plan and JOLTS triggered a selloff in Tech and Bitcoin, leaving markets nervous ahead of the delayed NFP. due next Wednesday.
"Takaichi Trade" : Why an LDP landslide means loose fiscal policy ("Sanaenomics") and a weaker yen, targeting highs above 159, 160 and perhaps even 162.
Intervention reality : The BOJ is likely to intervene at 160-162, but we explain why the massive US-Japan yield gap makes a sustained drop highly unlikely this time.
Japan Snap Election scenarios :
Bullish : Takaichi wins decisively + BOJ hesitation = Break above 159.46 targeting 162.00 and potentially 164.00.
Bearish : Election upset (Takaichi loses mandate) = Unwinding of the trade, targeting support at 152.00 and 150.00.
Are you holding positions through the Sunday election gap? Let us know in the comments!
This content is not directed to residents of the EU or UK. Any opinions, news, research, analyses, prices or other information contained on this website is provided as general market commentary and does not constitute investment advice. ThinkMarkets will not accept liability for any loss or damage including, without limitation, to any loss of profit which may arise directly or indirectly from use of or reliance on such information.

Ethereum hits bottom at $1,750 —Time to go LONGEther just hit bottom as a higher low compared to April 2025.
When the lowest point came up in April, it was coupled with the highest bearish volume candle in years. When the lowest point came up in February 2026, it is coupled with the highest bearish volume since April 2025. $1385 vs $1750.
On this chart you can also see a classic ABC correction. The final leg, the C wave, is extremely steep. Such a strong move cannot last that long. It lasted a long while but it looks like it already ran its course.
This bearish move is ending as a higher low.
This might not be the end of the bear market of course, we have some reckoning to do later in 2026. But now, the entire Cryptocurrency market is about to turn big green.
Since you were with me through all the ups and down, I just wanted to be the first to let you know.
Thanks a lot for your continued support.
Namaste.

MSFT AnalysisMSFT Analysis: Wave 4 Correction or Bear Trap? 📉🚀
Microsoft is currently at a critical junction. While the recent price action looks scary, the bigger picture suggests we are witnessing a classic Elliott Wave 4 correction rather than a trend reversal.
Key Technical & Fundamental Insights:
• The "Shadow" Factor: We are mid-week/month, and the price is currently testing the lower boundary of the long-term ascending channel. A recovery by the weekly close would form a "long lower shadow," signaling a massive Bear Trap.
• Fibonacci Support: The price has perfectly hit the 50% retracement level (~$390) of the entire Wave 3 move. This area also coincides with historical static support from 2024.
• Fundamental Value: With EPS at 16, the current P/E ratio (~24.7x) brings MSFT back to attractive valuation levels not seen in years. This fundamental "floor" provides the fuel needed for the next leg up.
• The Road to Wave 5: If the support holds, the projected target for Wave 5 sits between $610 and $625, aligning with the 0.618 Fibonacci extension and the upper channel resistance.
Conclusion: Don't let the mid-candle volatility blind you. If the "wick" holds, the bulls are simply reloading for the final push toward new all-time highs.

Just a possible target... Just a possible target of the bear market looking at past patterns and timings... Nothing to see here ;) Good luck!

Gold short C setupGold can trap the buyers from here, POC point can also generate reaction.
Only for learning purposes

XRP/USDT | Ripple Weekly Chart Under Heavy Bearish Pressure!By analyzing the #XRP chart on the weekly timeframe, we can see that price has dropped more than 68% from its high at $3.67 and is now trading around $1.174 after a strong dump. I expect this bearish move to continue in line with the broader market and Bitcoin.
The first demand zone ahead is between $0.90 and $0.94, while the second and most important demand area sits between $0.48 and $0.56. The downtrend is very strong right now, and this chart will be updated step by step as price moves.
Please support me with your likes and comments to motivate me to share more analysis with you and share your opinion about the possible trend of this chart with me !
Best Regards , Arman Shaban

S&P500 Crash Incoming: Peak confirmedOver in this video, I updated the wave counts for SPX and warns of a crash incoming. I also talk about where to place the stop loss and also the price targets.
Good luck!

TheGrove | USDJPY Buy | Idea Trading AnalysisEURJPY is moving on Resistance AREA..
The chart is above the support area, which has already become a reversal point twice.
We expect a decline in the channel after testing the current level and moving to resistance line
We expect a decline in the channel after testing the current level
Hello Traders, here is the full analysis.
I think we can soon see more fall from this range! GOOD LUCK! Great BUY opportunity USDJPY
I still did my best and this is the most likely count for me at the moment.
-------------------
Traders, if you liked this idea or if you have your own opinion about it, write in the comments. I will be glad ⚜️

Silver Buying OppertunitySilver is now at important support level and from now it should go for the new ATH
i m in buying silver

2026 $ONDS 45% to +1,066% Playbook Update 2.0 2026 Scenarios & Probabilities
! If the fundamentals keep strengthening !
TON of money to be made at this levels
honestly dreamy levels
Buying here is like buying the bottom of the bottom of the bottom
ONDS still going for 20$ at minimum
BUY don't freak out

NZDJPY: Breaking Out of Ascending TriangleNZDJPY: Breaking Out of Ascending Triangle
NZDJPY has broken out of a contracting triangle on the H4 timeframe, confirming the uptrend.
The price has respected the uptrend and is now pushing above the pattern in a clear way, signaling strong buying momentum.
As long as the structure holds, upside targets are marked at 95.00, 95.50 and 96.00.
On all time frames we are in a clear bullish trend.
Remember that the bullish move this time was triggered by news that Japanese PM Takaichi could win the snap election this Sunday
You may find more details in the chart.
Thank you and good luck! 🍀
❤️ If this analysis helps your trading day, please support it with a like or comment ❤️

BTC price oversold bounce into local resistance? Bitcoin price action has experienced a sharp, impulsive drop into the $59,000 region, confirming continued weakness across the lower timeframes. This sell-off has been followed by a short-term bounce, however the recovery move is occurring on noticeably low volume. As a result, the current bounce is best classified as an oversold reaction rather than the start of a sustainable trend reversal.
From a market structure perspective, Bitcoin remains firmly bearish. Lower highs and lower lows are still intact, and the broader trend continues to favor downside continuation. While short-term relief rallies are possible due to oversold conditions, these moves lack strong bullish conviction and have not been supported by meaningful volume expansion.
The key level to monitor on the upside is the $67,930 resistance zone. Price has already shown lower timeframe acceptance below this region, reinforcing it as a critical area of supply. As long as Bitcoin remains capped below $67,930, the probability favors further downside continuation.
If price continues to respect this resistance, the next major downside target sits at the $54,000 support level. This region represents a high-timeframe area of interest where buyers may attempt to step in. Until then, the technical outlook remains bearish, with corrective bounces expected but likely to be sold into as part of the broader downtrend.

DeGRAM | BTCUSD reached the $60k level📊 Technical Analysis
● Price broke the long-term rising support channel and now tests the lower trendline near the green pivot as major support, confirming a bearish channel continuation.
● Multiple breakdowns of key patterns (flag, triangle), breach of $70 K and subsequent sell‑off indicate strong downward momentum and capitulation, setting stage for reversal bounce off structural support.
💡 Fundamental Analysis
● Macro sentiment remains risk‑off as cryptocurrencies plunge with equities amid macro uncertainty and liquidations in BTC futures.
● Central banks hold rates steady but prospects of future cuts and easing could improve carry and risk appetite.
✨ Summary
Key support holds near trendline, bearish momentum dominates, macro risk weighing but potential relief from easing; watch $60 K support and trendline for reversal signs.
-------------------
Share your opinion in the comments and support the idea with a like. Thanks for your support!

Cardano recovers above long-term support —Buy now, sell when up!Notice the blue line on the chart—long-term support.
Yes, trading went below this level but it is recovering the same week, on the same session, on this exact same candle.
If you look at our stop-loss strategy, we focus on manual stop-loss. Weekly and monthly. Something like, "close a trade not only if the action pierces support but if the monthly (or weekly) session remains below the relevant level." That is, if the session closes below.
A pierce of support, on any timeframe, is not enough for us to close a good position, a trade. Why? Because we know the market is tricky and things happen just like it is happening today.
Yes, there was a strong crash but we are already back above support. The entire move is happening within just 24 hours, that is why is better to never use a stop-loss, not if you are trading spot.
Anyway, the action looks the same as June 2023. The action went below support just to recover followed by a massive bullish cycle.
The current session has a very long lower wick, this is a very strong bullish signal on its on, specially since we are looking at the weekly timeframe.
Cardano is now trading back within the opportunity buy-zone, great entry prices. Timing is also great because the bearish move is ending now which means bullish next. There can be bullish action for 1-2 months straight, it can be more. This is the bullish cycle—relief rally—we've been waiting for.
Buy now, but make sure to sell when prices are up.
Namaste.
