why? 90% of traders buy high and sell low?Have you ever entered a trade right when everyone said it is going to the moon
Have you ever sold right before price exploded upward again
This guide is here to break that painful cycle once and for all
Hello✌️
Spend 3 minutes ⏰ reading this educational material.
🎯 Analytical Insight on xrp:
I expect a much bigger rise for Ripple than what I have shown on the chart. But we should remember that every year when the New Year approaches the market usually goes bearish. We need to wait and pass through that period to see what the final result will be.
Now , let's dive into the educational section,
🧠 Trader Psychology
When price pumps fast the brain fears missing profit
This fear forces rushed entries without any plan
During drops the brain wants to escape immediately
Emotions repeat the same losing behavior again and again
As long as emotions decide the market always wins
📉 Market Emotion Cycle
Hope and excitement start the first entries
Greed grows at the top and everyone buys with confidence
Fear suddenly appears and price collapses fast
Panic creates the worst possible exit timing
Professionals buy while panic controls the crowd
🎯 Why We Buy Tops And Sell Bottoms
We search for confirmation from the majority
The majority is usually late and wrong in timing
Crowded zones have the highest probability of traps
After attracting buyers price normally corrects downward
In the bottom panic sellers accelerate the drop
📌 Proper Entry Plan
Entries must happen in logical discounted areas
Follow the trend instead of fighting it blindly
A trade without risk reward logic is a bad trade
A clear plan neutralizes heat of the moment emotions
🛡 Real Risk Management
Stop loss must exist before entering a position
Small risk keeps the trader alive long term
Clear targets prevent emotional exits without purpose
Without stop loss the market owns your account
📊 TradingView Tools
Volume Profile shows where big money entered strongly
Auto Fib Retracement marks logical pullback zones
Fear and Greed Index shows collective emotional pressure
Horizontal levels identify probable price reaction zones
Combining these tools creates emotion free trading decisions
🏆 Professional Behavior
They never enter trades during emotional hype
They journal every decision for performance growth
They know the market always gives another chance
Mind control matters more than predicting every move
main point
Replace hype and the herd with logic and structure and the cycle of buying tops and selling bottoms ends here. Survival and profits come from mental discipline not guessing the future. Control emotions and you step into professional trading.
golden recommendations
Wait for pullbacks instead of chasing fast moving candles
When everyone feels extremely confident danger might be highest
A stop loss costs less than your pride and saves your future
✨ Need a little love!
We pour love into every post your support keeps us inspired! 💛 Don’t be shy, we’d love to hear from you on comments. Big thanks , Mad Whale 🐋
📜Please make sure to do your own research before investing, and review the disclaimer provided at the end of each post.
Community ideas

Double Top: The Pattern That Warns You Before the Crash📘 Mastering the Double Top Pattern: A Complete Educational Guide for Traders
The Double Top is one of the most powerful and reliable reversal patterns in technical analysis. When understood and applied correctly, it helps traders catch the early phase of a trend reversal — often leading to high-reward opportunities with strong risk control.
1 . Understanding the Structure of a Double Top
A Double Top consists of three essential components:
🔸 First Top
- Price pushes upward in a strong bullish trend.
- It forms a peak at a key resistance zone.
- Price then retraces downward → creating the neckline.
🔸 Second Top
Price rises again but fails to break above the first peak.
This failure indicates:
+ weakening bullish momentum
+ growing selling pressure
This is the first warning of a potential reversal.
🔸 Neckline Breakout (Confirmation)
- When price breaks below the neckline, the pattern is confirmed.
- This confirms that buyers have lost control and sellers have taken over.
- This is where professional traders begin to look for short opportunities.
2. What the Double Top Really Tells You (Market Psychology)
A Double Top is psychology in motion:
- Buyers attempt to break resistance twice
- The first attempt succeeds (forming Top 1)
- The second attempt fails (forming Top 2)
- This failure shows exhaustion
- Once the neckline breaks → confidence shifts to sellers
- A new downtrend is likely to start
This pattern is especially powerful after a strong uptrend, because a reversal has more room to move.
3. Requirements for a High-Quality Double Top
To filter out fake signals, look for:
✔️ A strong bullish trend before the pattern
✔️ Two tops of similar height
✔️ Second top usually forms with weaker volume
✔️ Clear and decisive neckline breakout
✔️ Retest of the neckline increases probability
This helps you avoid low-quality setups and false reversals.
4. How Professional Traders Trade the Double Top
1️⃣ Entry Strategy
- The safest and highest-probability entry: SELL on the neckline retest after the breakout.
Entering early (at the second top) is risky — no confirmation yet.
2️⃣ Stop Loss Placement
SL should be:
- above the second top or above the structure that failed
- This protects you from false breakouts and liquidity grabs.
3️⃣ Take Profit Strategy
To project your target:
- Measure the height from the top → neckline
- Project the same distance downward
- This becomes your TP zone
Simple, clear, and effective.
5. Pro Tips to Avoid Traps
⚠️ DO NOT enter just because price forms a second top
⚠️ Wait for the neckline break
⚠️ Watch for decisive bearish candles
⚠️ Combine with:
- RSI divergence
- Trendline breaks
- FVG imbalance
- Liquidity sweeps
These confluences dramatically increase your win rate.
🧠 Final Thoughts
The Double Top is a classic pattern for a reason — it reveals clear market psychology and provides precise entries when used correctly. Mastering it allows you to catch early reversals with confidence and discipline.
If this lesson helped you, let me know in the comments 🚀📉📘

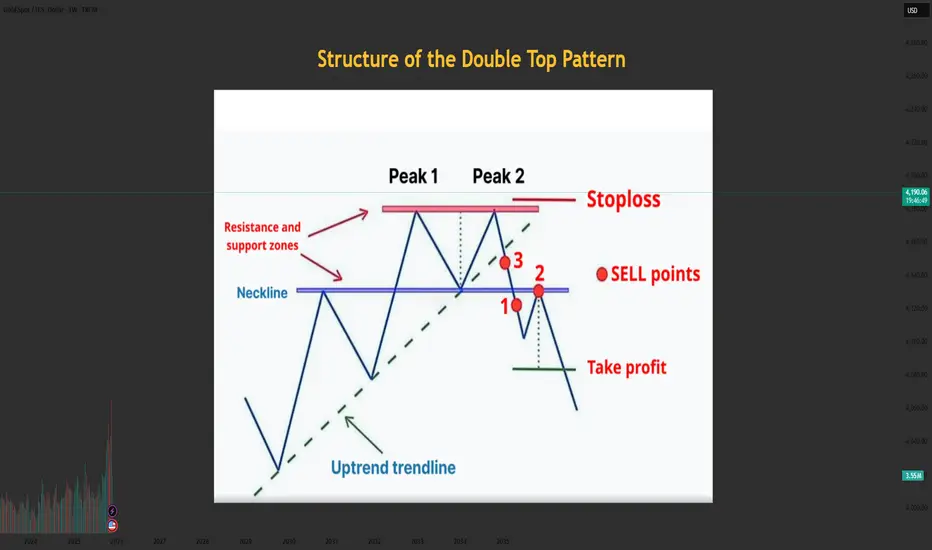
Structure of the Double Top PatternStructure of the Double Top Pattern
The Double Top consists of three main components:
1. First Top
- Price rises strongly and forms the first peak.
- Then price pulls back → creating the middle low (neckline).
2. Second Top
- Price rallies again but fails to break above the first top.
- This indicates weakening bullish pressure.
3. Neckline Breakout
- When price breaks below the neckline, the pattern is confirmed.
- This is the safest SELL entry.
Meaning of the Double Top Pattern
- Buying pressure weakens after the second top is formed.
- Sellers begin to dominate.
- Once the neckline is broken → a new downtrend begins.
- It is considered a strong and reliable reversal pattern when it forms after a clear uptrend.
Conditions for a Valid & High-Quality Double Top
✔️ The prior trend must be strongly bullish
✔️ Both tops should be approximately equal in height
✔️ Volume is usually higher on the first top and lower on the second
✔️ A strong neckline break with high volume → solid confirmation
How to Trade the Double Top Pattern
1. SELL Entry
Enter when price breaks the neckline and retests it.
✔️ The safest entry: SELL on the neckline retest → higher probability.
2. Stop Loss Placement
- Place SL slightly above the second top (or the first top).
- SL should be placed outside the structure to avoid false breakouts.
3. Take Profit (TP)
- How to estimate the target:
- Measure the distance from the top to the neckline, then project it downward.
Tips to Avoid Getting Trapped by a Double Top
1. Do NOT SELL just because price forms the second top → not confirmed yet
2. Only SELL when the neckline is clearly broken
3. Check volume or candle strength to increase accuracy
4. Combine with RSI, FVG, Trendline, Liquidity concepts for higher probability
Don’t forget to like and share your thoughts in the comments! ❤️❤️❤️
How to Use Simple Moving Averages (SMA) to Predict Price TargetsIn this video, you’ll learn exactly how to use the Simple Moving Average (SMA) to find both short-term and long-term price targets.
I explain which SMA settings work best, how to spot trend direction, and most importantly:
When you should take a trade and when you should stay OUT of the market to avoid losses.
What You’ll Learn:
How the Simple Moving Average works (SMA 9, 21, 50)
How to use SMA for short-term and long-term price targets
Best SMA crossover strategies
When to enter a trade using SMA
When to stop trading / avoid traps
How institutions use SMA to set levels
Tips to improve your accuracy and timing

Rapid ORB Pro- In action- Hyper Precision signal NY sessionWe are providing update live trade with our indicator. Very clean signal generated by our indicator.
Hopefully by next week we will publish the guidelines.

Psycholog: How to accept losing tradesLearning to accept losing trades is the most difficult, yet most necessary part of successful trading.
It's a well spoken strategy… win more than you can lose on each trade. Meaning (for example), risk 1% of your account on each losing trade. And gain 1.5% on each winning trade.
If you do that, you can lose half your trades and still make money.
So, if we know we can lose half the time, why is it so difficult to accept losing trades? It's something I struggled with for years.
I clearly remember once being so certain the GBP JPY chart was going up, I'd done my analysis, there had been a fundamental catalyst, I was convinced I'd put the stop loss in the perfect place and the profit target wasn't too ambitious. But the trade stopped out. I couldn't believe it. I was so mortified, there was no way the trade was going to stop out. Gripped by emotion, I immediately placed another trade, still convinced the chart was going up. That trade also stopped out. And two hours later, I'd placed another three trades, of course, all of those also hit the stop loss. In one afternoon I'd wiped out weeks worth of profit and hard work. I was in
complete despair…and I wish I could say that was the last time something like that happened, but it wasn't.
It was only when I finally taught myself to accept losing trades, I started to see consistent profits year after year.
The financial gain a successful system delivers is so rewarding, when you're working on a strategy, you are desperate to prove it works. You understand by using a greater ‘risk reward’ ratio, half your trades can stop out. But the desperation to prove the system will work clouds the bigger picture. When you then look deep into the human psyche and realise we have an inbuilt desire to want to be correct. It all makes it very, very, difficult to accept losing trades. So difficult in fact, ultimately, most people attempting to trade finally give up. After moving from system to system, blaming a market that's ‘out to get them’, when really, they didn't give the system a chance in the first place due to an inability to accept a losing trade.
And, it isn't just accepting losing trades, it is just as important to accept every decision you make, trade or no trade. For example, let's say you're looking at the charts and you quite like the look of a EUR USD long trade. Everything is falling into place, but the chart is approaching daily resistance. Your strategy tells you not to trade a currency into daily resistance, so you wait and check the chart again in a few hours…. But when you do check, that resistance has been broken, the EUR now looks overbought. And it looks like it was a bad decision not to take the trade. But, not taking the trade was the right thing to do!
I've been there myself, looking at that EUR USD chart. It's broken resistance, you think the chart looks overbought. But emotion takes over, disappointed at the thought of a missed opportunity, you place a trade. Only for the chart to pull back and stop the trade out. So, from eying up an opportunity, only to miss it. Then place a trade that stops out. You've gone from the possibility of a winning trade, straight to a losing trade.
Every decision is made in a particular moment, with the information you have at the time. Once a decision is made, anything can subsequently happen to alter the trajectory of your decision. Making it look like a bad decision, but it wasn't. More often than not, a chart will at least pause or pullback from daily resistance. So, probability suggests it was a good decision not to trade the EUR into daily resistance in the first place.
It's important to distinguish between making a ‘good decision in the moment’ but it ends up looking like a bad decision. And simply making a bad decision. You can then find ‘inner peace’ with every decision you make.
For me, it all comes down to a simple sentence: Make decisions you would stand by, regardless of the outcome.
It's a fairly throw away sentence, but I'm asking you to really read it and take in its meaning. It's the final piece of my trading jigsaw. It's how I come to the conclusion of every decision I make in the market. And my barometer for knowing when to enter a trade.
Essentially, every trade I place,I assess the potential risks (what could cause the trade to stop out?) and I ask myself… If this trade does stops out. Would I still think it was a good idea to place the trade?
As long as you are truthful with yourself…is this decision really aligned with my strategy? Or am I placing this trade out of emotion? If you can truthfully say my strategy suggests this is a ‘good decision’’, you can sit comfortably knowing you've done the best you can at that particular moment in time.
I'll leave you with another example of making a decision you would stand by, regardless of the outcome. Using an example from recent history.
The week starting Monday 21 September 2024 was a positive week for ‘risk sentiment'. The federal reserve has recently announced the beginning of a rate cut cycle, inflation is coming down and company earnings have on the whole remained robust through difficult times. All in all, the market is in a good mood and the ‘risk currencies’ are reacting according to correlations. Which means the JPY has been particularly weak. And a good currency to ‘short’ all week. But on Friday, the surprise outcome of an election in Japan gave strength to the JPY as the election winner is expected to be more ‘hawkish' than the market has anticipated. And any ‘short JPY’ trades at the time would have been stopped out.
The point I'm trying to make is…to be in a short JPY trade before the surprise news was most definitely a good decision. But events outside your control conspired to stop the trade out, making it look like the trade was a bad decision. But it was a ‘good decision’ in the moment the trade was taken.
Combining fundamental and technical analysis to make your decision.
Once you've identified the fundamental cause of a ‘move’, it's a case of finding the correct time to enter a trade. I do this by placing a stop loss at a point I think invalidates the trade idea. This is where ‘technical analysis’ is needed. My version of technical analysis is to use Bill Williams fractals (5 candle swing). I don't use any other indicators on my charts. In the past, I've tried them all (twice) and whilst it is very enticing to think MACD or RSI or Bolling bands, ect will tell you when a chart will go up. Ultimately, I spent a lot of time and effort to come to the realisation a 5 candle swing is the best method to use when deciding when to enter a trade. I'm particularly fond of 1hr swings. But there are occasions I'll go down to 15min depending on the velocity and narrative behind the ‘move’.
It takes time and dedication to really master the psychology to only enter a trade when you can confidently say: “if this trade stops out, I'll still think I should have taken it”. But if you focus on making ‘good decisions’ day after day. Whether it's to place a trade or to wait for a better entry price. Whatever the outcome of that decision, overtime, results will work in your favour. And you will have learned to realise you can put aside the need to be right, it's not the outcome of the decision that matters. The only thing that matters is making ‘a good decision in the moment’.
Then, by using that higher risk reward ratio on each trade… you can let the account take care of itself.
That's how I found my ‘inner trading peace’.

Understanding Discipline in TradingWelcome back everyone to another post. In today’s article we will dive deeper into the 3 keys of Trading success! As attached below.
Today we will be reviewing the Key “DISCIPLINE”
Just like risk management and Psychology this is also a difficult skill to maintain.
In the modern world it’s considered a skill now, because most of society doesn’t have any discipline in any field.
Let’s get started.
Definition:
When it comes to Trading Discipline. Trading Discipline means one user has the mental ability ( strength ) to follow their system. Their Trading Plan, risk management and maintain their psychology regardless of what events happen.
Trading Discipline separates profitable traders from the gamblers.
(Below I have attached the article Trader or Gambler as it relates to this post, make sure to give it a read!)
Discipline ensures that the user makes the right decisions based on strategy and logic instead of FOMO, ego and greed.
It is not just about following rules though. Discipline relates to the outside world of cultivating habits, mindsets and self-control too.
1) Understanding Trading Discipline
Firstly, you must truly grasp what it actually means. Most individual traders confuse it with stubbornness. They think it’s about holding on to trades or forcing a system. In reality, it’s only about consistency and self-control! Simple right?
Example:
Imagine, you have a system. A trading plan. It has the 1% rule where you don’t risk more than 1% of your account per trade. Understanding discipline means you must know why that rule is in place. It’s too protected your capital! Not breaking it after a few losses just to catch up.
Real Life Analogy:
A professional runner trains every day. They do it even when they are sad, tired, unhappy and unmotivated. This is discipline. Discipline drives long term results. Discipline is continuing it no matter what the current situation is.
2) Implementing Trading Discipline
The process of implementation is nothing complicated. It’s only turning knowledge into action. Knowing about it won’t do anything, you must maintain the effort of consistently applying it to each step in your system.
How to implement it:
- Follow your plan: Before each trading day starts, read out your system and tell yourself you will follow it. Even if no set ups appear, you will still succeed because you followed your plan.
- Set risk rules: Apply proper risk management and lot management so you don’t cave into fear. Apply the 1:3 Rule or 1:4 Rule.
- JOURNAL your TRADES Damn it: Record every trade, your reasoning, and whether you actually followed your rules. Don’t just add a screen shot and nothing else. YOU won’t succeed if you don’t journal your trades properly.
Example:
A novice trader may plan to place an entry when price is at $50 and exit at $55 with a 2% risk per trade. Even if it dips to price $48, they hold to the stop loss accepting the loss instead of moving it and hoping it “recovers”
Real Life analogy:
Think of it as budgeting every day, or for a holiday, or your next maccas run. You set a weekly budget plan and stick to it. Even when tempted by special deals, sticking to your budget allows for long term financial health to take place. Just like risk management but with real life.
3) Maintaining Trading Discipline
Discipline can’t act overnight, it’s the process of small steps working your way up to solid consistency over time. Even when feelings run high – discipline isn’t one time. It’s daily practice.
Some strategies are:
- Reviewing your previous trades daily or at the end of each week during a market close. Assess your wins and losses.
- Build up emotional awareness, be aware of what fear, greed and overconfident emotions take place.
- Reward yourself to the rules of your system, not just profitable outcomes.
If you reward yourself for not trading in one day because not a single set up appeared, you were still successful because you didn’t “force” a set up and take a gamble.
Example:
A trader might experience 3 losses in the first hour of the day, even if they were all A++ set ups. Instead of revenge trading, he sticks to his plan, accepts the L and leaves the charts for the rest of the day to reset mentally and gain a win in another field, eg – Gym.
Real-life analogy:
By maintaining a healthy lifestyle, you must apply the same approach. You don’t stop exercising after a few days off. Discipline keeps you aligned even when your motivation and mental strength fades.
4) Adapting without breaking your Discipline
Long story short, Markets move, Markets change, Markets can and WILL evolve.
Traders must adapt. Not just allows their system to adapt, but their psychological mindset of discipline.
Adapting can be confusing but it can be done by:
- Don’t switch up new strategies, adjust your current system slightly then back test and forward test it on demo accounts. Eg Paper trading.
- Update your trading system based on data and monthly results, not emotions.
- Avoid making sudden changes right after losses.
Example:
Let’s say a forex strat no longer works due to low volume and volatility. A strict trader tests adjustments in their demo accounts, then incorporates them into the plan after they have received positive data from tests.
Real-life analogy:
A chef might change his recipe based on a specific ingredient availability but will not ignore the core cooking principles. It’s about adapting strategically, not impulsively.
5) Reinforcing Discipline Through mindset and daily life.
Discipline in the trading field is just amplified by the discipline process outside of trading. It follows the exact same process. Daily habits and mindset directly impact one’s trading performance.
To reinforce discipline, you can:
- Maintain routines: Wake up at consistent times. Don’t wake up at 3:00am to “grind” if you do that, you’re stupid – you’ll burn yourself out and make the process harder.
Plan your day and review goals. Eg do a brain dump every morning, write down or type out all ideas, thoughts and emotions and sort it out.
- Practice mental training: People suggest doing personal journaling or meditation. Just go for a walk in the morning for 5 minutes. First thing in the morning, feel the fresh breeze, air, sunlight and nature. You simulate the mind and body in a natural way allowing for you to think clearly and train your mind.
- Change your environment: surround yourself with work dogs, people who are strict on routines, self-improvement, self-development, individuals who don’t slack off.
Example:
Traders who can control their time well, exercise, eat healthy can maintain their stress in trading better than one who does not focus on outside habits.
Real-life analogy:
A school student who studies consistently every day and night rather than squishing it all in before exams perform better. Just like a trader who can maintain structured habits inside and outside of the market.
Conclusion:
Trading discipline is more than following rules, it’s a mindset and a lifestyle, it relates to the world outside of trading. Just like psychology, if you can’t master it outside, you won’t master it inside.
It's about understanding your own weaknesses and adjusting the system to hold structured rules that will allow it to be more easily achievable for yourself.
Remember, trading is not sunshine and rainbows.
It’s about building a system and following it. It is the hardest way to make “ easy ” money.
To find out what the other 2 keys are, review the 3 posts below where I explain the 3 keys to trading success, and go deeper into each of them!

Don’t Let Panic Drive Your Decisions, The Market Reward PatienceDon’t Let Panic Drive Your Decisions — Because The Market Rewards Patience
The last few days in the S&P 500 were the perfect reminder of how quickly sentiment swings — and how dangerous emotional trading can be.
* Nov 20: Headlines screamed about an “AI Bubble Burst,” triggering panic selling.
* By Nov 21: Market declined +3.5%, wiping over $2 trillion in market value.
* By Nov 26: The same market recovered $2.6 trillion, pushing the S&P 500 back above 6800
* S&P 500 is now just 1.6% away from all-time highs (6921).
Anyone who sold in fear on Nov 20–21 is now sitting on regret, while disciplined investors who stayed calm are comfortably in profit.

Exchange Rate Dynamics and Fluctuations1. What Are Exchange Rates?
An exchange rate is the price of one currency expressed in terms of another. For example, if 1 USD = 83 INR, the exchange rate tells us how many Indian rupees one U.S. dollar can buy. Exchange rates are determined by supply and demand in the foreign exchange (forex) market, the largest and most liquid financial market in the world.
Currencies can either fluctuate freely based on market forces (floating exchange rates) or be controlled by governments or central banks (fixed or managed exchange rates).
2. Types of Exchange Rate Systems
a) Floating Exchange Rate
Most advanced economies, such as the U.S., U.K., Japan, and the Eurozone, use freely floating systems. Here, currencies appreciate or depreciate based on market supply and demand.
b) Fixed Exchange Rate
Some nations peg their currency to another currency, typically the U.S. dollar. The UAE and Saudi Arabia maintain such pegs. The central bank intervenes actively to maintain the peg.
c) Managed Float (Dirty Float)
Countries like India follow a managed float system. Here, the currency is mostly market-driven, but the central bank intervenes occasionally to reduce volatility.
3. Key Drivers of Exchange Rate Movements
Exchange rates do not move randomly. They follow economic logic, even if short-term movements seem volatile. Below are the major drivers:
**1. Interest Rates
Interest rates are among the most influential factors. When a country raises interest rates, foreign investors earn higher returns on its bonds and deposits. This increases demand for that currency and makes it appreciate.
Example:
If the U.S. Federal Reserve raises interest rates, the USD typically strengthens.
Emerging market currencies may weaken when the U.S. dollar strengthens due to capital outflow.
This relationship is known as interest rate parity.
**2. Inflation Levels
Low inflation generally strengthens a currency because it preserves purchasing power.
Countries with lower inflation (like Switzerland) tend to have stronger currencies.
Countries with high inflation often see their currencies weaken, as seen in Turkey or Argentina.
This concept is tied to purchasing power parity (PPP).
**3. Economic Growth and GDP Trends
Strong economic growth attracts foreign direct investment (FDI), increasing demand for the domestic currency.
For example:
India’s long-term economic growth prospects often support INR stability.
Weak economies see declines in currency demand.
**4. Trade Balance (Exports vs Imports)
If a country exports more than it imports (trade surplus), demand for its currency rises because foreign buyers must purchase its currency.
Surplus → Currency appreciation
Deficit → Currency depreciation
Japan, with large trade surpluses, often sees yen appreciation pressures during stable periods.
**5. Capital Flows and Foreign Investments
Foreign portfolio investments in stocks and bonds boost currency demand.
Example:
When FIIs invest heavily in Indian equities, INR strengthens.
When global risk rises, FIIs withdraw, weakening INR.
**6. Government Debt Levels
Countries with high public debt face higher default risk, weakening investor confidence.
High debt → Currency weakness
Low debt → Currency stability
This is why countries with strong fiscal discipline (like Germany or Singapore) have stable currencies.
**7. Speculation and Market Sentiment
Currency traders often anticipate future movements. If they expect a currency to appreciate, they buy it, leading to self-fulfilling appreciation.
Sentiment-driven moves can be volatile and disconnected from fundamentals in the short term.
**8. Geopolitical and Global Factors
Political stability strengthens currency demand; instability weakens it.
Events that trigger currency movements:
Elections
Wars
Sanctions
Trade disputes
Pandemics
For example, Russia’s ruble fell sharply after geopolitical tensions increased.
**9. Central Bank Interventions
Central banks buy or sell their currency to stabilize market conditions.
In India, the RBI:
Buys USD to weaken INR when it becomes too strong (supports exporters).
Sells USD to prevent sharp INR depreciation during crises.
Intervention smoothens volatility but does not permanently control long-term trends.
4. Short-Term vs Long-Term Exchange Rate Dynamics
Short-Term Dynamics
Short-term currency movements are driven by:
Speculation
Interest rate expectations
Day-to-day economic news
Market psychology
Risk sentiment
These fluctuations are often noisy and volatile.
Long-Term Dynamics
Long-term trends depend on:
Structural economic growth
Technological competitiveness
Productivity levels
Trade balances
Fiscal stability
These forces determine whether a currency strengthens or weakens over decades.
5. How Exchange Rate Fluctuations Affect the Economy
a) Impact on Imports and Exports
Strong currency → Cheaper imports, expensive exports
Weak currency → Costlier imports, cheaper exports
Countries often prefer a stable or slightly weak currency to support export competitiveness.
b) Impact on Inflation
Depreciation makes imported goods more expensive, increasing inflation.
This is why central banks monitor exchange rates while setting monetary policy.
c) Impact on FDI and Financial Markets
Foreign investors prefer stable currencies; volatility increases investment risk.
A sudden depreciation reduces returns for foreign investors, leading to capital outflows.
d) Impact on Tourism
A stronger domestic currency makes foreign travel cheaper.
A weaker domestic currency attracts more foreign tourists.
e) Impact on Corporate Earnings
Companies with international exposure face currency risks:
Exporters benefit from currency depreciation.
Import-dependent companies suffer when the currency weakens.
Many companies use hedging strategies such as futures and options to manage currency risk.
6. Why Exchange Rates Are So Volatile
Exchange rates fluctuate constantly because the forex market is influenced simultaneously by:
Economic data releases
Central bank speeches
Policy changes
Market sentiment
Global events
The market operates 24 hours a day, ensuring continuous adjustments.
Unlike stock markets, currency markets incorporate new information almost instantly, making them highly sensitive and liquid.
7. Modern Trends Influencing Exchange Rates
a) Algorithmic and High-Frequency Trading
Advanced algorithms react to data in milliseconds, increasing short-term volatility.
b) De-Dollarization Efforts
Countries are exploring trade in local currencies, affecting USD demand over time.
c) Digital Currencies
Central Bank Digital Currencies (CBDCs) may impact future forex markets by increasing transaction speed and transparency.
8. Conclusion
Exchange rate dynamics result from a complex interplay of macroeconomic fundamentals, market psychology, capital flows, and geopolitical developments. While long-term currency movements reflect a country’s underlying economic strength, short-term fluctuations are driven by news, speculation, and global risk sentiment. Understanding these dynamics is essential for investors, businesses, and policymakers in a globalized world. Stable exchange rates promote sustainable economic growth, while excessive volatility can disrupt trade, increase inflation, and create financial instability. As global financial integration deepens, exchange rate management will remain a key pillar of economic policy and international market behavior.
Trading Strategies and Index Investment1. Introduction: Trading vs Index Investing
Trading involves buying and selling financial instruments in shorter timeframes to profit from price fluctuations. Index investing, on the other hand, focuses on long-term wealth creation by tracking the performance of a market index like the Nifty 50, Sensex, S&P 500, or NASDAQ 100.
While traders depend on market timing, momentum, volatility, and technical setups, index investors rely on discipline, low cost, and time-driven compounding. Both approaches serve different objectives and require different skill sets.
2. Major Trading Strategies Used in Financial Markets
A. Intraday Trading
Intraday trading refers to buying and selling within the same day. Traders aim to capture small price movements and typically close all positions before the market shuts.
Key techniques include:
Breakout Trading: Entering when the price breaks above resistance or below support.
Volume and Volatility Trading: Using spikes in volume or volatility to anticipate intraday trends.
Scalping: Making multiple quick trades to profit from tiny price changes.
Skill requirement: Strong technical analysis, risk control, and emotional discipline.
B. Swing Trading
Swing trading targets price moves spanning several days to weeks. This strategy is ideal for those who want to avoid the stress of intraday noise yet prefer active participation.
Popular tools include:
Trendlines and channels
Moving averages (20-, 50-, 200-day)
RSI, MACD, Stochastic
Support-resistance zones
Swing traders capitalize on market swings that occur within broader trends.
C. Position Trading
Position traders hold assets for weeks or months, combining technical triggers with macroeconomic analysis.
Key metrics:
Interest rates
Economic cycles
Earnings growth (for equities)
Commodity cycles
This strategy suits individuals seeking medium-term returns without daily monitoring.
D. Momentum Trading
Momentum traders buy assets that are rising and sell assets that are falling. The philosophy is simple: “the trend is your friend.”
Indicators include:
Relative Strength Index (RSI)
MACD
Rate of Change (ROC)
Volume analysis
Momentum strategies perform well during strong trending markets but can suffer in sideways markets.
E. Algorithmic and Quantitative Trading
Algo trading uses computer programs to execute trades based on mathematical models. Many institutions and advanced retail traders employ:
High-frequency trading (HFT)
Statistical arbitrage
Mean reversion models
Machine learning–based systems
Algo trading removes human emotions and allows ultra-fast executions.
F. Options Trading Strategies
Options expand trading flexibility through strategies like:
Buying Calls/Puts (directional bets)
Selling Options (income generation)
Spreads (Bull Call, Bear Put, Iron Condor)
Hedging portfolios
Options allow traders to manage risk, speculate, or generate regular income.
3. Core Principles Behind Successful Trading Strategies
Regardless of strategy, certain principles determine long-term success:
A. Risk Management
The most critical factor. Traders must fix:
Stop-loss levels
Position sizing
Maximum loss per trade
Daily loss limits
Without discipline, even the best strategy fails.
B. Psychology and Emotional Control
Fear, greed, and impatience lead to poor decisions. Professional traders emphasize:
Sticking to the plan
Avoiding revenge trading
Staying consistent
Recording trades and reviewing mistakes
C. Market Structure and Trend Recognition
Understanding trends, ranges, liquidity zones, and market phases helps traders avoid confusion and noise.
D. Backtesting and Strategy Optimization
Before risking real capital, strategies must be tested on historical data. Key evaluation metrics include:
Win rate
Average return per trade
Maximum drawdown
Risk-reward ratio
4. Introduction to Index Investing
Index investing involves buying a basket of securities that track a broad market index. It is a passive investment strategy, focused on long-term wealth building without frequent buying or selling.
Examples of popular indices:
India: Nifty 50, Sensex, Nifty Next 50, Nifty Bank
Global: S&P 500, Dow Jones, NASDAQ 100, FTSE 100
Index investing is typically done through:
Index funds
Exchange-Traded Funds (ETFs)
Index-based systematic investment plans (SIPs)
5. Why Index Investing Works
A. Broad Diversification
An index spreads investment across multiple sectors and companies, reducing single-stock risk.
B. Low Costs
Since there is no active fund manager, expense ratios are much lower.
C. Long-Term Compounding
Index investing leverages time rather than timing. Markets generally rise over the long run as economies expand.
D. Consistent Performance
Most actively managed funds fail to beat major indices over long periods. Index funds often outperform because they avoid high fees and complex decisions.
6. Popular Index Investment Strategies
A. Buy and Hold
Investing a lump sum or systematically and holding for decades. Suitable for retirement and long-term goals.
B. Systematic Investment Plans (SIP)
Investing fixed amounts regularly. Benefits:
Rupee cost averaging
Disciplined investing
Emotional neutrality
C. Smart Beta Strategies
Smart beta funds track indices based on factors like:
Value
Momentum
Low volatility
Quality
Equal weight
These offer a mix of passive and active management.
D. ETF Trading and Tactical Allocation
Some investors actively buy and sell index ETFs based on:
Market cycles
Interest rates
Sector rotations
This blends trading with index investing.
7. Combining Trading Strategies with Index Investing
Many professional investors use a hybrid approach:
Core Portfolio: 60–80% in index funds/ETFs for long-term stability
Satellites: 20–40% in active trading or high-conviction positions
This maintains balance between growth and risk.
8. Final Thoughts
Trading strategies and index investing represent two ends of the investment spectrum—one active and tactical, the other passive and long-term. Traders seek to capitalize on market inefficiencies, short-term momentum, or technical signals. Index investors rely on the power of diversification, low cost, and long-term market growth.
A smart market participant understands both worlds and uses them based on their financial goals, risk tolerance, and time availability. Successful wealth creation doesn’t depend on choosing one over the other, but on aligning them intelligently with one’s personal financial roadmap.
Best Ways of Trading1. Trade with a Clear Strategy (Not Emotion or Guesswork)
One of the biggest mistakes new traders make is trading without a defined plan. The best way to trade is to follow a tested strategy. Some proven trading styles include:
a) Trend Trading
This approach involves identifying the overall market direction and trading in line with it. Trend traders use tools like moving averages (20, 50, 200), MACD, or trendlines to determine direction. The idea is simple:
“Trade with the trend until it ends.”
b) Swing Trading
Swing trading works best for people who cannot monitor markets all day. This approach aims to catch reversals or continuation moves over days to weeks. Traders look for key support/resistance, breakouts, and candlestick patterns.
c) Intraday Trading
Intraday traders look for small, high-probability moves within a single session. The best intraday setups come from volume spikes, VWAP, breakout zones, and strong trend days.
d) Momentum Trading
Momentum traders focus on stocks or instruments that show strong volume and price acceleration. When markets move rapidly in one direction, momentum traders ride the wave.
e) Options Trading
Options allow traders to profit using leverage and hedge positions. Buying calls and puts, selling options for premium, or using spreads can significantly enhance risk-reward profiles.
f) Algorithmic or Systematic Trading
A growing method that uses rules, automation, or AI-driven models. This reduces emotions and increases consistency.
The best traders select one main strategy and master it, rather than attempting everything.
2. Follow Multi-Time-Frame Analysis
Always confirm trades using multiple time frames. For example:
Long-term trend – weekly chart
Medium trend – daily chart
Entry timing – 15-minute or 5-minute chart
This prevents taking trades against the broader market direction. When all time frames align, the probability of success increases dramatically.
3. Master Risk Management (The Heart of Successful Trading)
Even the best strategy fails without proper risk control. The strongest traders treat risk management as the core of their system.
a) Risk per Trade
Smart traders risk 1–2% of their capital on any single trade. This helps avoid catastrophic losses.
b) Stop-Loss Use
Always define where the trade is wrong and set a stop-loss accordingly. A systematic stop-loss protects capital and preserves longevity.
c) Position Sizing
Your position size should be based on your risk per trade and stop-loss distance, not on emotions or random judgment.
d) Risk-to-Reward Ratio (RRR)
Successful traders aim for at least 1:2 or 1:3 RRR.
This means:
If you risk ₹1, you target ₹2 or ₹3.
e) Avoid Overtrading
One of the most common reasons traders lose money is taking too many trades. Quality beats quantity.
Risk management is the backbone of consistent long-term profitability.
4. Use Technical and Fundamental Analysis Together
The best trading approach usually combines elements of both.
Technical Analysis helps with:
Timing entry and exit
Understanding trend structure
Recognizing chart patterns
Interpreting market psychology
Key indicators include RSI, MACD, Bollinger Bands, moving averages, and volume-based tools.
Fundamental Analysis helps with:
Identifying long-term direction
Understanding earnings, interest rates, inflation
Recognizing geopolitical and macroeconomic risks
Selecting strong long-term stocks or commodities
A trader who understands both sides sees the market differently and more accurately.
5. Develop Strong Trading Psychology
The market is a psychological battlefield. The best traders keep emotions under control. Some core psychological frameworks include:
a) Discipline and Patience
Only take setups that match your strategy. Good traders wait for the right moment.
b) Emotion Control
Fear and greed destroy accounts. The best way to avoid emotional decisions is to follow a rule-based system.
c) Accepting Losses
Even top traders lose 40–50% of trades. Losses are part of the game. The goal is to keep them small.
d) Avoiding the “Revenge Trade” Trap
Never attempt to win back losses instantly. This leads to impulsive decisions and bigger losses.
Mastering psychology is as important as mastering charts.
6. Backtest and Forward-Test Your Strategy
Before risking real money, test your strategy historically (backtesting). Check:
Win rate
Average gain vs average loss
Maximum drawdown
Consistency during different market conditions
Follow this with paper trading to see real-time behavior. A strategy that performs well in backtests and paper trading has higher chances of success in real markets.
7. Use Technology to Your Advantage
Modern trading has advanced tools:
Algorithmic screeners
Charting platforms
AI-driven market sentiment analysis
Automated alerts
Portfolio trackers
Order execution bots
Technology increases efficiency and reduces human error.
8. Follow Market Cycles and Global Trends
Markets move in cycles: accumulation, uptrend, distribution, correction.
Understanding economic cycles, liquidity conditions, central bank policy, and geopolitical events helps you choose the right instruments and strategies.
For example:
High inflation phase → commodities tend to outperform
Low interest rates → equities rally
Geopolitical tensions → gold, USD strengthen
Trading in sync with macro trends improves accuracy.
9. Diversify Your Trading Portfolio
Do not rely on one asset or one market. Trade multiple instruments (equities, commodities, indices, currencies) to reduce risk. A diversified portfolio smoothens performance and reduces emotional pressure.
10. Keep a Trading Journal
A trading journal is one of the most effective tools for improvement. Record:
Entry & exit levels
Strategy used
Reason for trade
Emotions felt
Result and analysis
Review your journal weekly. It reveals patterns in your behavior, helping you correct mistakes and become a more consistent trader.
Conclusion: What Is the Best Way of Trading?
There is no one “best way,” but the best traders combine:
A clear, tested strategy
Multi-time-frame confirmation
Strong risk management
Mastered psychology
Smart use of technology
Discipline in execution
Trading is not about predicting the future; it's about managing risk, following a system, and staying emotionally stable. If you approach it scientifically and patiently, you can achieve long-term success in any market.
The World Economy’s Journey in the Trading Market1. Early Foundations: The Birth of Global Trade
Modern world trade began centuries ago with land routes, maritime exchanges, and colonial expansions. However, true economic globalization began after the Industrial Revolution.
Factories produced goods at scale, and countries required raw materials, capital, and new markets. This interdependence set the foundation for a global trading web.
Key Features of Early Global Trade
Simple Trading Infrastructure: Telegraphs, ships, and railways connected markets but at slow speeds by today’s standards.
Commodity Dominance: Coal, textiles, metals, and agricultural products drove trade volumes.
Gold Standard: Most countries pegged their currencies to gold, stabilizing international trade.
Though primitive compared to today, these early systems planted the seeds for a unified world economy.
2. Post-War Growth and the Era of Financial Globalization
After World War II, nations realized that economic cooperation was essential for peace and progress. This launched institutions like:
IMF (International Monetary Fund)
World Bank
GATT → WTO (World Trade Organization)
These bodies shaped trade rules, stabilized currencies, and opened markets.
The Bretton Woods System
The global economy operated under a fixed exchange-rate regime led by the U.S. dollar pegged to gold. This stable environment helped:
Facilitate international trade
Increase capital flows
Rebuild war-torn economies
When the system collapsed in 1971, floating exchange rates emerged, giving birth to modern currency trading.
3. Rise of Capital Markets: Stocks, Commodities, and Currencies Go Global
From the 1980s onward, deregulation and technology transformed world markets.
Key Milestones
Electronic trading platforms replaced floor trading.
Multinational corporations expanded production globally.
Derivatives markets (futures, options, swaps) exploded in size.
Hedge funds, investment banks, and pension funds became major market players.
Oil, gold, and commodity futures shaped inflation and energy policies.
This period marked a fundamental shift:
Trade was no longer limited to goods; money itself became the most traded commodity.
Foreign exchange (forex) grew into a $7-trillion-a-day market, making it the largest financial market in the world.
4. Digital Revolution: The 21st Century Trading Landscape
With the rise of the internet and high-speed computing, the early 2000s launched the digital trading era.
What changed?
Algorithmic trading (algo trading) began executing trades in milliseconds.
Online brokerages democratized market access.
Financial information became instant and global.
High-frequency trading (HFT) reshaped liquidity and market volatility.
Cryptocurrencies emerged as a parallel financial system.
Mobile trading apps made stock participation mainstream.
The world economy became deeply connected: A policy change in China or a tweet from a global leader could move markets worldwide.
Key Drivers of Modern Global Trade
Technology
Capital mobility
Global supply chains
Central bank policies
Cross-border investments
This phase also brought unprecedented speed—capital could fly across continents in seconds, impacting currencies, equities, commodities, and bond markets simultaneously.
5. The Shockwaves: Crises That Reshaped Global Markets
Major global events redefined the world economy’s trading journey:
2008 Global Financial Crisis
Triggered by U.S. mortgage collapse
Nearly crashed global banking
Led to quantitative easing (QE) era
Pushed interest rates to near zero
This event emphasized how interconnected global markets had become.
COVID-19 Pandemic (2020)
Disrupted supply chains
Crashed global demand initially
Fuelled the greatest monetary stimulus in history
Caused inflation waves across the world
Financial markets experienced extreme volatility, while digital and retail trading boomed.
Russia–Ukraine Conflict
Massive impact on energy, oil, natural gas, and wheat prices
Reshaped Europe’s energy landscape
Elevated geopolitical risk across global markets
Each crisis reshaped trading behavior, capital flows, risk perception, and investor psychology.
6. The Shift to Multipolar Trading: De-globalization Begins
From 2020 onwards, a new phase began: geoeconomic fragmentation.
The world is slowly drifting away from a U.S.-centric model into a multipolar system with major players like:
United States
China
India
European Union
Middle East (as energy and investment hubs)
Emerging Trends
Friend-shoring and reshoring of supply chains
Rise of regional trade blocs
Energy transition reshaping commodity markets
Local currency trade agreements (INR, yuan, ruble)
Digital currency experimentation by central banks (CBDCs)
Countries are building self-reliance while still operating within global markets—a hybrid model of globalization.
7. The Future: Where the World Economy and Trading Market Are Heading
The journey continues as new forces redefine global trade:
A. Rise of AI-Driven Markets
Artificial Intelligence is changing how markets function:
Real-time market prediction
Automated portfolio rebalancing
Sentiment analysis through big data
Algorithmic hedging strategies
Ultra-fast execution
Trading is becoming more data-driven, precise, and automated.
B. Green Energy and Commodity Supercycles
The global shift toward renewable energy is reshaping:
Lithium
Copper
Nickel
Rare earth metals
Natural gas
These commodities are becoming the new strategic assets of the 21st century.
C. Battle of Currencies: USD vs New Regional Powers
The U.S. dollar still dominates global trade, but new challenges are rising:
China promoting yuan settlement
India increasing INR trade agreements
Middle East exploring oil trade in non-USD currencies
Digital currencies becoming part of financial networks
While the dollar remains strong, the future will likely see multiple important currencies power trade.
D. Digital Assets and Blockchain
Crypto, tokenization, and blockchain-based systems are reshaping:
Settlement speed
Transparency
Cross-border payments
Decentralized finance (DeFi)
Tokenized commodities and real-world assets
This could become the next major phase of global trading.
Conclusion: A Journey That Never Stops
The world economy’s journey in the trading market is a story of continuous evolution—driven by technology, politics, crises, and the collective ambitions of nations and markets.
From simple trade routes to AI-based trading desks, from gold-backed currencies to digital assets, and from regional markets to global interdependence—the world of trade has expanded beyond imagination.
Today’s global economy is:
Faster
More interconnected
More competitive
More volatile
More data-driven
And the journey ahead promises even greater transformation as nations redefine alliances, technology reshapes markets, and investors navigate an increasingly complex global landscape.
Commodity Super Cycle1. What Is a Commodity Super Cycle?
A commodity super cycle is a multi-decade phase of elevated commodity prices caused by structural changes in demand from rapid industrialization, technological shifts, demographic growth, or large-scale urban development. During a super cycle, commodities such as crude oil, natural gas, copper, aluminum, steel, coal, lithium, nickel, and agricultural products rise and stay at higher price levels for many years.
Commodity prices move in cycles, but a super cycle stands apart because:
It lasts much longer (10–30 years)
It reflects global economic transformation
It involves broad sectors simultaneously—not just one commodity
It pushes producer nations into economic booms
It drives inflation and reshapes global financial markets
Examples include the industrial revolution-driven cycles in the 1800s, post–World War II reconstruction, and the China-led boom in the 2000s.
2. Historical Commodity Super Cycles
(A) The Late 1800s Industrial Expansion
With the rise of the U.S., U.K., and Germany during the industrial revolution, demand for coal, steel, and metals exploded. Railways, factories, and mechanization created decades of high commodity consumption. The cycle lasted until the early 1900s.
(B) Post–World War II Reconstruction (1950–1970s)
Massive rebuilding of Europe and Japan required huge imports of steel, copper, oil, machinery, and energy. A global manufacturing boom sustained high prices.
(C) The 1970s Oil Boom
The oil embargo and supply disruptions pushed crude prices sharply higher, fueling high inflation worldwide. Energy-driven commodities surged.
(D) China-Led Super Cycle (2000–2014)
China’s unprecedented urbanization and industrialization lifted global demand for iron ore, copper, coal, cement, crude oil, and fertilizers. Prices stayed elevated for more than a decade. This cycle ended after China slowed infrastructure expansion.
3. What Triggers a Commodity Super Cycle?
A super cycle typically begins when the world undergoes a major structural transformation. Key triggers include:
(1) Industrialization & Urbanization
When economies shift from rural to urban structures, they need:
Steel for buildings
Copper for electricity grids
Energy for factories and transportation
Cement for infrastructure
China used more cement between 2011 and 2013 than the U.S. did in the entire 20th century—this is the essence of a super cycle.
Today, India, Southeast Asia, Africa, and the Middle East may become the next demand engines.
(2) Massive Technological Shifts
New technologies can drive extraordinary demand for specific commodities—for example:
Lithium, nickel, and cobalt for EV batteries
Copper for renewable grids
Rare-earth metals for electronics and defense systems
The current energy transition is a key candidate for a new super cycle.
(3) Global Population Growth
A rising population increases the need for:
Food commodities (grains, pulses, oils)
Housing (steel, cement, lumber)
Transportation (oil, metals)
Electricity (coal, natural gas, renewables)
(4) Supply Constraints
If supply cannot keep up with demand, prices remain high for years. Constraints include:
Lack of mining investment
Depletion of high-grade mineral resources
Geopolitical disruptions
Environmental regulations restricting production
Logistical bottlenecks (shipping, pipelines)
The post-2020 world has seen multiple supply challenges, intensifying commodity cycles.
4. Characteristics of a Commodity Super Cycle
A true super cycle shows distinct features:
1. Broad-Based Commodity Price Rise
It affects multiple sectors:
Energy
Base metals
Precious metals
Agricultural commodities
Not just one commodity—unlike a short-lived oil spike.
2. Long Duration
Lasts 10–30 years due to slow-moving structural reforms and capital-intensive supply side.
3. High Inflation Periods
Commodities influence global inflation. During super cycles:
Producer prices rise
Consumer inflation increases
Interest rates remain elevated
The 1970s and early 2000s saw inflationary pressure during super cycles.
4. Investment Surges in Mining & Energy
Companies increase capex massively:
New mines
New drilling fields
Infrastructure expansion
But supply expansion takes years, prolonging high prices.
5. Geopolitical Tensions
Competition for natural resources increases:
Oil politics in the Middle East
Rare earth dominance by China
Copper and lithium battles in Africa & Latin America
5. Why the World May Be Entering a New Commodity Super Cycle
Several factors suggest the possibility of a new commodity boom between 2025–2040.
(A) Global Energy Transition
The shift from fossil fuels to clean energy requires:
4X more copper per megawatt
10X more lithium for EVs
Massive rare-earth demand for wind turbines
Nickel & cobalt for battery storage
This structural shift is long-term and irreversible.
(B) Underinvestment in Mining (Last 10 Years)
Mining companies have not invested enough in new supply since the 2014 commodity crash. As a result:
Copper mines are aging
Oil discoveries are fewer
Nickel & lithium supply is insufficient for future demand
Low supply + rising demand = multi-year high prices.
(C) Multipolar Geopolitics
The world is splitting into blocs:
U.S.–Europe
China–Russia
Middle East power centers
Emerging markets
This fragmentation raises risks for supply chains, transportation, and energy markets. Commodities thrive during uncertainty.
(D) Rising Consumption from India & Africa
India is expected to become the world’s third largest economy by 2030, driving growth in steel, energy, cement, copper, and oil. Africa’s urbanization is accelerating as well.
(E) Fiscal Expansion & Infrastructure Boom
Countries are investing in:
High-speed rail
Renewable grids
Ports & highways
Urban housing
These require massive commodity inputs.
6. Impact of a Commodity Super Cycle on the Global Economy
1. Higher Inflation Globally
Commodities influence food, transportation, electricity, and housing. A prolonged price rise creates persistent inflation.
2. Shift in Global Wealth
Commodity-exporting nations benefit:
Middle East (oil, gas)
Australia (iron ore, coal)
Brazil (agri, metals)
Chile & Peru (copper, lithium)
South Africa (metals)
Import-dependent nations face pressure:
India (oil, gas)
Japan
Europe
3. Stronger Currency for Exporters
Countries exporting high-demand commodities see currency appreciation.
4. Stock Market Re-Rating
Sectors gaining:
Energy companies
Mining companies
Metal producers
Agri-business firms
Infrastructure suppliers
Sectors hurt:
Consumer goods (higher input cost)
Electronics (higher metal costs)
5. Rise of New Global Powers
Nations with critical minerals become geopolitically significant:
Lithium Triangle (Chile, Argentina, Bolivia)
Indonesia (nickel)
DR Congo (cobalt)
7. Risks That Can End a Super Cycle
Super cycles end when demand slows or supply catches up. Key risks include:
Technological change reducing commodity use
Global recession reducing demand
Major new mining discoveries
Substitution (e.g., aluminum replacing copper)
Policy shifts like carbon taxes or mining bans
However, because these changes take time, a super cycle does not collapse quickly.
Conclusion
A commodity super cycle is one of the most powerful forces shaping the global economic landscape. These long, decade-spanning cycles emerge from structural transformations like industrialization, urbanization, technological revolutions, or global energy transitions. When demand surges and supply lags, commodities rise across the board—fueling inflation, reallocating global wealth, shifting geopolitical power, and creating an entirely new investment environment.
Today’s world—driven by renewable energy transition, underinvestment in mining, rising emerging-market demand, and geopolitical fragmentation—has many of the conditions necessary for a new super cycle. Whether or not it fully materializes, the next decade will likely be dominated by commodities that form the backbone of modern civilization.

Economic Future at Risk in the Trading Market1. Heightened Market Volatility and Unpredictability
Market volatility is not new, but its frequency, magnitude, and drivers have changed. Previously, volatility was largely triggered by economic data or company earnings. Today, geopolitical shocks, pandemic-like events, cyber-attacks, and supply chain breakdowns trigger sudden movements across global markets.
High-frequency trading algorithms and automated systems amplify these movements. A minor headline can trigger billions of dollars in buying or selling within seconds, resulting in flash crashes or sharp intraday swings. This makes the trading environment more dangerous for retail traders and institutions, raising the probability of mispricing, liquidity traps, and cascading sell-offs.
2. Central Bank Tightening and the Threat of Economic Slowdown
The last decade was marked by cheap money—near-zero interest rates and quantitative easing. But inflationary pressures following the pandemic, supply chain shortages, and geopolitical tensions forced central banks (like the U.S. Federal Reserve, ECB, and RBI) to raise interest rates aggressively.
Higher interest rates bring several risks:
Reduced liquidity in equity and bond markets
Corporate borrowing costs rise, leading to lower earnings
Emerging markets face currency pressure as capital flows back to the U.S.
Real estate and financial assets lose valuation
Higher chance of recession
In a high-rate environment, every asset class—stocks, crypto, gold, bonds, real estate—faces pricing uncertainty. Traders must adapt to a world where liquidity is shrinking and capital is more expensive.
3. Geopolitical Instability Rewriting Global Trade
The global economy is undergoing a major geopolitical realignment:
The U.S.–China rivalry is disrupting technology supply chains.
Conflicts in Europe, Middle East, and Asia threaten fuel and food supplies.
Countries are prioritizing economic nationalism, reshoring factories and reducing trade dependencies.
These shifts raise costs for companies and slow down global economic growth. Markets react violently to geopolitical shocks—especially commodity markets like oil, gas, wheat, and rare earth metals. For traders, this means higher uncertainty, sudden price gaps, and the constant threat of new sanctions or regulations.
4. Currency Instability and the Fight for Dominance
Global currency markets face major instability:
The U.S. dollar is strong, creating pressure on emerging market currencies.
Multiple countries are exploring de-dollarization, challenging the global currency order.
Large nations are increasing their reserves of gold, signaling declining trust in fiat systems.
Cryptocurrencies continue rising but remain highly volatile.
When currencies fluctuate rapidly, it affects trade balances, government debt, import/export costs, and corporate earnings. Multinational companies face higher hedging costs. Investors face exchange-rate risks. For developing economies, the risk of capital flight increases, putting their economic future at risk.
5. Debt Crisis Looming Over Countries and Corporations
Global debt—government, household, and corporate—has reached historically extreme levels. Many countries borrowed heavily during the pandemic to support their economies. Now, with higher interest rates, repayment burdens are rising.
Countries at risk include:
Highly indebted developed nations
Emerging markets dependent on foreign loans
Economies struggling with weak exports or falling currency reserves
A debt default or liquidity crisis in one major economy could trigger global contagion, as seen in the 2008 financial crisis. Corporate debt is another danger—many companies now face refinancing at significantly higher interest rates, which could push weaker firms toward bankruptcy.
6. Technology Disruption, Cyber Risks, and AI-Driven Trading
Technology has always shaped finance, but today’s disruption is unprecedented:
AI-driven trading
Algorithms dominate global trading volumes, making markets move faster and sometimes more irrationally. Errors, bugs, or miscalculations in algorithms can cause massive volatility.
Cyber-attack risks
Financial markets are prime targets for cyber warfare. A major breach on a stock exchange, bank, or clearinghouse could disrupt global markets instantly.
Blockchain instability
Crypto markets add another layer of uncertainty, with regulatory crackdowns, exchange failures, and price manipulation affecting investor confidence.
While technology brings efficiency, it also introduces systemic fragility, where one failure can ripple across markets.
7. Commodity Shock Risks: Energy, Metals, and Food
Commodity markets are extremely sensitive to global shocks:
Oil and gas supply disruptions raise costs worldwide.
Climate change affects crop yields, increasing food prices.
Rare earth and metal shortages disrupt technology and electric vehicle industries.
When commodities spike, inflation rises. When they crash, exporting nations suffer revenue losses. Both extremes create economic instability, affecting stock markets, currency markets, and global trade.
8. Climate Change and the Cost of Environmental Disasters
Climate risks are now financial risks. Extreme weather events—floods, droughts, heatwaves, storms—directly impact national economies and trading markets:
Agricultural output drops
Insurance costs surge
Supply chains break
Infrastructure is damaged
Energy demands rise
Climate-related losses already cost trillions globally. As environmental disasters increase, financial assets that depend on stability become more vulnerable.
9. Social and Political Instability Threatening Economic Confidence
Economic inequality, unemployment, and inflation often lead to social tensions. Political unrest can weaken investor confidence, reduce foreign investment, and derail economic growth. Countries facing internal instability often see:
Capital outflows
Currency depreciation
Stock market decline
Increased borrowing costs
Such scenarios make long-term planning difficult for traders and investors.
10. Psychological and Behavioral Risks in Trading
Human behavior plays a crucial role in market dynamics. The modern era has amplified emotional trading:
Social media influences market sentiment
FOMO-driven trading causes bubbles
Panic selling creates flash crashes
Retail traders follow trends without risk management
This irrational behavior increases systemic vulnerability. When millions follow the same emotional trend, markets lose stability.
Conclusion: Navigating a Future Filled With Risk
The economic future is undeniably at risk due to converging forces: geopolitical conflict, technology disruption, debt burdens, climate change, currency instability, and behavioral volatility. The trading market reflects these tensions in the form of rapid price swings, liquidity shocks, and unpredictable cycles.
However, risks also create opportunities. Traders and investors who focus on diversification, risk management, macro insights, and disciplined strategy can thrive even in turbulent times. The key is understanding that the future will not resemble the stability of previous decades. Instead, success depends on adapting to a world defined by uncertainty, speed, and global interconnectedness.
Global Finance and Central Control1. The Architecture of Global Finance
The modern global financial system is built on several interconnected layers:
a) International Financial Markets
These include:
Foreign exchange (Forex) markets where currencies are traded.
Global bond markets where governments and corporations borrow.
Equity markets where companies raise capital.
Derivatives markets where risk is traded through futures, options, and swaps.
These markets operate almost 24/7 and link every financial center—New York, London, Tokyo, Singapore, Dubai, Frankfurt.
b) Cross-Border Capital Flows
Capital moves across borders in the form of:
Foreign direct investment (FDI)
Portfolio investments in stocks and bonds
Bank lending
Remittances
Trade financing
These flows allow nations to grow, but they also expose countries to global shocks.
c) Financial Institutions
The key pillars include:
Global banks (JPMorgan, HSBC, Citi, Standard Chartered)
Multinational corporations
Pension funds and sovereign wealth funds
Hedge funds and private equity
Central banks and regulatory bodies
Together, these institutions shape how money circulates globally.
2. The Rise of Central Control in Global Finance
Although global finance appears “free-flowing,” it is not without central oversight. Control is exerted in three broad ways:
A. Central Banks: The Nerve Centers of Financial Power
Central banks are the most powerful financial institutions within countries, but their influence spills into global markets.
Key Functions
Set interest rates that influence global borrowing.
Control money supply and liquidity.
Stabilize inflation and currency value.
Act as lenders of last resort during crises.
Global Impact
When the Federal Reserve (US) raises or cuts rates, the effects cascade worldwide:
Global investors shift capital.
Emerging-market currencies rise or fall.
Commodity prices fluctuate.
Debt burdens in dollar-dependent nations increase or ease.
Similarly, the European Central Bank (ECB), Bank of England, and Bank of Japan impact global liquidity and yield curves.
In this sense, global finance is not only shaped by markets but by centralized monetary decisions from a handful of powerful institutions.
B. International Financial Institutions (IFIs)
These include:
International Monetary Fund (IMF)
World Bank
Bank for International Settlements (BIS)
Financial Stability Board (FSB)
Their Role in Central Control
1. The IMF
Provides emergency loans, sets macroeconomic rules, and monitors global financial stability. Countries receiving IMF support must often adopt conditions such as:
Fiscal tightening
Structural reforms
Currency adjustments
This creates a form of policy influence over sovereign nations.
2. The World Bank
Finances development projects and shapes the economic policies of emerging markets through program design and conditional funding.
3. The BIS
Known as the “central bank of central banks,” the BIS sets global banking norms through the Basel accords:
Basel I: Capital requirements
Basel II: Risk management
Basel III: Liquidity and leverage rules
These rules unify how banks operate across the world.
4. Financial Stability Board (FSB)
Coordinates global regulators and sets standards for the world’s largest banks and financial institutions.
C. Regulatory and Political Control
Global finance is also influenced by:
Government fiscal policies
Trade agreements
Sanctions and geopolitical decisions
Financial regulations (AML, KYC, FATF rules)
The Power of Sanctions
The U.S., EU, and UN often use financial sanctions to control, punish, or pressure countries.
Sanctions affect:
Banking access (SWIFT restrictions)
Global payments
Trade receipts
Ability to borrow internationally
This highlights how finance becomes a tool of geopolitical influence.
3. The USD-Centric Financial Order
The U.S. dollar is the anchor of global finance:
60% of global reserves
88% of all FX transactions
50%+ of global trade invoicing
This dominance gives the U.S. unparalleled financial power:
It influences global liquidity via Fed policy.
It controls access to dollar clearing.
It sets global borrowing costs.
It can impose financial sanctions with global impact.
In short, the dollar system is a centralized backbone of global finance.
4. Technology and the Future Centralization of Finance
Digital innovation is transforming financial control.
A. Central Bank Digital Currencies (CBDCs)
Many countries—including China, India, the EU, and the U.S.—are researching or piloting CBDCs.
Implications
Real-time monetary policy tools
Greater surveillance of transactions
More control over taxation and fiscal distribution
Potential reduction in cash usage
Cross-border settlement improvements
CBDCs strengthen central authority and expand the scope of financial oversight.
B. Digital Payments & Fintech Networks
Platforms like:
UPI (India)
PayPal
SWIFT gpi
Visa/Mastercard
RippleNet
Crypto exchanges
These networks process billions of transactions daily. While they make finance efficient, they also consolidate control within digital ecosystems.
C. Cryptocurrencies and Decentralized Finance (DeFi)
Crypto represents the opposite of central control:
No central intermediary
Blockchain-based transparency
Peer-to-peer value transfer
However, regulators are increasing oversight on:
Exchanges
Stablecoins
DeFi protocols
On- and off-ramps
This means even decentralized systems are gradually being integrated back into the centrally regulated financial order.
5. The Tension Between Free Markets and Central Control
Global finance operates under constant tension:
Free Market Forces
Capital flows to high-return markets.
Traders respond to price signals.
Currency values fluctuate.
Central Controls
Interest rate decisions
Capital controls
Sanctions
Regulatory requirements
Monetary interventions
The global system depends on maintaining a balance between these forces.
Too much freedom leads to speculative bubbles and crises.
Too much central control restricts innovation and creates financial rigidity.
6. Crises and the Need for Central Coordination
Major financial crises have shown why central coordination is essential:
1997 Asian Financial Crisis
Massive capital flight destabilized multiple economies.
2008 Global Financial Crisis
The collapse of U.S. mortgage markets triggered global recession.
2020 Pandemic Shock
Central banks injected unprecedented liquidity to prevent collapse.
During crises, free markets alone cannot stabilize the system—central intervention becomes indispensable.
7. The Direction of Global Finance Going Forward
The future will be shaped by three trends:
1. Increasing Centralization
CBDCs
Stronger regulatory norms
Coordinated global oversight
Tighter cross-border monitoring
2. Multipolar Financial Power
Rise of China’s yuan
India’s rapid economic growth
Regional currency arrangements
Asian, Middle Eastern, and African financial alliances
3. Hybrid Financial Models
Mix of centralized control (CBDCs, regulations) and decentralized innovation (blockchain, tokenized assets).
Conclusion
Global finance is a vast, interconnected system shaped by markets, institutions, and powerful central actors. Central banks, the IMF, World Bank, BIS, and regulatory bodies exercise significant control over capital movement, banking standards, and financial stability. At the same time, digital transformation—from CBDCs to fintech—will increase central oversight while creating new tensions with decentralized technologies like crypto.
In essence, global finance is both free-flowing and centrally influenced, a system where market dynamics meet institutional power. Understanding this balance is essential to understanding how the world’s economic engine truly works.
Emerging Markets and Capital Flows1. Understanding Emerging Markets
Emerging markets are economies transitioning from low-income, resource-driven systems to more advanced, industrialized, and service-oriented structures. They typically share the following characteristics:
Key Features
High economic growth rates compared to developed nations.
Rapid urbanization and industrial expansion.
Significant reliance on foreign investment to finance growth.
Developing but fragile financial markets—often shallow and prone to volatility.
Exposure to global economic cycles, interest rate changes, and commodity price shocks.
Growing consumer market, driven by rising incomes and demographic strength.
These characteristics make EMs attractive but risky destinations for global capital.
2. What Are Capital Flows?
Capital flows refer to the movement of money for investment, trade, or business production across countries. For emerging markets, capital flows are critical because they influence:
Exchange rates
Interest rates
Stock and bond markets
Inflation
Economic growth
Financial stability
Capital inflows bring liquidity and strengthen markets, while outflows pressure currencies and reduce investment capacity.
3. Types of Capital Flows in Emerging Markets
Global investors participate in EMs through several channels:
A. Foreign Direct Investment (FDI)
FDI involves long-term investments such as setting up factories, acquiring companies, or building infrastructure. It is the most stable form of capital because:
It creates employment
It brings technology
It enhances productivity
It is less likely to exit during short-term crises
Countries like India, Vietnam, and Mexico have become major FDI destinations due to manufacturing expansions and favourable government policies.
B. Foreign Portfolio Investment (FPI)
Portfolio flows include investments in:
Stocks
Bonds
Mutual funds
ETFs
These are short-term and highly sensitive to global interest rates, sentiment, and liquidity conditions.
FPI can rapidly enter during bullish periods and exit during uncertainty, making it the most volatile category of capital flows.
C. External Commercial Borrowings (ECB)
Corporates or governments borrow from international lenders to fund:
Infrastructure projects
Expansion plans
Government spending
While ECB helps meet capital needs, excessive borrowing increases external debt vulnerability.
D. Remittances
Large EMs like India, Philippines, and Mexico receive significant remittances from workers abroad. Remittances are stable, counter-cyclical, and support domestic consumption.
4. Why Do Capital Flows Move Toward Emerging Markets?
Global investors allocate funds to EMs due to:
1. Higher Returns on Investment
Emerging markets often offer:
Higher GDP growth
Better corporate earnings prospects
Attractive bond yields
In a low-yield world, EM assets become appealing.
2. Demographic Advantage
A young population drives consumption growth, expanding market opportunities.
3. Structural Reforms
Privatization, tax reforms, digitalization, and financial sector improvements attract long-term capital.
4. Commodity Cycles
Resource-rich nations (Brazil, Indonesia, South Africa) attract capital during commodity booms.
5. Currency Appreciation Potential
Investors earn not only from market returns but also from appreciating EM currencies during stable periods.
5. What Drives Capital Outflows from Emerging Markets?
While inflows bring optimism, outflows can trigger crises. Key drivers include:
1. Global Interest Rate Changes (Especially U.S. Rates)
When U.S. Federal Reserve raises interest rates:
Dollar strengthens
EM currencies weaken
Investors shift funds from EM to U.S. Treasuries
This “flight to safety” drains EM liquidity.
2. Financial Market Uncertainty
Events such as:
Emerging market debt crises
Stock market corrections
Currency depreciation
cause rapid portfolio outflows.
3. Geopolitical Risks
Wars, political instability, elections, sanctions, or policy unpredictability scare investors.
4. Commodity Price Volatility
Commodity exporters suffer when global prices fall, leading to foreign investor exit.
5. Strong U.S. Dollar
A rising dollar increases external debt burden for EMs and triggers outflows.
6. Effects of Capital Flows on Emerging Markets
Capital flows influence economic conditions in both positive and negative ways.
Positive Effects
1. Boosts Investment and Growth
Foreign capital funds:
Infrastructure
Manufacturing
Real estate
Technology
Financial markets
This accelerates economic development.
2. Supports Domestic Currency
Stable inflows strengthen the currency, reducing import costs.
3. Improves Financial Market Depth
Foreign investors increase liquidity in equity and bond markets, making them more efficient.
4. Enhances Global Integration
Capital flows link EMs to global markets, improving trade and investment relationships.
Negative Effects
1. Currency Volatility
Sudden outflows weaken the currency and may cause inflation.
2. Asset Bubbles
Excessive inflows inflate stock or real estate prices beyond fundamentals.
3. External Debt Vulnerability
Borrowing in foreign currency exposes countries to refinancing risk.
4. Financial Instability
Rapid outflows may trigger:
Banking crises
Balance of payment issues
Market crashes
Examples include the Asian Financial Crisis (1997) and the taper tantrum (2013).
7. Managing Capital Flows: Policy Tools for Emerging Markets
Emerging markets adopt a mix of strategies to handle capital flow volatility:
1. Foreign Exchange Reserves
Holding adequate FX reserves helps protect the currency during outflows.
2. Macroprudential Regulations
Governments may impose:
Limits on external borrowing
Controls on short-term capital
Banking sector leverage caps
These reduce systemic risk.
3. Flexible Exchange Rates
Allowing currencies to adjust absorbs external shocks.
4. Fiscal Discipline
Lower deficits improve investor confidence.
5. Encouraging FDI Over FPI
FDI is stable and long-term; EMs design policies to attract more of it.
6. Bilateral and Multilateral Financing
Partnerships with IMF, World Bank, or regional groups provide safety nets.
8. The Future of Capital Flows in Emerging Markets
As global financial systems evolve, several future trends are shaping the trajectory of capital flows:
1. Digitalization and Fintech Growth
Digital economies like India and Indonesia will attract tech-focused FDI.
2. Nearshoring and Supply Chain Shifts
Companies shifting production away from China will benefit economies like Vietnam, Mexico, and India.
3. Sustainable Investing
Green bonds and ESG funds are rising, diverting inflows to climate-friendly EM projects.
4. Rising Domestic Capital Markets
Local investors are becoming strong players, reducing dependence on foreign flows.
Conclusion
Emerging markets and capital flows are deeply interconnected. EMs depend on global capital for growth and development, while investors depend on EMs for higher returns. However, this relationship is inherently volatile. Inflows boost growth, strengthen currencies, and deepen financial markets, but outflows can cause instability, pressure exchange rates, and trigger crises.
Managing capital flows through sound policies, stable governance, and long-term reforms is essential for sustained growth. As the world undergoes technological transformation, shifting supply chains, and changing geopolitical dynamics, emerging markets will continue to be central to global investment flows—offering both opportunities and risks in equal measure.
7 votes for a rate cut on December 10?!As we approach the last monetary policy meeting of the year, scheduled for Wednesday, December 10, uncertainty remains high. The CME FedWatch tool now suggests a dominant probability of a 25-basis-point rate cut, but this probability can shift significantly from one day to the next depending on the lagging macro data that will be released before the Fed meeting on Wednesday, December 10.
The reason is simple: the decision no longer depends solely on macroeconomic data, but also — and above all — on the balance of power within the FOMC, the Federal Reserve’s deliberative body. For a rate cut to be approved, at least 7 votes out of the 12 voting members are required. Yet the Committee appears today deeply divided, both in its diagnosis and in its monetary policy preferences.
Economic data: a necessary but not sufficient factor
The upcoming PCE inflation figures, the Fed’s preferred inflation measure, will play a crucial role. If price dynamics remain under control, this would strengthen the argument for monetary easing. Moderate growth and signs of softening in the labor market also support such a move.
But despite these signals, the context remains ambiguous: several Committee members believe that disinflation is not yet firmly anchored, or that the risks of a rebound remain too high. Hence the lingering caution, even in the face of a market probability clearly leaning toward a cut.
A fragmented FOMC: the real source of suspense
It is truly the internal composition of the FOMC that makes the outcome of the meeting so uncertain. The Committee has rarely been so heterogeneous in its positions. The profiles fall into three groups:
1. The dovish camp, favoring swift easing.
Some members clearly support a cut, or even a larger adjustment. They believe inflation is slowing enough to reduce pressure on the economy.
2. The hawkish camp, opposed to an imminent cut.
For them, the Fed must remain vigilant, keep rates high, and avoid loosening policy too early at the risk of reigniting inflationary pressures.
3. The central camp, cautious, hesitant, and likely decisive.
These “neutral” or “slightly dovish” members will ultimately swing the vote.
Today, the distribution of opinions shows that only a few votes could tip the balance. Chair Jerome Powell, typically a consensus figure, has himself been notably cautious, which further complicates the reading of internal dynamics.
An open decision, despite market signals
In summary, even if the CME FedWatch assigns a majority probability to a rate cut on December 10, the political reality inside the FOMC calls for restraint. It is not just a matter of economic data but a delicate balance between divergent views within the institution.
For now, only one thing is certain: the slightest macroeconomic release and the slightest statement from a Fed member will immediately impact expectations. The final decision will be played out in the complex arena of the internal vote, where every voice will count.
DISCLAIMER:
This content is intended for individuals who are familiar with financial markets and instruments and is for information purposes only. The presented idea (including market commentary, market data and observations) is not a work product of any research department of Swissquote or its affiliates. This material is intended to highlight market action and does not constitute investment, legal or tax advice. If you are a retail investor or lack experience in trading complex financial products, it is advisable to seek professional advice from licensed advisor before making any financial decisions.
This content is not intended to manipulate the market or encourage any specific financial behavior.
Swissquote makes no representation or warranty as to the quality, completeness, accuracy, comprehensiveness or non-infringement of such content. The views expressed are those of the consultant and are provided for educational purposes only. Any information provided relating to a product or market should not be construed as recommending an investment strategy or transaction. Past performance is not a guarantee of future results.
Swissquote and its employees and representatives shall in no event be held liable for any damages or losses arising directly or indirectly from decisions made on the basis of this content.
The use of any third-party brands or trademarks is for information only and does not imply endorsement by Swissquote, or that the trademark owner has authorised Swissquote to promote its products or services.
Swissquote is the marketing brand for the activities of Swissquote Bank Ltd (Switzerland) regulated by FINMA, Swissquote Capital Markets Limited regulated by CySEC (Cyprus), Swissquote Bank Europe SA (Luxembourg) regulated by the CSSF, Swissquote Ltd (UK) regulated by the FCA, Swissquote Financial Services (Malta) Ltd regulated by the Malta Financial Services Authority, Swissquote MEA Ltd. (UAE) regulated by the Dubai Financial Services Authority, Swissquote Pte Ltd (Singapore) regulated by the Monetary Authority of Singapore, Swissquote Asia Limited (Hong Kong) licensed by the Hong Kong Securities and Futures Commission (SFC) and Swissquote South Africa (Pty) Ltd supervised by the FSCA.
Products and services of Swissquote are only intended for those permitted to receive them under local law.
All investments carry a degree of risk. The risk of loss in trading or holding financial instruments can be substantial. The value of financial instruments, including but not limited to stocks, bonds, cryptocurrencies, and other assets, can fluctuate both upwards and downwards. There is a significant risk of financial loss when buying, selling, holding, staking, or investing in these instruments. SQBE makes no recommendations regarding any specific investment, transaction, or the use of any particular investment strategy.
CFDs are complex instruments and come with a high risk of losing money rapidly due to leverage. The vast majority of retail client accounts suffer capital losses when trading in CFDs. You should consider whether you understand how CFDs work and whether you can afford to take the high risk of losing your money.
Digital Assets are unregulated in most countries and consumer protection rules may not apply. As highly volatile speculative investments, Digital Assets are not suitable for investors without a high-risk tolerance. Make sure you understand each Digital Asset before you trade.
Cryptocurrencies are not considered legal tender in some jurisdictions and are subject to regulatory uncertainties.
The use of Internet-based systems can involve high risks, including, but not limited to, fraud, cyber-attacks, network and communication failures, as well as identity theft and phishing attacks related to crypto-assets.

Big Money Never Lies — The Anatomy of a True Order Block Most traders think they know what an Order Block is…
until they compare a retail box with a true institutional footprint.
A real OB is never random.
It follows structure, volume, liquidity, and imbalance — and once you learn to read these signs, you’ll never look at charts the same way again.
This BTC example is a clean textbook case of a V-Shark Order Block:
high volume → displacement → imbalance → controlled pullback → perfect retest.
Let’s break it down.
1️⃣ Market Structure Comes First
Smart Money only leaves OBs in places where structure makes sense.
Here, the displacement candle breaks the previous range cleanly — a clear sign of intent.
No structure = no OB.
2️⃣ The Order Block (V-Shark OB)
The origin of the move shows:
A strong bullish displacement
Volume > 1.5× average
Prior opposite candles (2–10 bars) creating a liquidity pocket
A fresh imbalance left behind
No revisit of old structure until the retest
These five conditions make the zone a true OB — not just a retail rectangle.
3️⃣ The Imbalance (IMB)
That vacuum between wicks isn't noise.
It’s the footprint of aggressive institutional order flow.
IMB tells you speed + intention.
When price returns slowly into an IMB → that’s where Smart Money waits.
4️⃣ Volume That Confirms the Move
Notice how volume explodes on the breakout, then fades on the pullback.
That’s classic Smart Money behavior:
Volume spike = commitment
Weak pullback volume = no counterflow
Retest wick = liquidity grab
Retail sees randomness.
Institutions see opportunity.
5️⃣ The Retest OB
Price returns to the zone with:
Clean structure
Respect for the imbalance
No violation of liquidity levels
This makes the retest legitimate — a perfect textbook example of how Big Money enters positions quietly… before trends continue.
🦈 V-Shark Takeaway
Big Money never lies.
Their footprints are always on the chart:
Structure
Volume
Imbalance
Liquidity
Controlled retests
Once you understand these five elements, you stop guessing and start reading what institutions are doing.
If you want deeper breakdowns of V-Shark OB, Volume Logic, or IMB structure — drop a comment below and let’s decode charts together.
#BTC #Bitcoin #BTCUSD #OrderBlock #VSharkOB #SmartMoney #BigMoney #Volume #Imbalance #Liquidity #InstitutionalTrading #PriceAction #TradingEducation #Crypto #MarketStructure
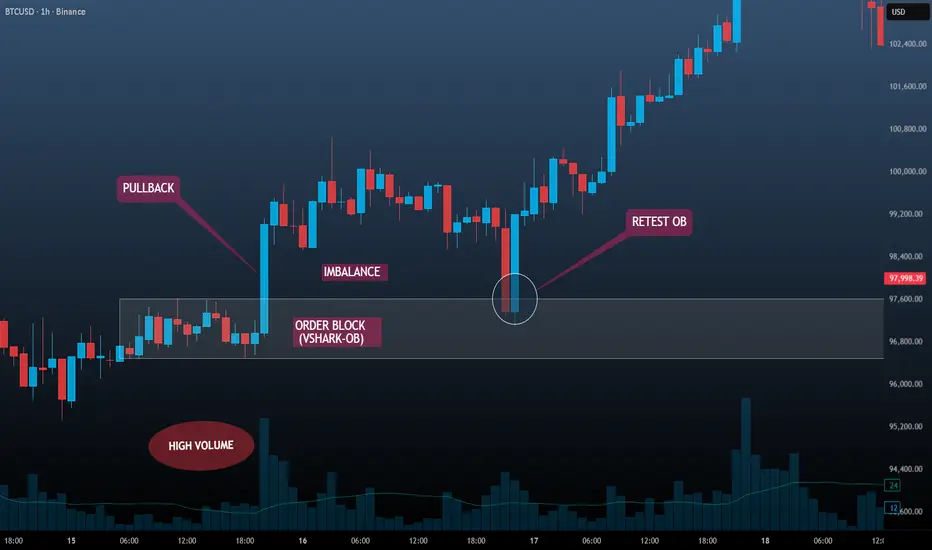
Practicing mind set..
I don't trade low TF, i'm not day-trading,, just boring, look and practicing mind set for fun. I show you how i find the price movements, key levels, sweet spots, ranking-price of the "play field". This is a "old school way" i used from year 1995 and recently.
I don't tell you when buy/sell, entry/exit, TP/SL.. you learn by yourself like i did by myself. Just look the chart and figure it out. Hope to help struggle traders.
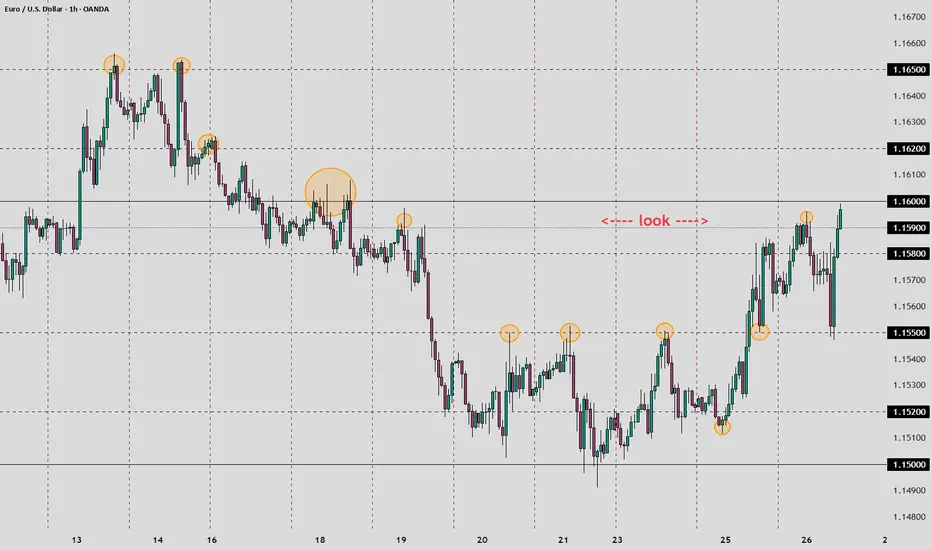
SMT secret smart money signal - All you need to knowHey whats up guys, in this post I want to show you how I use SMT divergence in my own trading to filter fake breaks and catch precise reversals. This is one of those things most traders never really dig into. Once you see it properly, you will not be able to unsee it.
It was popularized by ICT, but it is essentially Dow theory through a bit different perspective.
📌 What is SMT (Smart Money Tool )
It's a crack in correlation between two markets that normally move together.
One market takes the high or low. The correlated market does not. That difference is SMT divergence. And that why sometimes it's enough if only one instrument from those two highly correlated takes low and other doesn't.
Before SMT we need correlation.
Some markets like to move together. They will never be perfectly identical, especially on the lower timeframes, but the general swing structure is similar.
- EURUSD & GBPUSD
- AUDUSD $ NZDUSD
- XAUUSD & XAGUSD
- BTCUSD & ETHUSD
- NQ & ES & YM
You can find some more variations like EURJPY & GBPJPY etc.. But if you want to focus on precision your watchlist should contain just a few instruments. Not 20 unless you are position trader and your entry timeframe is Daily.
📌 Bearish SMT on positively correlated instrument's
One market makes a higher high. The other prints a lower high or equal highs.
📌 Bullish SMT. on positively correlated instrument's
One market makes a lower low. The other makes a higher low or equal low. 📌 Negative SMT Correlation
Its same only one pair is inverted which is DXY. We could say that in the Forex it would basically every currency with DXY. But No !!
‼️ Dont use DXY for correlation with AUDUSD and NZDUSD. Yes obviously they are affected by the DXY (Dollar) movement, but as these two are not included in the DXY. They are lagging. Yes at some point DXY affects them too, but just don't use them for the SMT. as SMT is like a quiet signal from smart money. One market shows the truth. The other is used as a trap. After this trap mostly sharp expansion happens. Its a signal for a timing that its ready.
📌 EURUSD and GBPUSD Example
GU - just shallow manipulation but creates clean OB
EU - Deeper manipulation but OB created later. ‼️ SMT is not a strategy
On its own that does not give you an edge. The key is what it says about the willingness of big players to push price. If DXY runs above a previous highs and EUR and GBP refuses to take out its opposite lows , that is lack of commitment to continue that move. Someone is offside. Dumb money sells late or buys late, smart money quietly positions on the other side.
📌 EURUSD and DXY Example
DXY makes higher high above monthly highs, EUR fails to take lows. Correlation disconnected. EUR is stronger and if its within CLS range reversal can occur. what does GBP at the same moment? also failed to make a lower low hence is stronger than USD. If it aligns with the strategy reversal is confirmed.
📌 This is how I traded this setup below.👇 Click to the chart to see how it played out 📌 SMT is a way to read who is actually in control. It helps me see if a break of structure is real continuation or just a liquidity raid dressed as a breakout.
📌 Where to use it for efficiency
You can find small SMT differences all day on lower timeframes. Try to trade every one and you will bleed slowly. I care about SMT only at important areas.
- CLS ranges - Weekly , Monthly , Daily
- Previous week low, previous week high, clear swing extremes.
- Key levels from my higher timeframe analysis
- HTF Fair value gaps and order blocks that fit my narrative.
📌 XAU & XAG Example
Both in the uptrend and created nice CLS range. Gold made a just shallow manipulation but is it enough ? Let's have a look to the silver we can see that silver made much deeper manipulation so it can confirm our Gold trade. Also notice that how exactly after the temporary correlation disconnection the expansion move started. These disconnections are trap and mostly followed by strong expansion move. 📌 Here is the setup I posted here and traded 👇 📌 Which pair I choose to trade
When I see SMT between two correlated markets, I decide which one I want to use.
The weaker market is the one that takes the high or low and disrespects the level. That is where late traders are stuck. This market has advantage for tight stop just beyond the stop hunt.
⁉️So which one would you chose on the SMT signal bellow the range ?https://www.tradingview.com/x/8pWYJbLP/ let me know in the comments.
The stronger market is the one that respects the level and refuses to sweep the extreme and you need to have conviction in the HTF trend so you can confidently place SL below un-manipulated lows. This one usually respects fair value gaps and order blocks better and often gives cleaner candles and stronger pushes.
📌 SMT Fills
Two correlated markets are moving together. One fills its fair value gap, the other leaves a part of it open. That difference can give you an extra reason for a reaction. It is like one chart did the work of cleaning up inefficiency, the other did not, and price tends to respect the one that is cleaner.
📌 BTC & ETH Timing and Gap fills
We can see SMT on the top where BTC made higher highs but ETH failed to do so = crack in correlation. Now focus on ETH it has created on Order block which signaled reversal, while BTC didnt had it yet = Your advantage seeing what is not seen yet.
📌 GAP fills
Look at the FVG on the BTC it was not filled fully and BTC made higher high, while ETH filled gap full and made lower low. Also BTC gave you Order block while ETH not yet again you have
📌 The SMT trap and how I avoid it
A lot of traders get hurt by SMT because they treat it like a magic reversal button.
They see euro taking a low and dollar failing to take a high, or Bitcoin taking a high and Ethereum failing to match it, and they jump in without any extra confirmation. Sometimes it works. Many times price just keeps pushing, prints another leg, and wipes them out.
Use it only at specific levels to confirm your strategy and give you extra edge in seeing confirmation on highly corelated pairs before it plays out.
SMT alone never gives me permission to trade. I want at least one strong confirmation candle at my level and, for bigger trades, a clear Change in order flow.
Adapt useful, reject useless.
David Perk - Aka Dave FX Hunter

How to Calculate Lot Size for Trading XAUUSD on TradingView
Very few people know that there is a free position size calculator for any trading instrument and, of course, for GOLD on TradingView.
It is absolutely free , it does not require a paid subscription, and it can be used to measure position size for XAUUSD trading for any account size, leverage and broker.
In this article, I will teach you how to calculate lot size for your XAUUSD trades in 3 simple steps.
Set It Up
The first step will be to simply create a free TradingView account.
Then open Gold price chart and find a trading panel.
It will be at the bottom of the screen.
Click " expand " in the right corner.
In the suggested options, choose TradingView Paper Trading and click " Connect ".
In paper trading window, click " create an account ".
Choose the account balance, leverage and commissions exactly as you have with your real gold trading account.
And now your best free gold position size calculator is ready .
How to Use It
Once you found a trading setup, know the exact stop loss level and your desired risk per trade.
Let's imagine that we want to buy Gold now.
To calculate the best lot size for our trade, we should know the exact level of our Stop Loss.
Let's take 2770 level for the sake of the example.
Right-click on that chart and choose " trade " and " create new order " then.
The window that will appear on the right side of the chart. It will be your lot size calculator on TradingView.
Select " stop loss " checkbox and input the desired risk percentage for a trading position.
Let's take 1% as the example.
In the price field, input the exact price level of your stop loss : 2770 in our case.
In Gold XAUUSD, trading 1 standard lot equals 100 units/ounces.
Your lot size will be based on the number of units.
Take that number and divide it by 100.
In our case, we have 54 units.
Our lot size will be 54 dived by 100 or 0,54.
That will be your lot size for the Gold trade.
What I like about TradingView position size calculator is that once you set your default parameters, the only thing that you need to adjust for the measurement of a lot of size is the level of stop loss of your Gold trading position.
If you use TradingView for charting, it will be very convenient for you to use it.
❤️Please, support my work with like, thank you!❤️
I am part of Trade Nation's Influencer program and receive a monthly fee for using their TradingView charts in my analysis.
The Truth About Timeframe Analysis – Chapter 2FAFO – F*-AROUND-FIND-OUT FRAMEWORK”**
If timeframes misalign, the market punishes you — every single time.
1️⃣ Trend / Impulse Check
Last impulse >2× previous → momentum, not trend.
Momentum alone = FAFO
Check last candles → volume continuation or fade
Context decides survival.
2️⃣ Zones Only Count With Confluence
Align with:
✔ Trend
✔ HTF
✔ Clean break/retest
✔ Rejection candle
✔ Multiple TFs clean
No confluence = decoration, ignore.
3️⃣ Candles = Evidence, Not Setups
Single candles ≠ signal
Must fit context + confluence
Wrong context → FAFO
4️⃣ Confluence = Survival
2 variables aligned + 1 neutral = potential
Any contradiction = dead setup
No guessing. No opinions.
5️⃣ Timeframe Conflicts → Wait
H1 bullish, M15 bearish → NO TRADE
Waiting = capital protection, not inactivity
Force a trade → FAFO
6️⃣ Context = Weapon
Strong trend + HTF resistance + fading volume = conflict → do not trade
Market shakes out amateurs here
Respect context or get cleaned
7️⃣ Golden Rule
Never trade against HTF unless MTF confirms reversal:
✔ Structure shift
✔ Volume shift
✔ Rejection candle
✔ Alignment
Trade anyway → RR small, execution precise
8️⃣ 10-SECOND CLASSIFICATION CHECK
HTF → bullish / bearish / conflict
MTF → aligned / challenging / opposite
LTF → entry / noise
Zone → fresh / retested / dead
Candle → supportive / neutral / invalidation
Confluence → 2 aligned + 1 neutral = tradeable
Contradiction → NO TRADE
9️⃣ FAFO Examples
Bearish M15 at HTF demand = FAFO
Momentum into dead zone = FAFO
Giant candle in consolidation = FAFO
10️⃣ Rule Stack
HTF owns the market
MTF decides opportunity
LTF executes only
Two variables aligned = potential
One contradiction = dead setup
Momentum ≠ trend
Zones need confluence or they don’t exist
Trends You Must Know1. Artificial Intelligence and Automation
Artificial Intelligence (AI) continues to dominate global technological advancements. AI-driven solutions are transforming industries ranging from healthcare to finance, logistics, and marketing. Machine learning algorithms can analyze massive datasets to provide insights, detect patterns, and automate decision-making. In business, AI-powered chatbots, virtual assistants, and predictive analytics tools are becoming indispensable for efficiency and customer engagement.
Automation extends beyond digital processes into physical systems. Robotics and smart manufacturing have revolutionized production lines, improving productivity while reducing human error. The growing adoption of AI in creative industries, like AI-generated content, design, and music, is redefining the boundaries of human-machine collaboration. For professionals, understanding AI trends and developing AI literacy has become crucial.
2. Green Technology and Energy Transition
Climate change concerns are accelerating the shift toward renewable energy and sustainable technologies. Governments and corporations are heavily investing in solar, wind, hydro, and hydrogen energy. Energy storage solutions, like next-generation batteries, are crucial for mitigating the intermittent nature of renewables.
Electric vehicles (EVs) are another hallmark of this trend. Automotive giants and startups alike are transitioning from internal combustion engines to fully electric fleets. Beyond transport, green technology extends to sustainable agriculture, water management, and circular economy models where waste is minimized, and resources are reused efficiently.
Companies that adopt sustainable practices often gain market credibility, attract investment, and comply with tightening environmental regulations. For consumers, supporting green products is both a personal choice and a statement on social responsibility.
3. Digital Currency and Blockchain Technology
Cryptocurrencies and blockchain technology have moved from speculative assets to core components of global finance. Central Bank Digital Currencies (CBDCs) are being explored by multiple countries as a means of faster, more secure, and transparent financial transactions. Cryptocurrencies, despite volatility, continue to influence global markets, especially in decentralized finance (DeFi) applications like lending, borrowing, and smart contracts.
Blockchain technology extends beyond finance. Supply chain management, healthcare records, intellectual property, and voting systems are being reimagined with decentralized, tamper-proof ledgers. Understanding blockchain trends is critical for businesses seeking security, transparency, and efficiency in a connected world.
4. Remote Work and the Future of Work
The COVID-19 pandemic permanently altered the work landscape. Remote work, hybrid offices, and digital nomadism are no longer temporary arrangements but standard practices in many sectors. Organizations are adopting digital collaboration tools, cloud platforms, and virtual meeting technologies to support distributed teams.
Alongside this, skills development is evolving. There’s a rising emphasis on digital literacy, adaptability, creativity, and emotional intelligence. AI and automation are also reshaping job roles, eliminating repetitive tasks while creating demand for high-level cognitive skills. Employees and organizations must continuously upskill to remain competitive.
5. Health and Wellness Revolution
The health and wellness industry is undergoing significant transformation. Personalized healthcare, driven by genomics, AI diagnostics, and wearable devices, is empowering individuals to monitor and manage their health proactively. Telemedicine has made healthcare accessible beyond traditional clinic walls, especially in remote areas.
Mental health awareness has gained unprecedented recognition. Companies are investing in employee well-being programs, and wellness apps offering meditation, sleep tracking, and stress management are booming. Nutrition, fitness, and preventive medicine are now integral to lifestyle choices, reflecting a global shift toward holistic health management.
6. Data Privacy and Cybersecurity
As digitalization increases, so does the threat of cyberattacks and data breaches. Consumers and regulators are demanding greater accountability for how personal information is collected, stored, and used. Laws like GDPR in Europe and similar regulations worldwide have raised the stakes for data privacy compliance.
Cybersecurity trends include AI-driven threat detection, zero-trust architectures, and blockchain-based security solutions. Organizations that fail to prioritize cybersecurity risk reputational damage, financial loss, and regulatory penalties. Being aware of these trends helps businesses and individuals protect sensitive information in an interconnected world.
7. Social Media Evolution and Content Consumption
Social media platforms continue to evolve, influencing communication, marketing, politics, and culture. Video content, short-form stories, and live streaming dominate user engagement. Platforms leveraging AI for personalized recommendations enhance content discoverability but also raise concerns about algorithmic biases and misinformation.
Influencer marketing, creator economies, and subscription-based content models are redefining digital entrepreneurship. Brands and individuals must adapt to constantly changing algorithms, user behaviors, and monetization models to stay relevant.
8. Global Economic Shifts and Geopolitics
The global economy is undergoing significant transformations. Emerging markets are growing faster than developed economies, creating new opportunities and risks. Currency fluctuations, trade wars, and supply chain disruptions highlight the importance of geopolitical awareness for businesses and investors.
The de-dollarization trend, with countries exploring alternatives to the US dollar for international trade, signals a possible shift in global financial dominance. Understanding macroeconomic trends, international relations, and regional power dynamics is vital for making informed business and investment decisions.
9. Education and Lifelong Learning
Education is no longer confined to classrooms. Online platforms, micro-credentials, and skill-based courses are democratizing learning worldwide. AI-driven personalized learning systems are improving engagement and outcomes, while virtual and augmented reality tools are making immersive education possible.
Lifelong learning is becoming a necessity rather than a choice. Rapid technological changes require individuals to continuously acquire new skills to remain employable and competitive. Understanding the evolving educational landscape is critical for students, professionals, and educators alike.
10. Cultural and Lifestyle Trends
Cultural shifts influence consumer behavior, workplace dynamics, and social interactions. Minimalism, conscious consumption, and the pursuit of experiences over material possessions are gaining traction. The global rise of diverse and inclusive representation in media, fashion, and corporate policies reflects a broader societal trend toward equity and awareness.
Travel, entertainment, and leisure industries are also evolving with digital experiences, augmented reality gaming, and metaverse explorations. Being aware of cultural and lifestyle trends helps businesses align their offerings with the values and expectations of modern consumers.
Conclusion
Staying ahead of trends is crucial for individuals, businesses, and governments in a world defined by rapid technological, economic, and cultural shifts. From AI and green technology to digital currencies, health innovations, and global economic transformations, these trends are reshaping how we live, work, and interact. Those who understand and adapt to these changes are more likely to thrive in a complex, interconnected future. Knowledge of trends isn’t just about keeping up—it’s about positioning oneself strategically in a world of constant evolution.
