BTCUSD Holds Buyer Zone - Push Toward 96,700 LikelyHello traders! Here’s my technical outlook on BTC/USD based on the current market structure. After a prolonged decline, Bitcoin reversed from the Support Level and broke out of the downward channel, shifting momentum in favor of buyers. The price then moved into a consolidation Range, where accumulation formed before a confirmed Breakout pushed BTC higher. Since then, Bitcoin has been respecting the rising Triangle Support Line, forming higher highs and higher lows. Buyers consistently defend this structure, keeping the bullish trend intact despite local corrections. Currently, BTC is holding above the 90,500–88,800 Buyer Zone, which serves as the key demand area maintaining bullish pressure. As long as the price stays above this zone, the upward scenario remains valid. The market is now heading toward the major 96,700 Resistance Level, located inside the broader Seller Zone. A breakout above this level may open the door for further continuation, while rejection could trigger a pullback toward the Triangle Support Line. For now, the structure favors buyers, with 96,700 as the main upside target. Please share this idea with your friends and click Boost 🚀
Community ideas

Bitcoin Approaches Key Resistance and Prepares for Its Next MoveHi everyone, Domic here!
This week, the market has provided enough support for Bitcoin to recover, but not enough of a catalyst for a true breakout. The Fed’s 0.25% rate cut continues to favor risk assets, yet investors remain cautious ahead of the December 16 Nonfarm Payrolls report. If labor data weakens, expectations for further rate cuts will rise — a direct tailwind for BTC. On the other hand, an overly strong report could trigger selling near dynamic resistance zones such as the EMA34.
On the news side, the crypto market is lacking major catalysts: no new ETFs, no sudden inflows, and no events on the scale of a halving. Because of that, BTC’s current recovery is driven more by technical factors than by news.
Technically, BTC has bounced from the 86,000–88,000 zone with a clear set of bullish signals: long lower wicks, improving volume, and solid absorption of selling pressure. Price is now testing the EMA34 around 93,846 — a level where BTC has been rejected multiple times since October. This is a crucial “checkpoint,” and if price closes above it on the daily chart, the trend structure will shift significantly. The next target would be the EMA89 near 101,023 — considered the final line of defense for the long-term downtrend. A breakout above EMA89 would almost confirm a new bullish cycle.
In the main scenario, I expect BTC to face mild rejection at the EMA34 and pull back to the 90,500–91,500 zone to gather liquidity before attempting another push. If buyers defend this area well, BTC could break above 94,000 and move toward 96,500 – 98,000 – 101,000, with 101,000 (EMA89) being the decisive level that would open the door to a true “acceleration phase.”

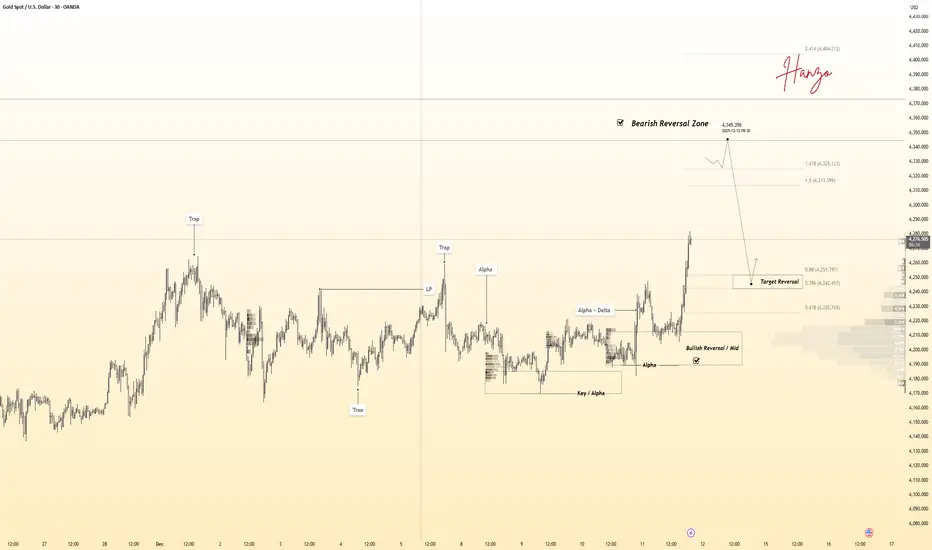
Gold 30Min Engaged ( Bearish Volume Reversal entry Detected )⚡Base : Hanzo Trading Alpha Algorithm
The algorithm calculates volatility displacement vs liquidity recovery, identifying where probability meets imbalance.
It trades only where precision, volume, and manipulation intersect —only logic.
✈️ Technical Reasons
/ Direction — SHORT / Reversal 4345 Area
☄️Bearish rejection confirmed through sharp candle body.
☄️Lower-high forming beneath resistance supply region.
☄️Volume decreasing confirms exhaustion in price rally.
☄️Sellers regained imbalance with heavy top rejection.
☄️Algorithm detects fading demand and shift to control.
⚙️ Hanzo Alpha Trading Protocol
The Alpha Candle defines the day’s real control zone — the first battle of momentum.
From this origin, the Volume Window reveals where the next precision strike begins.
⚙️ Hanzo Volume Window / Map
Window tracked from 10:30 — mapping true market behavior.
POC alignment exposes institutional bias and breakout potential zones.
⚙️ Hanzo Delta Window / Pulse
Delta window monitors real buying vs. selling power behind each move.
Tracks volume aggression to expose who controls the candle — buyers or sellers.
When Delta aligns with Volume Map, momentum becomes undeniable.
Dow Jones: Potential Explosive Move!Hey Traders,
In today's trading session we are monitoring US30 (Dow Jones) for a buying opportunity around the 48,400 zone. The index is trading in a strong uptrend and is currently in a correction phase, approaching the trend area at 48,400 support and resistance.
Trade safe,
Joe.

EURUSD: Sellers Drive Pullback - 1.1670 Support in FocusHello everyone, here is my breakdown of the current EURUSD setup.
Market Analysis
EURUSD remains in a broader bearish structure, and the recent price action is unfolding within a clear downward context. After moving through a prolonged range phase, the pair broke lower and continued to respect the descending trend line, confirming sustained selling pressure. Price later formed a Triangle Support Line, where buyers attempted to reverse the trend, leading to a breakout above the trend line and a retest of the Support Zone around 1.1670. However, after this retest, EURUSD quickly reached the major 1.1760 Resistance, which has repeatedly acted as a strong reaction zone. From this level, a sharp rejection occurred, showing that sellers are still firmly active and protecting this resistance area.
Currently, the market is pulling back from the Resistance Zone and heading back toward the Support Zone, where the ascending structure meets previous breakout levels.
My Scenario & Strategy
My scenario is bearish as long as EURUSD remains below the 1.1760 Resistance and continues to move away from this rejection zone. I expect the price to pull back toward the 1.1670 Support, where the next reaction will determine short-term direction.
Therefore, a clean breakdown below the 1.1670 Support Zone would confirm further bearish continuation and open the path toward lower levels. However, if the pair tests the support and shows a strong bounce, a short-term recovery toward the trend line may occur — but the bearish outlook remains valid while price stays under the 1.1760 Resistance. For now, the market favors sellers, with the key objective being a move back into the Support Zone around 1.1670.
That's the setup I'm tracking. Thank you for your attention, and always manage your risk.

INTERVIEW: EXCAVO View 12/12/25In my previous post, I invited you to ask any questions you had about the current market, the cycle structure, Bitcoin dominance, altcoins, timing, and everything in between.
You asked - and here are the detailed answers.
This is the continuation of our interview series.
I have taken every question from the comments, grouped them under your usernames, and provided full, transparent explanations based on my current market view.
Let's dive in.
@just5
Q:
Why do you say the bear market started in November? If it started earlier, why not in October?
Where does the 126k top come from?
Why is Bitcoin dominance so high?
Why haven't many altcoins (ETH, SOL) broken their previous highs? How far can they fall?
Your analysis is based on past cycles and fractals. Do you admit you can be wrong?
A:
I do not define the beginning of a bear market strictly by the date of the absolute top. For me, the trigger is the structure on the weekly timeframe. The formal high was reached in October, but the signal that confirmed the start of the bear phase was the first strong red weekly candle, which appeared in November. That is why I mark November as the beginning of the bear market.
The 126k level is not something random - the market simply traded there (around 126,250 USD depending on the exchange). So the level itself is not in question.
As for Bitcoin dominance - it is very simple. We have one main instrument in the market: BTC. It defines the weather for the entire crypto market.
When BTC rises, some alts rise and others lag.
When BTC falls, everything falls - especially assets with weaker liquidity or fundamentals.
Historically, people traded a lot of alt/BTC pairs. Many even believed altcoins were created mainly to accumulate more BTC. Today this logic still works: liquidity and attention gravitate toward Bitcoin, which naturally leads to high dominance.
Regarding ETH and SOL: I honestly expected ETH to break its previous ATH. On SOL, I have written a separate idea (I will attach the link) where, back when ETH was around $1700 and SOL was around $150, I already said that between these two I prefer ETH because cycles matter. Above $200-250 on SOL and $4900-5000 on ETH there is a large liquidity cluster. The market will eventually go there, but the question is when. This expectation kept many people in top altcoins without taking profit.
How far can altcoins fall?
My baseline scenario is a 50-60% correction from their peaks, and that is the minimum. Crypto cycles often surprise with deeper drawdowns.
Regarding the fractal and cycle approach - yes, my view is based on previous cycles. But of course, I admit that I can be wrong. If I am wrong, I will acknowledge it publicly. TradingView does not allow deleting ideas, everything stays visible, so everyone can judge my track record objectively.
@louistran_016
Q:
If the 41% drop (126k -> 75k) happened in 2 months, why would the move to 60k take another 10 months?
Is the 60k downside target too high?
Is September 2026 too late for a market bottom?
If the previous bottom in 2022 was at the 100-month EMA (around 16k), should not the next bottom be around 44k?
A:
I never said the drop to 60k must take 10 months. The chart is not obligated to move like "stick down -> stick up". We have only two axes: price and time.
The market can:
drop quickly,
then consolidate,
then spend months accumulating before the next move.
Even if we hit 60k in 3 months, it does not mean the market will immediately reverse. Accumulation can take time.
The 60k target is indeed a "high" bottom for a bear market because it is only about a 50% correction from the peak. I do not exclude deeper scenarios: 60-65-70% drawdowns are normal for crypto. But even 60k is a much better long-term buying zone than 90-100k or current prices.
September 2026 is not "too late" in my view. It aligns well with the classical cycle structure: distribution -> decline -> depression -> accumulation.
Regarding the 44k idea based on the 100-month EMA:
It is absolutely possible. I do not rule it out. But tactically, I first target the 60-64k zone and then will reassess whether deeper levels become realistic.
@ikkie
Q:
Many people are calling this a bear market. Is that a bad sign?
A:
What I actually see is many influencers publicly questioning whether this is a bear market because they did not exit in time, and now it is hard for them to admit it to their audiences.
The fact that many people call it a bear market is completely normal. The real question is not how people label the market, but what you do with your money.
Being out of the market is also a position, sometimes the best one.
When price enters a transition phase, staying flat can be a very strong decision.
@luaselene
Q:
What about ETH?
A:
ETH has a large liquidity zone above $4900-5000. I expect this region to be taken in one of the future bullish phases, but not in the near future. More realistically, this is a 2026-2027 story. Within the current part of the cycle, I do not expect ETH to sustainably break the ATH.
@mpd
Q:
I expect a retest of 100k before a crash to 35k. Thoughts?
A:
A very realistic scenario.
A retest of 100k is the perfect psychological trap:
it attracts the last wave of euphoric buyers,
it loads the market with long positions (usually with leverage),
and then the market can wipe them out with a deeper drop, even toward your 35k target.
Crypto loves this pattern: round number -> FOMO -> leverage -> liquidation.
@KoDPrey
Q:
Why should the drop to 70k lead to a long correction instead of being a quick liquidity sweep before a move to 150-200k?
Why do you think this cycle repeats previous ones?
Can BTC dominance reach 70% in a bear market?
Aren't we in the middle of a bull market?
If you were wrong on PORTAL longs, can you also be wrong about the entire cycle?
A:
I do not think the drop to 70k must be a simple wick with an instant reversal. Historically, Bitcoin cycles include a depression phase where people lose hope, liquidity gets washed out, and even long-term holders capitulate.
After this phase, a move toward 150-200-250k makes much more structural sense.
A simple "drop -> instant all-time-high" scenario resembles the old "supercycle" meme. Possible? Maybe. Likely? In my view - not now.
This cycle is indeed different:
almost no broad altseason,
many more participants, institutions, and countries involved,
much more infrastructure that can liquidate traders' positions,
more derivatives, more leverage, more points of failure.
But Bitcoin's macro-cycle structure is still fractally consistent.
The shapes and speeds change - the logic does not.
Can Bitcoin dominance hit 70%?
Yes. In crypto anything is possible. I consider this scenario totally realistic, even within a bear market.
Are we in the middle of a bull market?
In my view - no. I do not think we are anywhere near the middle of a bull run.
Regarding PORTAL: yes, I was wrong. And not only there, I have been wrong many times. But even with those mistakes, I closed my positions, exited both spot and margin, and avoided much deeper drawdowns.
Of course I can be wrong about the cycle. I am sharing my view, not claiming infallibility. My win rate is far from perfect, and every idea remains public on TradingView. Anyone can check them later.
@houari14
Q:
What do you think about the USDT Dominance index (USDT.D)? Is it reliable?
A:
Honestly, I barely use USDT.D in my analysis. Yes, it shows whether market participants prefer sitting in stablecoins or taking risk, but for me it is not a primary metric.
I focus more on:
BTC price,
market structure,
dominance of BTC itself,
volume behavior,
and how major altcoins react.
@anatta_
Q:
How far can BTC fall in this bear market?
How long will the bear market last?
If BTC holds 80-85k for a few months, can it start a new bull cycle?
A:
I expect at least a 50% correction from the top. Realistically, 60-65-70% drawdowns are absolutely possible. More than 75% I do not consider my baseline, but in crypto nothing is impossible.
Regarding duration:
My estimation is that the bear market should end toward late 2026. Around September 2026 I expect a major bottom, a zone where long-term accumulation becomes attractive.
If BTC holds 80-85k for a few months, yes, theoretically it could trigger a new bullish phase, especially if a strong new narrative appears. But I am not betting on that scenario. I prefer staying out of the market until the cycle structure becomes clear.
@tommayhew
Q:
Is there a connection between the recent Cloudflare security incident and the crypto drop?
A:
The timing was surprising, and it is natural to link the two events. But at this moment I do not see solid evidence that the incident caused the market drop. Maybe more information will appear later, but for now I treat it as a coincidence rather than a catalyst.
@simplejoe1
Q:
We already have ETFs and a pro-BTC U.S. president. Could this be the absolute top?
A:
ETFs and a pro-Bitcoin president do not automatically guarantee continuous growth, nor do they define the market top.
The president also has:
his own memecoin, check how its chart looks,
his own crypto-investing fund, check its token too.
These examples show that one person, even the U.S. president, does not determine the entire market. The market is bigger and more complex than a single headline.
Best regards,
EXCAVO
Volume Do Not Predict Price! - It Explains It!Most traders look at volume the wrong way.✖️
They expect volume to tell them where price will go next.
But volume’s real job is much more important:
Volume explains why price moved the way it did.
If you learn to read volume correctly, price action becomes clearer, not noisier.
1️⃣ Price Up + Rising Volume = Commitment
When price moves higher and volume expands, it means buyers are committed, not just reacting.
This is not random buying.
This is participation.
📈Rising volume during an impulse confirms that the move is supported by real interest, not just thin liquidity.
Strong trends are built on expanding volume.
2️⃣ Price Up + Falling Volume = Warning
When price continues higher but volume dries up, something changes.
The move still exists... but conviction doesn’t.
This often signals:
- exhaustion
- a potential pause
- or an upcoming correction
That’s when professionals stop chasing and start managing risk.
3️⃣ Sideways Price + Rising Volume = Accumulation or Distribution
This is where most traders get confused:
Price isn’t moving much, but volume is increasing.
That’s not boredom.
That’s positioning.
Large players don’t chase price.
They build positions quietly while price looks “dead.”
Breakouts that follow these zones tend to be fast and decisive, because the work was already done.❗️
4️⃣ Breakouts Without Volume Are Suspect
A breakout candle looks exciting.
But without volume, it’s just a move, not a decision.
Low-volume breakouts often lead to:
- fakeouts
- traps
- fast reversals
🏹Volume doesn’t need to explode... but it needs to confirm participation.
💡The Big Picture
Volume is not a signal by itself. It’s context.
Price tells you what happened, while Volume tells you how serious that move really was.
✔️When price and volume agree, trades feel easy.
✖️When they disagree, something important is hiding underneath.
⚠️ Disclaimer: This is not financial advice. Always do your own research and manage risk properly.
📚 Stick to your trading plan regarding entries, risk, and management.
Good luck! 🍀
All Strategies Are Good; If Managed Properly!
~Richard Nasr

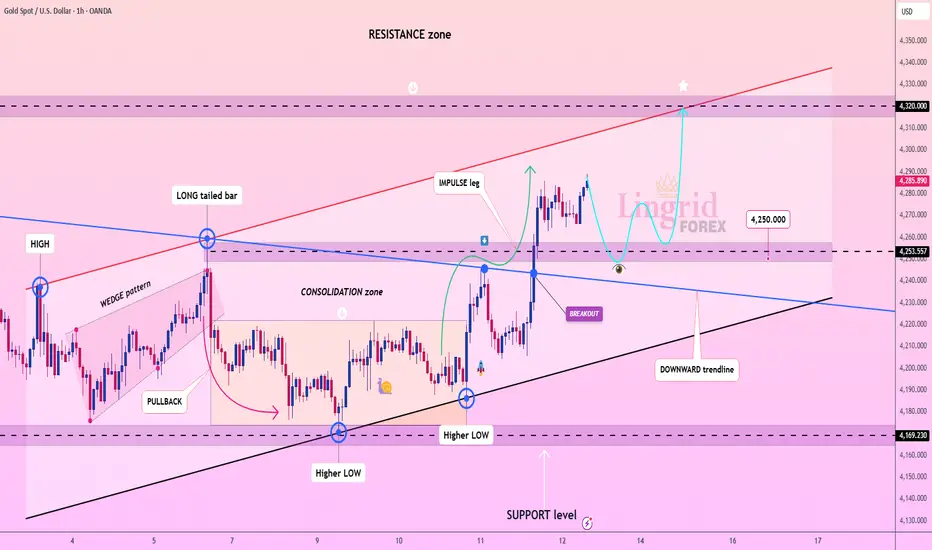
Lingrid | GOLD Possible Price Acceleration After Range BreakOANDA:XAUUSD perfectly played out my previous trading idea . Price could be transitioning from pullback into continuation, following a clean expansion above the prior consolidation zone. The recent surge developed after a series of higher lows along rising support, while the breakout candle shows strong follow-through rather than exhaustion. Price behavior suggests the earlier pullbacks were corrective pauses, not distribution.
If buyers continue to defend the 4,250 demand pocket and volatility remains compressed above the former ceiling, TVC:GOLD may extend toward the upper channel boundary around where supply previously emerged. That zone may act as the next reaction point as momentum stretches.
➡️ Primary scenario: hold above 4,250 → advance toward 4,320.
⚠️ Risk scenario: a sustained slip below 4,235 may weaken bullish structure and reopen the 4,170 support area.
If this idea resonates with you or you have your own opinion, traders, hit the comments. I’m excited to read your thoughts!
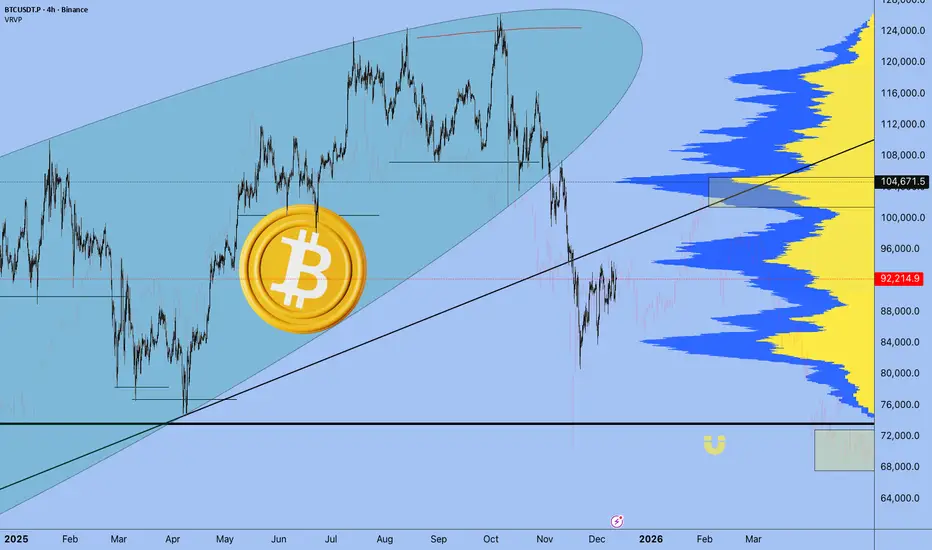
Bitcoin - Can the ascending triangle be broken?Introduction
Bitcoin is currently consolidating within a well-defined structure after weeks of volatile movement. Despite several failed attempts to break higher, the market continues to compress just beneath a major resistance zone. This type of tightening price action often signals a larger move approaching, as liquidity begins to build on both sides of the range. The chart highlights two key elements that will likely determine BTC’s next direction: the ascending triangle formation and the liquidity level resting below current price. Understanding how price reacts to these areas will be essential for anticipating the next significant impulse.
Ascending Triangle
BTC is forming an ascending triangle pattern, characterized by rising lows meeting a relatively horizontal zone of resistance. This resistance band, highlighted on the chart, has repeatedly capped upward attempts. Each time BTC pushes into the zone, it is met with selling pressure, but the higher lows reveal that buyers are steadily gaining ground. This pattern typically suggests accumulation and a potential bullish breakout once enough pressure builds.
If BTC can break above the upper boundary of this triangle with strength and volume, the move would likely target higher liquidity pools above recent highs. Such a breakout often leads to an impulsive leg upward, as trapped short positions are forced to cover and momentum buyers join in. For now, the ascending trendline remains a key structural support that defines the bullish side of this pattern.
Liquidity Level
Below the current range lies a clear liquidity zone, created by a cluster of equal lows and untested downside levels. This area is marked on the chart and represents where stop-loss orders and resting liquidity are likely positioned. Markets often revisit such zones before making a decisive breakout, particularly in triangle structures where liquidity builds on both sides.
A sweep of this liquidity, combined with a tap into the ascending trendline, would be a textbook setup for buyers to step back in. If BTC dips into this zone and rebounds strongly, it would further strengthen the market structure and increase the likelihood that the eventual breakout takes place to the upside. However, if this liquidity level fails and price breaks below the trendline, the bullish structure would be invalidated, opening the door for a deeper move down.
Final Thoughts
BTC is approaching a decision point, with price tightening inside an ascending triangle while liquidity pools gather below. As long as the ascending trendline continues to act as support, the market maintains a bullish bias, and a breakout above the resistance zone becomes increasingly likely. Still, a liquidity sweep to the downside before any major rally remains a strong possibility. Traders should pay close attention to how BTC reacts if it dips into the liquidity zone, as this response will reveal whether buyers are prepared to defend the structure. A clean breakout above the resistance band would confirm the next bullish leg, while a breakdown below the ascending trendline would signal weakness and shift the outlook.

Consistency: The Most Boring Skill That Makes Traders MoneyAsk traders how they made their money and you’ll hear stories about perfect entries, heroic conviction, and that one legendary going-for-the-jugular trade they’ll mention at every dinner party.
What you almost never hear about is consistency — because it’s not glamorous, it doesn’t screenshot well, and it definitely doesn’t come with fireworks.
But consistency is the skill that turns trading from an emotional roller coaster into a durable business. It’s boring. It’s repetitive. And it’s responsible for more profitable careers than any secret indicator ever will.
🧠 Why the Market Rewards the Unexciting
Markets don’t pay you for being clever. They pay you for being repeatable.
Consistency works because markets are probabilistic systems. No single trade matters in the long run. What matters is what happens over time, across dozens or hundreds of decisions. (Good time to look back and see how you did this year.)
The trader who makes reasonable decisions again and again — even without brilliance — will eventually outperform the trader who occasionally nails a perfect call but can’t stop freelancing.
Think of it less like poker and more like compound interest. It doesn’t wow you at first. Then one day, you realize you’ve done pretty darn well.
📊 The Myth of the Big Trade
Every trader remembers their biggest win. And there’s nothing wrong with that. Some big trades can pay for a lot of small mistakes .
Big wins feel validating. They trigger confidence. But they also create dangerous expectations. Traders start chasing that feeling — trading bigger, faster, looser — and consistency quietly exits through the back door.
Professional traders know that a great trade doesn’t prove skill. A series of disciplined trades does.
The market doesn’t care how exciting your best trade was. It cares how well you behaved on the other ninety-nine.
🧮 Consistency Is Math, Not Motivation
Consistent traders don’t wake up feeling like it’s their lucky day.
They operate within a framework that reduces randomness in their decisions. They trade fewer setups, not more. They accept that being flat for the week is a position. They understand that not every day is designed to reward them.
This isn’t about grinding harder. It’s about removing unnecessary choices so execution becomes automatic.
Ironically, the less you try to be exceptional, the more real and reliable your results become.
📉 Losing Is Part of the Job
Consistency shows up most clearly during losing streaks. Anyone can look disciplined after a winning week. The test comes when trades stop working, narratives shift, and the urge to “make it back” creeps in.
Consistent traders don’t panic. They don’t revenge trade . They don’t rewrite their strategy after three red days.
Instead, they understand that drawdowns are not failures — they’re rent paid for staying in the game. The goal isn’t to avoid losses. It’s to keep losses from changing behavior.
🧠 Confidence Comes from Repetition
One of the quiet benefits of consistency is confidence — the real kind. Not the loud, chest-thumping confidence that comes from a hot streak. But the calm assurance that comes from knowing you’ve executed your plan a hundred times before.
That confidence allows traders to stay neutral when others get emotional. To reduce size when conditions change. To wait without feeling left out.
It’s the difference between reacting to the market and responding to it. Regardless if it’s fever-pitch earnings season or the Economic Calendar is jam-packed with events.
🕰️ The Long Game Always Wins
With that in mind, trading careers aren’t built in viral moments. They’re built in years upon years of working on your craft.
The traders who last aren’t necessarily the smartest or fastest. They’re the ones who made it boring enough to sustain it. And eventually, almost accidentally, the process builds itself into something that looks a lot like success.
Off to you : What’s your consistency strategy saying? Is boring beautiful or is risk-taking maxed out in your portfolio? Share your thoughts in the comments!
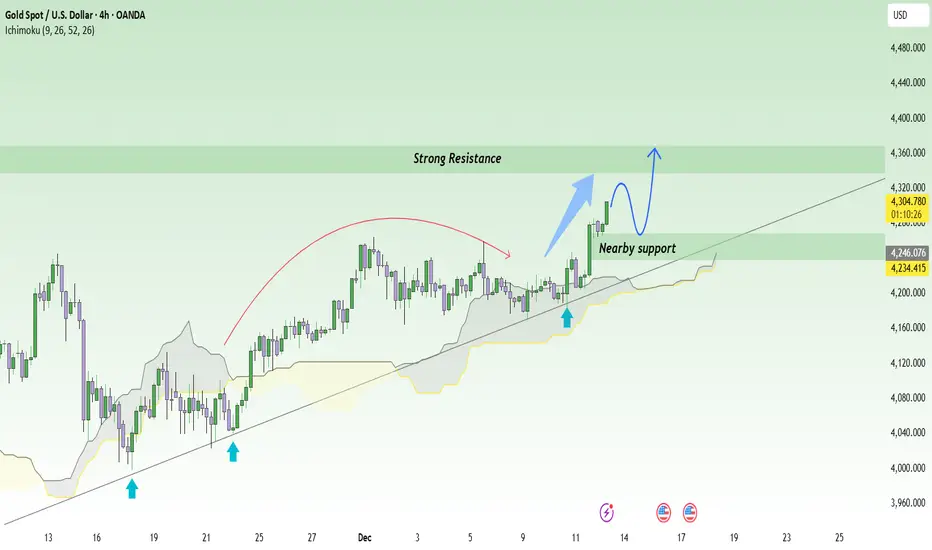
XAUUSD: Bullish Momentum StrengthensGold is entering a highly promising bullish phase as the market shifts strongly to the buy-side following the Fed’s decision to cut interest rates. The emerging risk-on sentiment aligns perfectly with a technical setup that is paving the way for a potential breakout — creating an exceptionally attractive environment for traders in the coming days.
1. Fundamental Drivers Supporting Gold’s Uptrend
• The Fed cut rates by 25 bps, something the market had been waiting for weeks. This immediately pushed the USD down to its lowest level in eight weeks.
• With a weaker USD, gold becomes cheaper for global buyers → strong inflows into XAUUSD.
• President Donald Trump continues to support low interest rates, a long-term policy signal that reinforces expectations that gold still has room to rise.
• Markets are now watching the December 16 NFP report, but given the current backdrop, this data will likely bring short-term volatility rather than change the broader bullish trend.
=> The macro landscape is clearing the path for gold to continue rising in the mid-term.
2. Technicals: Gold Holds Its Uptrend and Is Approaching Strong Resistance
Looking at the chart:
• XAUUSD is maintaining its position above the ascending trendline established since mid-November.
• Each time price touched the trendline, it bounced sharply — showing that buyers remain active.
• The nearby support at 4,270 is acting as a strong dynamic floor.
• Price is now approaching a major resistance zone at 4,360 – 4,370. With the current momentum, the likelihood of a slight pullback followed by a breakout is very high.
• If the breakout succeeds, the next target sits around 4,400 – 4,420.
=> A clean uptrend structure, nearby support, and strong momentum — buyers are fully in control.
3. Suggested Trading Setup
Prioritize buying with the trend.
Wait for a potential retest at 4,270 – 4,290 for an optimal entry.
A break above 4,370 will serve as a confirmation signal to scale in further.
EURUSD SELL | Idea Trading AnalysisEURUSD is moving on resistance zone
The chart is above the support level, which has already become a reversal point twice.
We expect a decline in the channel after testing the current level.
We expect a decline in the channel after testing the current level
Hello Traders, here is the full analysis.
I think we can soon see more fall from this range! GOOD LUCK! Great SELL opportunity EURUSD
I still did my best and this is the most likely count for me at the moment.
-------------------
Traders, if you liked this idea or if you have your own opinion about it, write in the comments. I will be glad ⚜️

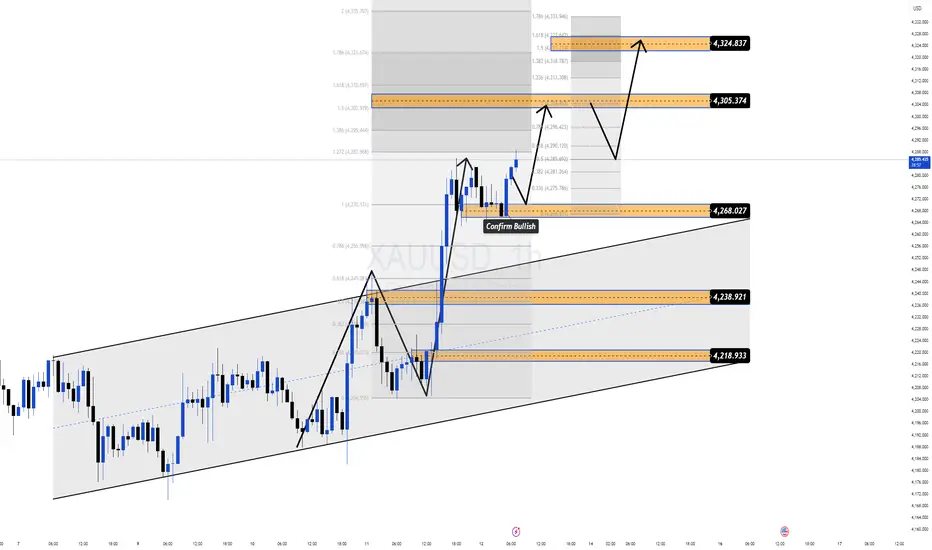
Bullish Confirmation - Buy the PullbackGold has delivered a clear bullish structure break and is currently holding firmly inside an ascending trend channel. The recent impulsive move confirms strong participation from smart money, while the current price action reflects a healthy pullback–continuation phase, not a reversal.
From a fundamental perspective, dovish Fed expectations and a lower-rate outlook continue to support Gold. This keeps downside moves corrective in nature and favors trend-following BUY setups.
📊 Market Structure & MMF Flow (H1)
• Bullish structure is confirmed with Higher Highs and Higher Lows.
• Price is retracing toward demand zones to rebalance liquidity before the next expansion.
• No bearish structure break has appeared so far.
💎 Key Levels – MMF Style
• Primary Buy Zone: 4,268
• Deep Buy Zone: 4,238 – 4,219
• Upside Targets: TP1 4,305 → TP2 4,324
🎯 Trading Scenarios
Primary Scenario – Trend BUY
Alternative Scenario – Continuation above 4,305
🧭 MMF Intraday Bias
Bullish above 4,238
Invalidation below 4,219
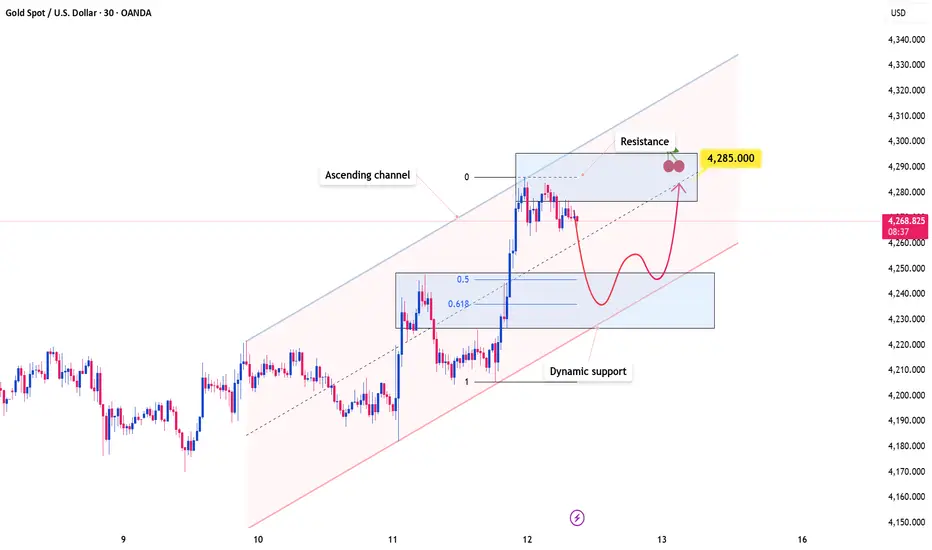
Gold Holds a High Ground While the Market Reprices RiskOANDA:XAUUSD continues to trade within a well-defined ascending channel, with price action consistently respecting both the upper and lower boundaries. This structure highlights strong bullish control, suggesting that buyers remain firmly in charge and that upside continuation is still favored.
Price has recently broken above a key resistance zone and may return to retest this level. If it holds as support, it would further validate the bullish structure and significantly increase the probability of a move toward the 4,285 target. This level aligns closely with the midline of the ascending channel as well as a previous resistance area, reinforcing its technical importance.
As long as price remains above this support zone, the bullish outlook stays intact. However, a failure to hold this level could weaken the current structure and open the door for a deeper pullback toward the lower boundary of the channel.
On the fundamental side, gold’s recent surge has been driven by an unexpected shift from the U.S. Federal Reserve toward monetary easing, including a return to bond purchases. This move pressured the U.S. dollar and effectively removed prior concerns over a prolonged hawkish policy stance, prompting renewed inflows into gold.
While short-term pullbacks remain possible due to overbought conditions, the broader trend continues to look constructive, supported by ongoing central bank buying and sustained demand for safe-haven assets.
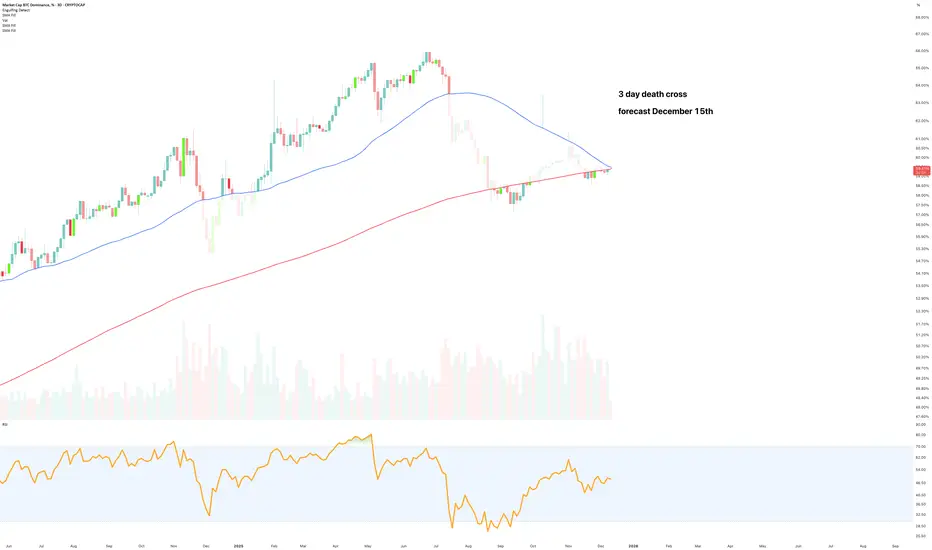
The alt-token Santa rally is here! - December 2025But it’ll be short lived. Many will mistakingly recognise this as “alt token” season, it’s not. It’ll be a relief rally on steroids for long suffering alt token holders. Use it as your exit from this awful asset class. This idea expires by the end of January 2026 at the latest, unless a development occurs that changes that outlook from the data available today.
The above 3 day chart of Bitcoin dominance forecasts a Death Cross print circa December 15th. Technically speaking, it is the 3rd three day Death cross to print on Bitcoin dominance. The others happened on May 2016:
At the time the OTHERS Total (first 100 alt tokens minus the top 10 generally speaking) rallied from $100m to $66billion over 590 days, when many made fortunes and watched them melt away in 2018. Today XRP has a market capital almost twice the size of the 2017 alt token bubble at $123billion. Aye.
The 2nd three day death cross was in August 2020, Bitcoin dominance rallied almost 30% on the cross and the OTHERS Total rallied 1000% over the following 255 days.
The take away, every 3 day death cross print is followed by a strong alt token performance.
“Wait wait you said until January 2026 and you present evidence for previous death cross resulting in alt token rallies that lasted multiple months, I’m confused!”
Why I know it won’t last long
A few of the long term followers among you may remember this idea “I mminent 2-day death cross - Is Bitcoin about to crash 30-40% ?? ” from 2022. The idea discusses the relevance of the 2 day death cross (not a 3 day as discussed above). That is when:
The 2 day 50 Simple Moving average (blue) crosses down the 2 day 200 SMA (Red) with price action under the 200 SMA.
If you look left you’ll notice every Bitcoin bear market is confirmed with this event. A 2 day death cross is forecast to print around the end of the month. It does not mean price action will drop like a vegan at a BBQ, but rather complain at first before being overcome by the stench of gravity.
Bitcoin 2 day death cross forecast, December 31st, 2026
Will not bore you with past crosses, you can do look them up yourself. What is clear, if not factual, a 2 day death cross is the start of a minimum year long bear market.
Conclusions
So yes, the alt token Santa rally is here, jingling its little bells and waving shiny green candles in your face like some bloke at a Christmas market trying to sell you socks you don’t need.
And like all Christmas magic, it’ll vanish the moment the lights go off. Not an “alt-season,” not a new paradigm, not “the big rotation we’ve been waiting for.” It’s one last sugar rush before the dentist arrives.
The real Grinch is waiting at the end of the month: the 2-day Bitcoin death cross, the one that actually matters. The one that says, “Right, fun’s over, pack it up, winter’s here.”
If you’re still clinging to low-cap jungle rubbish by February, that’s no longer optimism, that’s performance art. Use the rally. Exit the nonsense. Save yourself before the lights go out and the floor collapses faster than a crypto influencer’s moral compass.
Ww
Disclaimer
==========================================
This is not financial advice, obviously. If you read this and think, “Right, I’m putting the house, the kids, and the dog into ShibaBonk Inu because Santa said alt season!” that’s on you, mate.
If the market pumps, you’ll claim you’re a genius.
If it dumps, you’ll blame me. Either way, I’ll still sleep like a baby.
Do your own research.
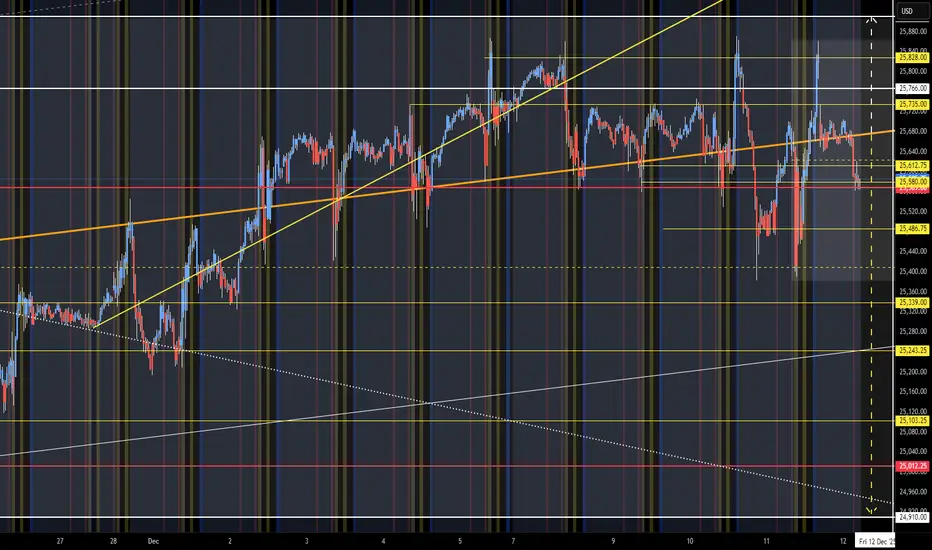
NQ Short (12-12-25)25,623 is Mid Level of recent range, we have seen 2 Long Trap lock ins that drop after Reg Session BTD/FOMO lifts into now a Gap open and lower O/N Session. Sometimes the Gut Feeling Indicator is the best. Orange TL seems to be the KL to watch. Yellow is lower and White is higher, the Edge Trades in opposite direction are working until a breakout. Looking for the same play today and waiting for the BTD/FOMO crowd to bail, I am pretty sure that Santa, Easter Bunny and Plus Plus Plus Plus Plus are not real.
BTC Awaits a Liquidity Sweep Before Any Real RallyBitcoin on the H4 timeframe continues to hover inside a tight equilibrium band around 91,500–93,500, with price repeatedly tapping both edges of the range without showing directional commitment. The current movement suggests liquidity hunting rather than trend development, as every push toward 92,000 quickly gets absorbed.
Macro conditions still lean supportive thanks to the low-rate outlook, yet capital flows are favoring metals over crypto, leaving BTC with a muted recovery after the prior drop. Buyers remain cautious while sellers lose momentum, causing price to float above two demand/FVG layers at 89,500–90,500 and 86,500–88,000.
The scenario with the highest probability is a final liquidity flush. BTC may continue consolidating around 92,000–93,000 before sliding to 90,000 and dipping into the deeper FVG at 88,000–86,500. A clean reaction there would open room for the next impulsive leg upward.

EURUSDHello Traders! 👋
What are your thoughts on EURUSD?
EURUSD extended its rally and touched the upper boundary of the ascending channel.
After reaching this resistance area, price has started a pullback, which appears to be a healthy correction within the broader bullish structure.
Price is now expected to retrace toward the channel support, which overlaps with a strong demand zone and key Fibonacci levels (0.382–0.5).
This confluence area increases the probability of bullish reactions.
As long as the structure remains intact, a rebound from this support zone could trigger the next upward leg, targeting higher highs inside the channel.
Don’t forget to like and share your thoughts in the comments! ❤️

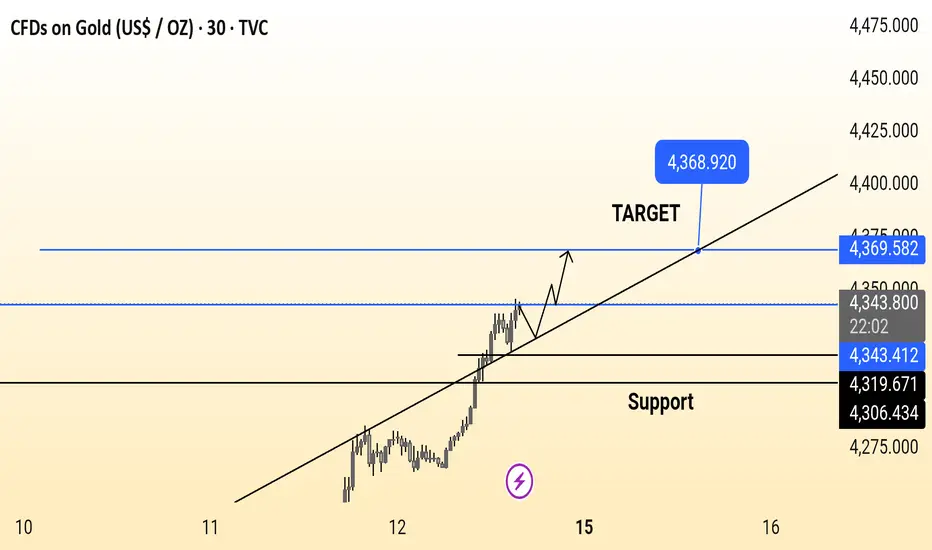
GoldGold is trending upward on the 30-minute chart, holding above support and following an ascending trendline. Price is expected to continue its bullish move toward the target zone around 4,368–4,370, as long as it stays above the key support levels.
How Funds Actually Make Money From BitcoinIf you spend more than five minutes on Crypto TikTok (YouTube or X are not much different), you’d think the entire market depends on:
- who “bought the dip,”
- who “sold the top,”
- and which whale “decided” to pump or dump.
The screamers with flashy thumbnails and zero understanding yell:
- “BlackRock is buying—BULLISH!”
- “Whales are selling—CRASH INCOMING!”
- “Institutions are entering the market!!!”
- No nuance.
- No structure.
- No clue.
Because here’s the truth:
What BlackRock buys or sells is almost irrelevant to you.
Funds do not make money the way TikTok believes.
They don’t need Bitcoin to go up.
They don’t need Bitcoin to go down.
They need one thing:
Movement. Volatility. Math.
Let’s destroy the hype and show how funds actually make money.
1. Why “BlackRock is buying BTC” tells you absolutely nothing
Retail sees a headline:
“ETF inflows: +5,000 BTC today!”
And jumps to conclusions:
“They know something!”
“Price HAS to go up!”
“Institutions are bullish!”
No.
A fund can buy BTC and still be:
- 100% hedged
- delta-neutral
- directionally flat
- risk-neutral
- fully protected against price movement
The purchase is not a bet.
It’s a component of a structured position.
Buying BTC is just Step 1.
What matters is Step 2, 3, 4, 5…—all the parts TikTok doesn’t even know exist.
2. Why TikTok “analysts” have no idea what they’re talking about
If someone:
- screams in every video,
- says “bullish” or “bearish” 40 times a minute,
- thinks “institutions pump price,”
- doesn’t know what delta, gamma, basis, hedging, ATM straddles are…
…then they are not explaining institutional flow.
They are farming views and likes, not teaching markets.
Let’s be blunt:
If you can’t explain a delta-neutral hedge, your opinion about what BlackRock “plans to do” or "is doing" is worthless.
So let’s walk through how a real fund uses BTC to print money without caring if price goes up or down.
3. How a real fund makes money from volatility (step-by-step, using $100,000 BTC)
Assume:
- BTC price = $100,000
- A fund wants exposure to volatility, not direction
- They buy a BTC ATM straddle (call + put at 100k)
- Delta ≈ 0
- Gamma > 0 → the part that generates money
- They also own BTC spot for hedging.
- Let’s say the fund holds 1 BTC worth $100,000 as inventory for hedge adjustments.
At the start:
Delta-neutral. No directional risk.
Now let’s see how they profit.
Step 2 – BTC goes up 10% → $110,000
Straddle delta becomes +0.5 BTC.
The fund is unintentionally long 0.5 BTC.
To go back to neutral:
The fund sells 0.5 BTC at $110,000.
Cash received:
0.5 × 110,000 = $55,000
Theoretical cost basis (100k):
0.5 × 100,000 = $50,000
👉 Profit from hedge = $55,000 – $50,000 = $5,000
Plus, the straddle increased in value due to volatility.
Step 3 – BTC drops 10% → $90,000
Now straddle delta flips negative: –0.5 BTC
To get back to neutral:
The fund buys 0.5 BTC at $90,000.
Cash paid:
0.5 × 90,000 = $45,000
If they later sell that BTC at the baseline of 100k:
👉 Profit = $50,000 – $45,000 = $5,000
Again, without needing BTC to go up or down, “as predicted.”
This is called:
Gamma scalping — the quiet, relentless engine behind institutional P&L.
Up move → sell high.
Down move → buy low.
Repeat. Print. Sleep.
4. Where does the REAL profit come from?
A fund earns from:
- hedge adjustments (buy low, sell high, but mathematically—not emotionally)
- straddle appreciation as realized volatility exceeds implied volatility
- basis differences between spot and futures
- neutrality to direction, allowing consistent compounding
They make money even if Bitcoin swings between 95k–105k for weeks.
The only time they lose?
When BTC does NOT move.
Because then the straddle premium decays.
That's it.
Nothing to do with faith, predictions, narratives, influencers, or ETF flows.
5. So why should YOU ignore what BlackRock is doing?
Because:
- You are not BlackRock.
- You do not run a delta-neutral book.
- You do not make money from gamma exposure.
- You do not scalp intraday hedges on $100M positions.
- You do not capture basis spreads across spot and derivatives.
- You do not have a trading desk rebalancing risk every hour.
But the TikTok screamers will still tell you:
“Institutional buying = bullish!”
“Institutional selling = bearish!”
“Whales know something!”
They don’t know anything.
Especially not about institutional structure.
So here’s the punchline:
Watching what funds do—without understanding why they do it—is the fastest path to confusion in the best case and destruction in the worst.
You don’t have their:
- tools,
- capital,
- execution speed,
- risk models,
- mandate,
- or mathematical framework.
So trying to mimic them is not just pointless —it’s dangerous.
Final Lesson: Ignore the noise, ignore the hype, ignore the TikTok parade.
BlackRock doesn’t care about bull markets or bear markets.
BlackRock doesn’t need Bitcoin to moon.
BlackRock doesn’t panic when Bitcoin drops.
Because BlackRock doesn’t trade the story.
They trade the structure.
And unless you operate like a fund — stop pretending their moves matter to your trading.
You’re not them.
You don’t have their machinery.
You don’t have their volatility book.
So:
Stop watching what institutions do.
Start understanding what you should do.
That’s the difference between surviving and blowing up.
P.S: BlackRock and TikTok are used just as an example:)

XAUUSD H1 Volume Profile and Key Price AreasXAUUSD H1 – Volume Profile and Key Price Areas
Gold remains in a strong uptrend, with the primary strategy focused on buying pullbacks
PRIORITY SCENARIO – MAIN STRATEGY
Buy-the-dip approach aligned with the dominant trend using Volume Profile levels
Expected buy zone: around 4253 based on VAH
Short-term range to monitor: 4263 – 4285
Price expectation: rebound from VAH toward the upper range before further expansion
Position management:
If price holds above the 4263 area and shows clear bullish reaction, maintaining long exposure remains favorable.
If price is strongly rejected near 4285, risk should be reduced as this zone represents an important short-term resistance.
ALTERNATIVE SCENARIO – SECONDARY SETUP
Short-term countertrend opportunity at an extended resistance level
Sell zone for the alternative scenario: around 4310 at the Fibonacci extension
This setup is only considered if clear rejection signals appear at the level
KEY REASONS
The bullish structure on the H1 timeframe remains intact
Volume Profile highlights the VAH near 4253 as a high-probability reaction zone
The 4310 area represents an extended resistance suitable for profit-taking or short-term pullback reactions
MACRO CONTEXT
The Federal Reserve continues its rate-cutting cycle and maintains a dovish stance, putting pressure on the US dollar and supporting gold prices.
Geopolitical tensions and concerns about US economic slowdown further reinforce safe-haven demand.
Markets are now focused on the upcoming Nonfarm Payrolls report, where weaker data could drive further upside, while stronger data may trigger a short-term correction.
RISK MANAGEMENT AND MONITORING
Avoid chasing price while gold trades within the 4263 – 4285 range.
The bullish scenario becomes invalid if price breaks clearly below the support area beneath the VAH.
Expect increased volatility around major economic data releases and manage exposure accordingly.

USDJPY 30Min Engaged ( Bullish Volume Reversal entry Detected )⚡Base : Hanzo Trading Alpha Algorithm
The algorithm calculates volatility displacement vs liquidity recovery, identifying where probability meets imbalance.
It trades only where precision, volume, and manipulation intersect —only logic.
✈️ Technical Reasons
/ Direction — LONG / Reversal 155.170 Area
☄️Bullish momentum confirmed through strong candle body.
☄️Structure shifted with higher-low near key demand base.
☄️Volume expanding confirms order-flow alignment upward.
☄️Buyers reclaimed imbalance with sustained clean break.
☄️Algorithm detects rising momentum under low liquidity.
⚙️ Hanzo Alpha Trading Protocol
The Alpha Candle defines the day’s real control zone — the first battle of momentum.
From this origin, the Volume Window reveals where the next precision strike begins.
⚙️ Hanzo Volume Window / Map
Window tracked from 10:30 — mapping true market behavior.
POC alignment exposes institutional bias and breakout potential zones.
⚙️ Hanzo Delta Window / Pulse
Delta window monitors real buying vs. selling power behind each move.
Tracks volume aggression to expose who controls the candle — buyers or sellers.
When Delta aligns with Volume Map, momentum becomes undeniable.

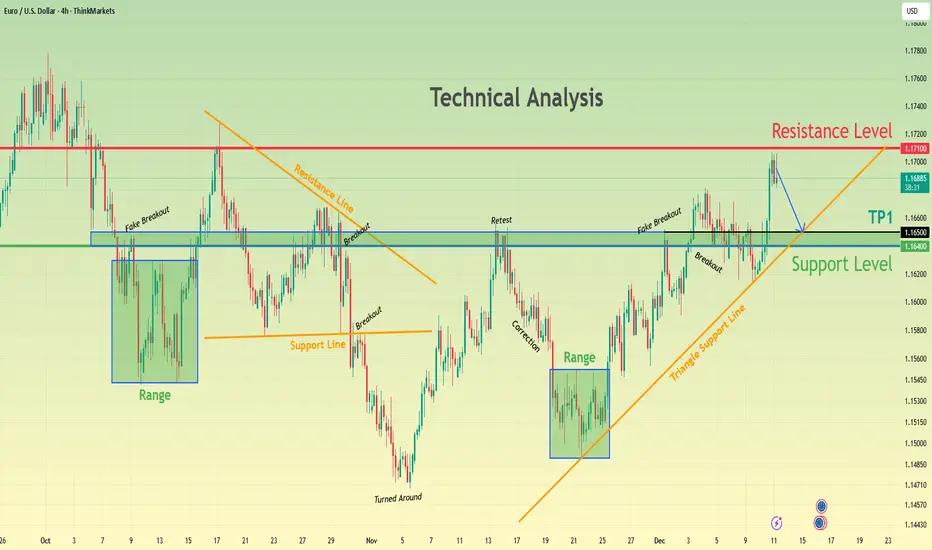
EURUSD Consolidates Below Resistance — Bears Aim for 1.1650Hello traders! Here’s my outlook on the current EURUSD setup. After a prolonged consolidation phase, the pair repeatedly respected the Support Level around 1.1640–1.1650, where buyers have consistently stepped in to defend the zone. This area has acted as a strong demand region, forming multiple ranges and triggering previous upward reversals. Each fake breakout below support confirmed that sellers failed to gain control, allowing price to rebound back into structure. Currently, EURUSD is trading within an ascending structure supported by the Triangle Support Line, which has guided price higher following the major turnaround. Along the way, several breakouts and retests validated bullish momentum as the pair pushed toward the key Resistance Level at 1.1710. This resistance remains the main barrier where price previously rejected and rotated lower. At this moment, EURUSD is approaching the Resistance Level again. If buyers maintain control and continue respecting the rising support line, the primary scenario is a pullback toward TP1 → 1.1650, where a major decision point awaits. This area has proven to be a reliable support level and aligns with previous retests, making it a critical zone for potential bullish continuation. A clean breakout above 1.1710 would open the door for a stronger upward move, signaling renewed bullish strength. However, if price breaks below the Triangle Support Line and falls under 1.1640, the bullish structure becomes invalid, and the market may return to deeper corrective levels. For now, the trend remains moderately bullish as long as price holds above support and stays within the rising structure. Please share this idea with your friends and click Boost 🚀