GOLD → Correction before possible growthFX:XAUUSD entered a liquidation phase (rally) within the trading range at the opening of the session. The dollar's rise is to blame. The focus is on supporting consolidation...
Investors remain interested in gold as a safe haven asset amid geopolitical risks and declining demand for US assets.
The key drivers remain news about tax reform in the US, trade negotiations, and upcoming macro data.
Gold is consolidating, but since the opening of the session, the price has been heading towards support. Against the backdrop of an upward trend, a trigger for bearish liquidity is likely to form before growth.
Against the backdrop of the dollar's growth, gold is entering a correction phase. At the moment, all attention is on support and the liquidity zone of 3265. A false breakdown will trigger a price buyback.
Resistance levels: 3322
Support levels: 3282, 3265
Since the price is still within the range and a countertrend correction is forming in the market, in our case, it is worth considering an intraband trading strategy. A false breakdown of support could trigger growth to intermediate resistance or to the upper border of the channel.
Best regards, R. Linda!
Community ideas

Gold Fibonacci Analysis of (XAU/USD)📊 Fibonacci Levels Overview:
23.6% Level: Minor correction zone, price rejected this area and continued lower.
38.2% Level: Acted briefly as a support but eventually broken.
50.0% Level (~$2,351.6): Currently being tested — a key level. Price is consolidating here.
61.8% Level: If 50% breaks decisively, 61.8% becomes the next major support zone.
📉 Trend Outlook:
✅ Bullish Scenario:
If price holds above the 50% Fibonacci level, we could see a bounce toward 38.2% and potentially back to 23.6%.
Key upside targets: $2,345 – $2,380 zone.
❌ Bearish Scenario:
If the 50% level fails to hold, the price could drop to test the 61.8% Fibonacci level and possibly lower.
Downside target: $2,330 – $2,320.
📌 Conclusion:
Gold is currently at a decision point:
Holding above 50% = potential recovery.
Breaking below = confirmation of a short-term downtrend.
Traders should watch for price action and volume confirmation near the $2,351 level to determine the next move.

Lingrid | GOLD Key SUPPORT Zone Bounce OpportunityOANDA:XAUUSD is consolidating after a rejection from the descending resistance trendline near 3345, with price now approaching the prior demand zone around 3265. If this support holds, a bullish reaction could propel price back toward the 3345–3350 zone for another retest. The broader pattern reflects a potential higher low forming against the downward trendline. A bounce here would confirm bullish interest and set the stage for continuation higher.
📈 Key Levels
Buy zone: 3265
Buy trigger: bullish reaction from support or breakout above 3300
Target: 3345
Sell trigger: break below 3265
💡 Risks
Failure to hold 3265 support could trigger sharp downside
False breakouts near 3345 remain a threat
Market-sensitive data could increase volatility
Traders, if you liked this idea or if you have your own opinion about it, write in the comments. I will be glad 👩💻

ETH: Still optimistic and in transformationETH: Still optimistic and in transformation
Previously, ETH showed a strong bullish trend, but recent economic events have shaken things up.
On Friday, U.S. President Donald Trump announced a 50% tariff on the European Union, set to begin on June 1, 2025. This caused uncertainty in financial markets, triggering selling pressure on ETH, which dropped to $2,463—a key support level.
However, over the weekend, Trump extended the EU negotiations deadline until July 9, for talks between Washington and the 27-nation bloc to produce a deal.
If ETH holds the $2,463 support level, we could see another upward push in price.
You may find more details in the chart!
Thank you and Good Luck!
❤️PS: Please support with a like or comment if you find this analysis useful for your trading day❤️

Is Bitcoin Ready for Its Next Leg Up? Here’s What We Know So FarBitcoin BITSTAMP:BTCUSD is so back — not just back like “we recovered the dip,” but back like “new all-time highs, let’s go shopping for Lambos on moons” back.
If you’ve been following our Top Stories coverage, you’ll know that the OG token vaulted past $109,500 last week, then kissed $111,900 in “Tom Cruise falling off a building” style. Only that there wasn’t a fall to the ground. Instead, Bitcoin prices got stuck near $110,000 and are now waiting for the next catalyst.
Where are we in the cycle? The memes are pumping. Maxis are chest-thumping (this one’s for you, Saylor ). And the market? Well, it’s trying to figure out if this rocket still has fuel, or if we’re hovering at apogee before gravity reminds us it’s still a thing.
Let’s break down what’s really going on — with numbers, context, and just enough forecast to keep it spicy.
🚀 Bitcoin Goes Bionic
Call it what you want — a breakout, a blowoff, or a moonshot — Bitcoin just rewrote the record books. The OG coin is up 48% since its April lows, a run that’s as explosive as it is poetic.
Remember the bearish chants echoing when BTC dipped near $74,000 in early spring? And all those Bitcoin permabears saying it’s all going to zero? Yeah, those are suddenly hard to hear over the rocket engines.
This is the moment Bitcoin believers have been waiting for. Institutional interest continues to show inflows are strong. Adoption is real and making solid progress. And price action is loud — loud enough to drown out the skeptics still quoting tulip bubbles from 1637.
💥 Why the Breakout? A Perfect Storm
Looking at the fundamentals and the technicals — this wasn’t a fluke. It was a perfect cocktail of macro tailwinds, regulatory green lights, and unrelenting digital gold fever.
ETF flows? Exchange-traded funds are collecting record levels of fresh capital — all eleven of them .
Institutional demand? Climbing faster than Saylor can tweet.
Macro backdrop? Soft dollar, muted inflation, and a shiny 90-day trade truce between the US and China paired with one between the US and the EU .
Regulatory mood? A lot less hostile than the Biden administration, with a stablecoin bill clearing the Senate’s procedural vote and Texas passing a law to hold Bitcoin in its reserve fund.
Bitcoin didn’t ride the wave — it was the wave. And with volatility finally working for traders, not against them, the rally gained real traction.
📉 Not All Risk is Behind Us
Now before we start naming stars after Satoshi, let’s pump the brakes (just a little). The flagship crypto might be chilling around $110,000, but this asset class has the emotional range (and discipline) of a toddler. We’ve seen rallies like this before. We’ve also seen how quickly they unravel.
Upcoming economic data could throw a wrench in the gears. Here’s what to watch for this week:
Wednesday: Fed minutes
Thursday: GDP figures
Friday: Core PCE inflation
Any surprises here — especially hotter-than-expected inflation or hawkish Fed sentiment — could rattle the risk-on party. Bitcoin loves liquidity. If the Fed hints at tightening, the rocket might need to refuel mid-air.
🧭 Key Levels to Watch
Technically, the $111,900 print is your short-term ceiling. It’s the new line in the sand — the price everyone’s watching, waiting for a clean break or a hard rejection.
On the downside, $105,000–$106,000 is developing as support. Break that, and $100,000 becomes the psychological safety net. Below that? Well, let’s not talk about it unless we have to.
Until then, price is consolidating. Think of it like a pit stop — a chance for bulls to breathe, for bears to panic quietly, and for traders to argue about Fibonacci levels.
🛰️ Is $120K Next? Or Is This the Top?
But let’s dig into it a little bit. The real question is whether this rally still has legs. Some traders are calling $120,000 a “magnet level.” Others are treating current prices like the top and selling into strength.
The answer? Probably both.
Momentum is still there — just cooled off a bit. Volume’s down slightly. Social buzz is still high up there. The market’s in a classic “wait-and-see” phase, prepping for a bigger move in either direction.
What could break the stalemate?
A blockbuster inflation report (bullish if soft).
Another policy win from Washington.
Or the most powerful force of all: a dovish stance from the man who moves markets with a simple “Good afternoon” (bonus points if you guess who that is!)
📢 Final Word: Celebrate, But Stay Sharp
If you’ve been long since the dip, this is your moment. Pop some virtual (or real?) champagne. Screenshot that green PnL. Post a gif of Elon and Trump dancing.
But if you’re entering now, zoom out. Yes, momentum is bullish. Yes, fundamentals are stronger than ever. But Bitcoin doesn’t do straight lines for long. And your stop-loss isn’t going to set itself.
Whether $120K is next or we pull back to reset, the next few sessions will be crucial.
Your move : Are you buying this breakout? Waiting for confirmation? Or just enjoying the view from orbit? Let us know how you’re playing this Bitcoin beast — because one thing’s certain: it’s never boring up here.

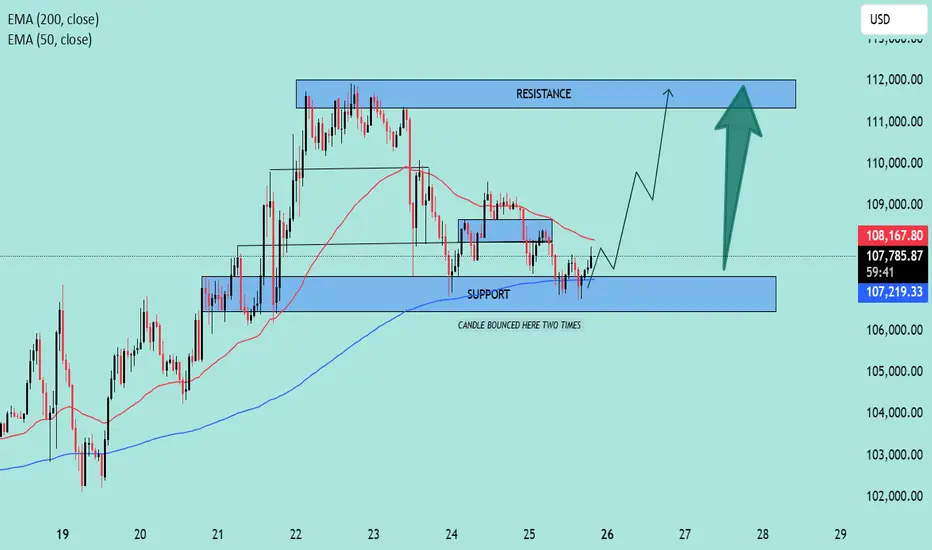
BTC/USD Rebound in Play! | Key Support Holding, Eyes on $112K📊 BTC/USD Technical Analysis
🗓️ Chart Date: May 25, 2025
🔍 Key Levels:
🔵 Support Zone: $106,800 – $107,300
Notably, price bounced twice in this region, indicating strong buying interest.
This area aligns closely with the 200 EMA (currently at $107,213.51), adding further confluence as dynamic support.
🔴 Resistance Zone: $111,800 – $112,300
Previous highs and consolidation make this a significant area where sellers may re-enter the market.
📈 Indicators:
🔵 EMA 200 (Blue): $107,213.51
Acts as a strong dynamic support; price bounced off it recently.
🔴 EMA 50 (Red): $108,182.91
Price is currently below the 50 EMA, suggesting short-term bearish pressure remains until this level is reclaimed.
🧠 Market Structure & Price Action:
After a sharp drop from the resistance zone, price found solid footing at the support zone.
Recent candles show rejection wicks from the downside, hinting at potential bullish reversal.
A breakout above minor consolidation and 50 EMA could trigger a bullish continuation toward the resistance.
📌 Forecast:
✅ If the price holds above the support zone and breaks above $108,200, we can expect a bullish move toward $112,000.
⚠️ However, a failure to break above the 50 EMA could lead to a retest of the support zone.
🧭 Trade Idea (Not Financial Advice):
📥 Long Bias:
Entry: On confirmed breakout above $108,200
SL: Below $107,000
TP: $111,800 – $112,300
📌 Conclusion:
The chart setup suggests a potential bullish reversal 📈 from a key support zone, supported by EMA 200. Watch for a break above the 50 EMA for momentum confirmation.
🧠 Always confirm with volume and wait for confirmation before entering a position.
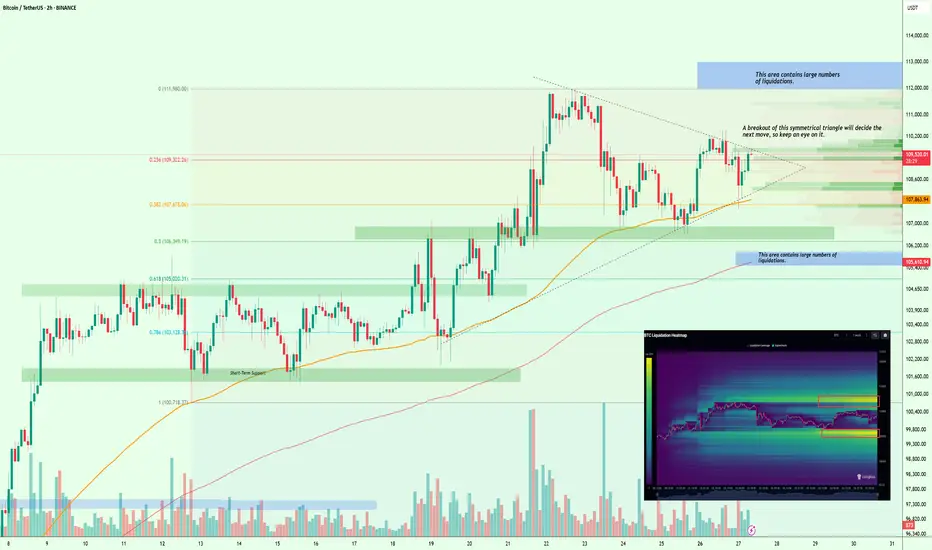
$BTC Liquidity Squeeze Incoming – Breakout or Breakdown?#Bitcoin
According to the liquidation heat map, CRYPTOCAP:BTC is building a large cluster of liquidations on both the upside and downside, creating some confusion in the market. However, the nearest major liquidation zone is around $112K–$113K, which increases the chances of a move toward that range.
Technically, BTC is forming a symmetrical triangle, and the breakout from this pattern will likely determine the next major move.
So keep a close eye on it.
I’ll keep you posted as things unfold.
If you find my updates helpful, don’t forget to like and follow for more!
Bitcoin - Bulls in Control $113k Next targetBitcoin just delivered a textbook bullish reaction following a decisive liquidity sweep beneath the 4H range lows. Instead of continuing lower or entering a consolidation phase, price responded with immediate strength, snapping back with velocity, reclaiming structural levels, and rejecting decisively from a key Fair Value Gap (FVG). This kind of aggressive post-sweep price action usually signals the end of a stop hunt and the beginning of a new directional leg, which, given the current structure, is leaning heavily to the upside.
This is not just a random bounce, it’s a clear shift in intent. The behavior we’re seeing reflects a strategic move by smart money: first clear out liquidity from trapped longs and eager breakout sellers, then reverse and defend key zones that align with institutional discount pricing. The result? A bullish narrative that looks ready to drive price significantly higher.
Liquidity Sweep and FVG Reclaim
The initial sharp drive lower ran through the 4H lows, which had built up significant liquidity from both early long entries and breakout traders looking for continuation. This kind of move is engineered, designed to clean the board before a major shift. Price wicked deep into a 4H Fair Value Gap and immediately snapped back above it, closing strong and leaving behind a long lower wick. That reaction tells a story: there was demand waiting, and it stepped in with authority.
The Fair Value Gap wasn't just tested, it was respected. The fact that price closed back above the gap, after wicking through it, confirms it wasn't simply a liquidity grab but also a moment of rebalancing. The imbalance created earlier was filled efficiently, and the market moved on. That combination of liquidity sweep, deep FVG test, and bullish close is often what marks the end of manipulation and the beginning of a true move. It's a clear signal of smart money stepping in and defending value.
Structural Shift and Accumulation Signal
Following the sweep, the structure shifted rapidly. Price reclaimed the previous 4H support base that had been broken during the stop hunt, invalidating the bearish continuation thesis and instead suggesting accumulation. This is classic behavior after a manipulation low, price doesn’t hesitate or consolidate much, it simply turns with strength.
We’re also seeing signs of absorption and accumulation, particularly in the way price rejected cleanly from discount levels and stabilized within the FVG range. Multiple attempts to break down have failed, and the bounce wasn’t just reactive, it came with commitment. With each retest of the 110.3K resistance, that level weakens structurally. What began as resistance is now showing signs of turning into a launchpad.
If this is indeed the final leg of an accumulation phase, we should expect a marked expansion soon. The setup aligns with smart money accumulation logic: sweep liquidity, shift structure, trap shorts, and then displace with force.
Price Targets and Expectations
The 110.3K level remains the most immediate point of interest. It has acted as resistance multiple times, but each rejection has grown weaker. If price clears this level with conviction, ideally through a sharp displacement candle, the breakout has legs. Above that, we enter clean air with little resistance overhead.
The next logical target becomes 113K, which aligns both psychologically and technically with the next liquidity cluster. It’s an untested zone and represents the next area where sellers might appear. However, given the strength of the reversal and lack of major supply between 110.3K and 113K, price could move swiftly once the breakout is confirmed.
Longer-term, if momentum holds and Bitcoin maintains strength above 110.3K, we could see a retest of the all-time highs come into focus sooner than expected. But for now, the priority is to monitor how price interacts with 110.3K and look for signs of breakout strength or failed move traps.
Conclusion
Bitcoin isn’t in a boring range or slow grind, it just executed a classic liquidity play: sweep, react, reclaim. The reaction off the 1H Fair Value Gap that followed the 4H sweep is a strong signal that the market has shifted gears. With clear signs of demand stepping in and structure now favoring the bulls, the 110.3K level looks increasingly vulnerable. If that breaks, the path toward higher prices, including 113K and beyond, opens up fast.
The overall context has shifted from consolidation to directional expansion, and everything about the recent move points toward the bulls regaining control. Keep your eyes on the structure, the volume, and the displacement above key levels, the next leg could be explosive.
___________________________________
Thanks for your support!
If you found this idea helpful or learned something new, drop a like 👍 and leave a comment, I’d love to hear your thoughts! 🚀

Bitcoin – Possible 4h Sweep at 106.5kBitcoin recently printed a sharp rejection after revisiting a key supply area formed by a 4H fair value gap, overlapping perfectly with the golden pocket zone from the most recent down move. This confluence provided a strong technical ceiling, causing a clear reaction and shifting short-term sentiment to the downside. The rejection was sharp and clean, leaving behind an upper wick that signals strong selling interest. From here, price appears to be in search of support, and our eyes are now locked on the 4H imbalance around the 108.2k level, which could serve as a key pivot for the next directional move.
Consolidation and Confluence Structure
This recent move isn’t just a random drop. We’ve built a range around this resistance zone, with multiple failed attempts to break higher, followed by a clear rejection from inside the 4H FVG and golden pocket. This kind of structure usually tells us two things: first, buyers are struggling to break through strong institutional resistance, and second, there’s still liquidity left below that the market may want to sweep before any continuation higher. This is where the FVG at 108.2k and the PDL around 106.5k come into play. Both zones are clean, visible, and highly likely to draw price if the current level doesn’t hold.
Fair Value Gap Reaction Potential
The 108.2k zone is where the first major reaction could occur. It marks a fresh 4H imbalance created during the impulsive move upward, and price is now backfilling that inefficiency. If buyers step in here, respecting this imbalance as a demand zone, we could easily see a rotation back up toward 110.2k and eventually a retest of the upper resistance band near 111k. This would be a typical FVG play: price rebalances into the gap, finds demand, and continues higher.
Failure Scenario and Liquidity Sweep Setup
If the 108.2k FVG fails to hold as support, the next target becomes much more obvious, the previous day’s low at 106.5k. That level is also a 4H swing low, making it a prime liquidity draw. A move below that low would allow price to collect sell-side liquidity, sweep out late longs, and potentially trap breakout traders expecting further downside. If this level is swept cleanly and followed by bullish displacement, it could offer a high-probability long entry from the discount zone. The risk-reward from this setup would be ideal, especially if we reclaim 108.2k afterward.
Market Context and Higher Timeframe Bias
Zooming out, the structure remains bullish on higher timeframes, but this local rejection is a necessary reset. It’s a shakeout that allows price to reprice into demand and generate momentum for the next leg up. This kind of behavior is typical in trending markets, corrective moves that dig into inefficiencies, hunt liquidity, and then reestablish the trend. As long as we don’t see sustained closes below 106k, the bias remains tilted toward continuation to the upside, with current price action offering a potential entry opportunity.
Price Target and Expectations
If we hold the 108.2k zone, my first short-term target is the 110.2k structure high, followed by the upper resistance area around 111k where the initial rejection occurred. A reclaim of that zone opens the door to expansion toward 112k. If instead we sweep the PDL and bounce from 106.5k, the first target would be a retrace into the 108.2k imbalance, with the next leg aiming for the same resistance range. Either path sets up a long opportunity from areas of value.
Conclusion
Bitcoin is at an important decision point. The rejection from the 4H FVG and golden pocket confirms strong resistance, and price is now seeking support lower. The 108.2k FVG is a critical zone, a hold here gives us a clean continuation setup, while a failure could lead to a deeper liquidity sweep toward 106.5k. Either scenario offers high-quality trade potential as long as we stay disciplined and wait for confirmation from price action. Patience is key, but both levels present opportunities to position long from areas where smart money typically steps in.
___________________________________
Thanks for your support!
If you found this idea helpful or learned something new, drop a like 👍 and leave a comment, I’d love to hear your thoughts! 🚀

EURUSD I Daily Weekly CLS I Model 1- 2R setupHey, Market Warriors, here is another outlook on this instrument
If you’ve been following me, you already know every setup you see is built around a CLS range, a Key Level, Liquidity and a specific execution model.
If you haven't followed me yet, start now.
My trading system is completely mechanical — designed to remove emotions, opinions, and impulsive decisions. No messy diagonal lines. No random drawings. Just clarity, structure, and execution.
🧩 What is CLS?
CLS is real smart money — the combined power of major investment banks and central banks moving over 6.5 trillion dollars a day. Understanding their operations is key to markets.
✅ Understanding the behaviour of CLS allows you to position yourself with the giants during the market manipulations — leading to buying lows and selling highs - cleaner entries, clearer exits, and consistent profits.
🛡️ Models 1 and 2:
From my posts, you can learn two core execution models.
They are the backbone of how I trade and how my students are trained.
📍 Model 1
is right after the manipulation of the CLS candle when CIOD occurs, and we are targeting 50% of the CLS range. H4 CLS ranges supported by HTF go straight to the opposing range.
📍 Model 2
occurs in the specific market sequence when CLS smart money needs to re-accumulate more positions, and we are looking to find a key level around 61.8 fib retracement and target the opposing side of the range.
👍 Hit like if you find this analysis helpful, and don't hesitate to comment with your opinions, charts or any questions.
⚔️ Listen Carefully:
Analysis is not trading. Right now, this platform is full of gurus" trying to sell you dreams based on analysis with arrows while they don't even have the skill to trade themselves.
If you’re ever thinking about buying a Trading Course or Signals from anyone. Always demand a verified track record. It takes less than five minutes to connect 3rd third-party verification tool and link to the widget to his signature.
"Adapt what is useful, reject what is useless, and add what is specifically your own."
— David Perk aka Dave FX Hunter ⚔️

USDJPY Analysis – Yield Support Signals Potential UpsideUSDJPY is currently sitting at a key support zone around 142.80–143.00, showing signs of a potential bullish reversal. This support area has previously acted as a strong launchpad for price rallies.
🟢 Technical Setup:
Price action has formed a clean higher low structure, bouncing off horizontal support.
The US10Y Treasury Yield (pink line) has rebounded sharply and is diverging to the upside — a leading indicator for USDJPY strength.
The Fib retracement from the last swing move aligns well with the 0% zone, suggesting the dip might be complete.
A bullish reaction from here targets the 148.50 zone, with intermediate resistance around 145.00–146.00.
🟠 Risk Levels:
Invalidated below 141.40 (structure break).
Stops could be placed below 142.00, targeting a 2:1 or better risk-reward ratio.
🔍 Macro-Fundamental Insight:
U.S. Yields are firming despite mixed Fed signals — this gives strength to USD, especially against low-yielders like the JPY.
BOJ remains dovish with no urgency to normalize rates, keeping the yen weak.
With risk appetite improving and bond yields lifting, carry trade dynamics favor USDJPY upside.
✅ Conclusion:
As long as US10Y yields remain firm and USD holds above 142.00, USDJPY has a strong probability of rallying toward 148.50. Look for confirmation with higher highs on the 4H chart and continued divergence between yield and price.

Bitcoin - Hardcore pump 125k and dump 49k (must see!)In this very detailed and unique analysis, we will look at the most important Bitcoin fundamental analysis of halving cycles. I predict Bitcoin will crash to 49k in 2026, so if you are buying now for the long term as an investment (buy and hold), you can probably wait for a better price! We can statistically predict Bitcoin moves with this simple chart because it's always right and never wrong. What can we say with certainty?
Statistically:
Bitcoin's bull markets last for 742 to 1065 days
Bitcoin's bear markets last for 364 to 413 days
Correction is every time weaker, but still huge
Statistically, Bitcoin crashes every 4 years by 86% to 77%. The market cap is getting bigger as institutions step in, so this time I expect a weaker crash (around 65%). Still, it's a huge crash, and many investors will sell at a loss as usual. Knowledge of the Bitcoin cycles will save you a lot of money.
We are in the final stage of the bullish cycle, and this cycle should end between September and December 2025. When you draw a trendline on the linear monthly chart, you will get a target of around 125,000 USD. This is a good level to sell Bitcoin. I would never listen to moon boys that are screaming that Bitcoin will never go down and Bitcoin will reach 500k or 1M in the next months. That's due to an already big market cap, pretty much impossible. After we finish this bull cycle, we can expect a massive crash to 49k in 2026. For people who are prepared, this may be an incredible investment opportunity. Also, you can short Bitcoin at the top and ride the investment in the opposite direction, plus you will make money on funding fees every 8 hours.
Bitcoin halving is coded to occur once every 210,000 blocks, or roughly every four years, and will continue in this fashion until the final supply of 21 million BTC is reached. It is assumed that the last BTC will be mined in 2140. After that, transaction fees are supposed to be the only source of block rewards for miners.
Write a comment with your altcoin + hit the like button, and I will make an analysis for you in response. Trading is not hard if you have a good coach! It is not a trade setup, as there is no stop-loss or profit target. I share my trades privately. Thank you, and I wish you successful trades!

GOLD 1H CHART ROUTE MAP UPDATEHey Everyone,
Please see update on our 1H chart route map, playing out as analysed.
We started the week with a bearish gap at 3352 being hit, followed by ema5 cross and lock below 3352, which opened up the next level at 3317, also hit perfectly. We are now seeing ema5 cross and lock below 3317, opening the retracement range, which is currently being tested. We are expecting a reaction within this retracement range, aligning with our plan to buy dips.
We will keep the above in mind when taking buys from dips. Our updated levels and weighted levels will allow us to track the movement down and then catch bounces up.
We will continue to buy dips using our support levels taking 20 to 40 pips. As stated before each of our level structures give 20 to 40 pip bounces, which is enough for a nice entry and exit. If you back test the levels we shared every week for the past 24 months, you can see how effectively they were used to trade with or against short/mid term swings and trends.
The swing range give bigger bounces then our weighted levels that's the difference between weighted levels and swing ranges.
BULLISH TARGET
3389
EMA5 CROSS AND LOCK ABOVE 3389 WILL OPEN THE FOLLOWING BULLISH TARGETS
3428
EMA5 CROSS AND LOCK ABOVE 3428 WILL OPEN THE FOLLOWING BULLISH TARGET
3478
EMA5 CROSS AND LOCK ABOVE 3478 WILL OPEN THE FOLLOWING BULLISH TARGET
3517
BEARISH TARGETS
3352 - DONE
EMA5 CROSS AND LOCK BELOW 3352 WILL OPEN THE FOLLOWING BEARISH TARGET
3317 - DONE
EMA5 CROSS AND LOCK BELOW 3317 WILL OPEN THE FOLLOWING BEARISH TARGET
3282
EMA5 CROSS AND LOCK BELOW 3282 WILL OPEN THE FOLLOWING BEARISH TARGET
3233
EMA5 CROSS AND LOCK BELOW 3233 WILL OPEN THE SWING RANGE
3185
3146
As always, we will keep you all updated with regular updates throughout the week and how we manage the active ideas and setups. Thank you all for your likes, comments and follows, we really appreciate it!
Mr Gold
GoldViewFX

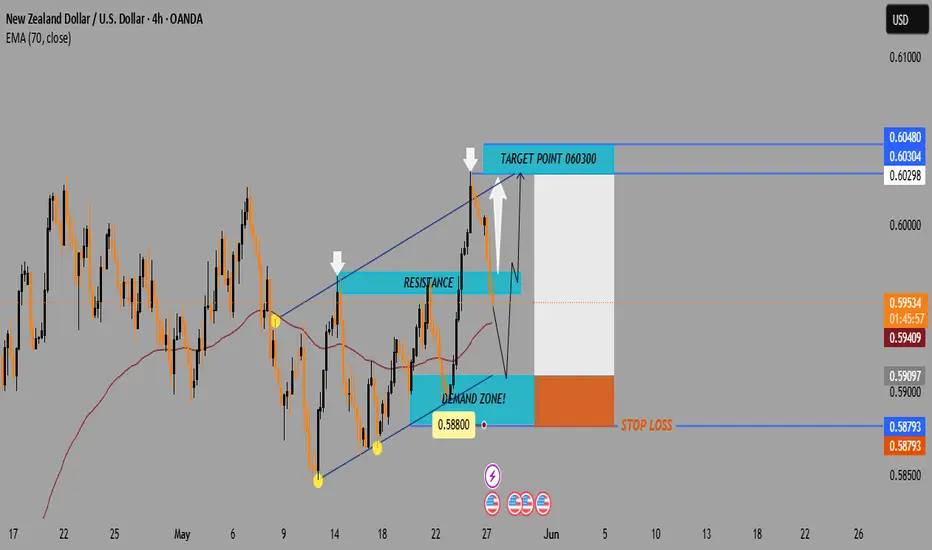
NZD/USD4H Chart Analysis Bullish Reversal Setup from Demand Zone📈 Price: 0.59552
📊 EMA 70: 0.59410 (🟤 Brown Line)
Chart Zones & Key Levels
🔷 Resistance Zone:
🔼 Around 0.60298 – 0.60304
🔹 Price reacted strongly here (🔽 white arrows)
🔹 Acts as a ceiling for now
🟢 Demand Zone:
🔽 Around 0.58800
✅ Buyers stepped in here before
📉 If price drops again, might bounce from here
🟥 STOP LOSS:
❗ 0.58793
🔸 Protects from deeper losses if trend breaks down.
TRADE IDEA
1️⃣ Entry Idea: Wait for a pullback into the Demand Zone
📉⬇️
2️⃣ Bullish Reversal Expected:
⬆️ Bounce toward Target Zone
🎯 Target Point: 0.60300
🟦 Profit zone marked in blue
💸 Good Risk/Reward ratio.
Indicators & Pattern
📐 Wedge Pattern:
🔹 Bullish breakout potential
🔹 Currently respecting the channel
📉 EMA Crossover Area:
🔸 Could act as dynamic support/resistance
🟤 Price hovering around EMA (0.59410)
Summary:
✅ Buy Setup if price holds above 0.58800
🎯 Target: 0.60300
🛑 Stop Loss: 0.58793
⚠️ Watch the price reaction at the Demand Zone for confirmation!
GOLD increased in the short term, approaching an important levelFrom a recent price action standpoint, the move on Gold may have offered cues of encountering weakness, and could serve as a key trigger for bearish traders. This is why I’m anticipating further short-side follow-through. The negative outlook is not confirmed yet, however a bounce off the trendline could once again attract sellers, for a decent move to 3,240 support zone . This latter zone, could be a key turning point that if broken, would lead to a good opportunities for buyers looking to get involved on the dips, anticipating a potential shift in momentum.
But a strong move up and break of trendline at around 3335-3340, would allow Gold to reclaim the 3400 mark and climb even further.
On Monday in my last analysis I predicted that the price gold would fall as low as 3290, after which the price has rebounded short term. All this being said, I am closely watching how price will react when it encounters the trendline as shown and I will wait for any confirmation clues.
Please note that I will not get involved without proper confirmation

What is Bitcoin Dominance, and When Can We Expect Altseason?What is Bitcoin Dominance, and When Can We Expect Altseason?
✅ In the fast-paced and ever-changing world of digital currencies, traders and investors are continually seeking signs and tools to aid them in making informed decisions. One key sign is Bitcoin Dominance (BTC.D).
Understanding this and examining its chart can provide us with important clues about what the market might do next, especially regarding when Altseason (the period of growth for altcoins) might begin.
CRYPTOCAP:BTC.D
What is Bitcoin Dominance (BTC.D)?
Simply put, Bitcoin Dominance indicates the percentage of the total value of all digital currencies that is held by Bitcoin. For example, if the total value of all digital currencies is $1 trillion and Bitcoin's value is $600 billion, then Bitcoin's Dominance is 60%.
This number is very important because:
It shows market feeling: When Bitcoin Dominance goes up, it usually means money is moving to Bitcoin as a safer option, and people are less willing to take risks. When Bitcoin Dominance goes down, it can mean people are more confident in altcoins and are ready to take more risks for bigger profits.
It shows money flow: Changes in BTC.D show how money is moving between Bitcoin and altcoins.
❓ What is Altseason?
Altseason is a time in the digital currency market when altcoins (digital currencies other than Bitcoin) do much better than Bitcoin, and their prices go up a lot.
During Altseason, money often flows from Bitcoin to altcoins, and many altcoins can see their prices increase many times over.
Looking at the Current Bitcoin Dominance Chart and forecasting Altseason
If we look at the provided chart for Bitcoin Dominance (BTC.D), we can see a few key things:
Long-term upward channel: The chart shows that Bitcoin Dominance has been in a long-term upward path. The bottom of this path is marked by a blue support line , and the top is marked by a red resistance line . This means that, in the bigger picture, Bitcoin's control over the market has been growing.
Broken short-term upward trend: There was a shorter-term upward trend line (shown in black on the image) that the price broke below on May 9th . This break could be an early warning sign that Bitcoin's dominance might be weakening in the short term, and its dominance might start to fall.
⚠️ But here is a very important point:
We cannot be sure that Altseason has definitely started until the price clearly breaks below the main support line of the channel (the blue line) and stays below it.
The break of the short-term upward trend line (black line) is an early signal. However, to confirm a change in the trend and the possible start of a significant Altseason, we need to see stronger support levels, like the blue support line on the chart, get broken.
⏳ So, When Should We Expect Altseason?
Based on the chart analysis and the points mentioned:
Early Sign: The break of the short-term upward trend line (black) on May 9th might make people pay more attention to altcoins, but it's not enough on its own.
Key Condition for Altseason: The most important signal for the start of a real Altseason would be if the Bitcoin Dominance price breaks below the blue support line of the long-term upward channel. As long as Bitcoin Dominance stays above this support line, Bitcoin will likely keep its relative strength in the market, and altcoins might only see limited growth or could even face selling pressure.
Conclusion:
Analyzing Bitcoin Dominance is a useful tool for understanding how the digital currency market works and for predicting possible trends. Right now, because the short-term trend line has been broken, the market is at a sensitive point. However, traders and investors should watch the BTC.D price movements very carefully and wait for stronger confirmations, especially a possible break of the blue support line, before announcing the start of Altseason.

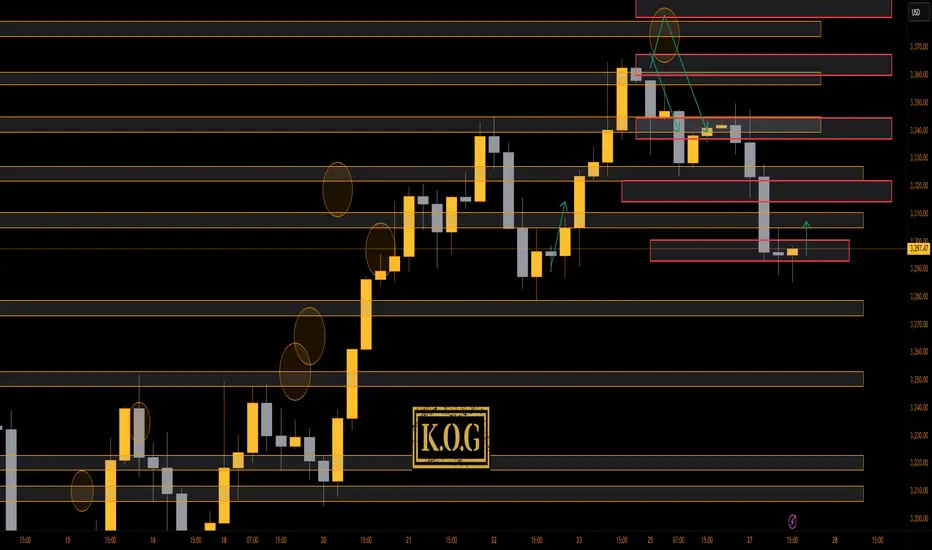
THE KOG REPORT - UpdateEnd of day update from us here at KOG:
It's been a fantastic start to the week with the red box holding nicely to give traders the short trade using the red boxes and KOG's target levels, which are all completed for the week here.
We now have support below at the 3285 level which if continues to hold, should give traders another opportunity into that 3306-10 region. We've already taken one into 3304, so for us no more trading until tomorrow. That's the level to watch in our opinion for a potential flip.
As always, trade safe.
KOG
Nvidia - The breakout will eventually follow!Nvidia - NASDAQ:NVDA - will break out soon:
(click chart above to see the in depth analysis👆🏻)
Over the course of the past couple of days, we saw a quite strong rally of +50% on Nvidia. Considering the market cap of this company, such a move is quite impressive. Following this overall very strong bullish momentum, an all time high breakout is quite likely to happen soon.
Levels to watch: $150
Keep your long term vision!
Philip (BasicTrading)

USDJPY Returns to Key Support – Another Bounce Ahead?At the end of April and beginning of May, I pointed out the importance of the 142 support zone and argued that USDJPY could reverse to the upside, targeting the 146 resistance.
The pair did exactly that — not only hitting the 146 target, but also spiking as high as 148, reaching the next major resistance.
🔁 Now We're Back towards 142
Since mid-May, USDJPY has pulled back again and is now retesting the 142 area — the same zone that previously triggered a strong bounce.
📌 Outlook and Trading Plan
I still consider the 142 level a solid support, and this recent drop could offer a new buying opportunity.
Any dips under 142 that quickly reverse can be used to build long positions, with a target once more around 146.
That offers a clear trade setup with a good risk-to-reward ratio.
Disclosure: I am part of Trade Nation's Influencer program and receive a monthly fee for using their TradingView charts in my analyses and educational articles.

EUR/USD - Is the uptrend about to end?The EUR/USD currency pair has demonstrated a consistent uptrend on the 4-hour chart for approximately two weeks. This sustained bullish momentum has captured the attention of traders and analysts alike, who are now questioning whether the pair can maintain its upward trajectory or if a retracement is imminent as it approaches significant resistance levels.
Rising wedge
A closer examination of the price action reveals that EUR/USD has been advancing within a rising wedge formation. This technical pattern is generally considered bearish, as it often precedes a reversal or a breakdown rather than a continued rally. Rising wedges are characterized by converging trendlines, with price making higher highs and higher lows at a diminishing rate, which typically signals waning bullish momentum and a potential for sellers to regain control.
Strong resistance
Recently, the pair encountered a notable resistance zone around the 1.141 level. Upon reaching this area, EUR/USD faced a rejection, resulting in a pullback from its recent highs. While there is a possibility that the pair could make another attempt to test this resistance, the initial rejection suggests that the upward move may be losing steam. As a result, the likelihood of a retracement has increased, especially given the bearish implications of the rising wedge pattern.
Support/target zone
If the pair does indeed correct lower, a logical target for a cooldown would be the green support zone near 1.127. This level has previously acted as a strong support area, and it could serve as a foundation for buyers to step in once more, potentially setting the stage for another move higher. Until the resistance at 1.141 is decisively broken, caution is warranted, and a period of consolidation or a pullback towards support appears increasingly probable.
Thanks for your support.
- Make sure to follow me so you don't miss out on the next analysis!
- Drop a like and leave a comment!

Quasimodo Pattern + Validator Support = Bullish Signal for ETHToday I want to analyze Ethereum ( BINANCE:ETHUSDT ) for you, many tokens are on the Ethereum network , and the increase or decrease of Ethereum directly affects most tokens.
So please stay with me.
Ethereum is trading in a Heavy Resistance zone($2,929_$2,652) near the Resistance lines and 200_SMA(Daily) . It is worth noting that Ethereum is preparing itself for a third attack on 200_SMA(Daily).
In terms of Price Action Analysis , Ethereum could start to rise with the help of the Bullish Quasimodo Pattern and break out of 200_SMA(Daily) and Resistance lines .
In terms of Elliott Wave theory , Ethereum appears to have completed a main wave 4 near Important Support lines . The structure of the main wave 4 is a Double Three Correction(WXY) . By breaking the 200_SMA(Daily) and Resistance lines , we can confirm the end of the main wave 4 .
The ETHBTC ( BINANCE:ETHBTC ) chart conditions are bullish , so it seems like investing in Ethereum could be better than Bitcoin . At least if the market falls , Ethereum is likely to be less likely to suffer a decline .
Note : Over 150,000 Ethereum validators, representing approximately 15% of the network, signaled support for increasing the gas limit from 36 million to 60 million units. This proposed change aims to enhance network capacity, reduce transaction fees, and improve scalability. While this development could positively impact ETH's price by making the network more efficient, it's essential to monitor potential technical risks and ensure that decentralization is maintained.
Note: If Ethereum touches $2,547 , we can expect further declines.
Please respect each other's ideas and express them politely if you agree or disagree.
Ethereum Analyze (ETHUSDT), 1-hour time frame.
Be sure to follow the updated ideas.
Do not forget to put a Stop loss for your positions (For every position you want to open).
Please follow your strategy and updates; this is just my Idea, and I will gladly see your ideas in this post.
Please do not forget the ✅' like '✅ button 🙏😊 & Share it with your friends; thanks, and Trade safe.

Gold Daily Plan – 27 May 2025 | Sniper Eyes OnlyHey GoldMinds! Hope you’re ready – price action is about to get spicy. We’re coming off a slow Monday, but Tuesday’s bringing a real battlefield between bulls and bears. Here’s what you need to watch like a hawk:
Key Structure Zones to Watch
ABOVE PRICE
3,347 – 3,353:
First real resistance — expect quick reactions. If price stalls here, scalp sellers could step in.
Eyes on for short-term fade, but not the main battle zone!
3,360 – 3,370:
The premium supply and real strong high zone.
If price pushes here, watch for fakeouts, stop hunts, or sharp reversals. This is where the big bears get interested!
BELOW PRICE
3,339 – 3,342:
Micro support and flip area.
If bulls hold this, we can see another push up. If it breaks, momentum likely shifts down fast.
3,328 – 3,335:
First solid demand for sniper entries.
Best spot for a confirmed buy if price sweeps this area and shows rejection.
3,310 – 3,318:
Deep discount demand — the last real defense before we talk about a bigger correction.
If we get here, expect a wild reaction or “nothing zone” if broken.
Bias & Confluence
Trend: Bullish bias, but momentum is fading and liquidity is thick up top.
EMAs (5/21/50/100): Tightening up, watch for a fresh cross if volatility spikes.
RSI: Neutral, with hidden bearish divergence possible at 3,360+.
FVG/OBs: Marked in the key zones, especially above 3,347 and below 3,335.
Liquidity: Above 3,353 and below 3,335 — sweeps are highly likely before real direction.
Sniper Plan for Tuesday
If price pushes into 3,347–3,353, don’t chase — wait for a reaction or sweep, then short only with confirmation.
If price rockets to 3,360–3,370, eyes wide open for a sweep and sharp rejection. This is “hunt zone” for high-probability shorts.
If price dips to 3,339–3,342, monitor for bounce, but don’t rush buys unless you see confirmation.
True buy interest at 3,328–3,335 — best sniper long setups if price wicks this area and rejects hard.
Final support at 3,310–3,318 — “do or die” for the bulls.
Quick Take
📉 Don’t get chopped in the middle — play the real zones! Wait for the market to give you confirmation at the extremes. Sniper trading only, no FOMO.
📈 If you’re not sure, let the dust settle. Remember, patience = profits.
🔥 Drop a 🚀 if you’re ready to catch the next big move! What’s your bias for Tuesday? Follow & Comment below and let’s crush this week together.
— GoldFxMinds

XAUUSD.. gold 4H charts pattern I'm outlining a short (SELL) trade setup for XAU/USD (Gold). Here's a breakdown of your trade idea:
Entry: 3308 (SELL)
First Target (FVG): 3250
(FVG likely refers to a Fair Value Gap – a liquidity target in imbalanced price zones)
Final Target: 3140
Let’s assess the setup:
Key Points to Consider:
1. Risk Management:
Have you set a stop-loss? For this short, a logical SL might be above recent highs or structure – perhaps around 3330–3340.
Position sizing is critical depending on account size and risk tolerance.
2. Market Context:
Is this based on a higher time frame imbalance, a bearish trend continuation, or news catalyst?
Are you following a liquidity sweep strategy or reacting to a key resistance rejection?
3. Technical Confirmation:
Confirmation from order blocks, bearish divergence, or break of market structure (BOS) could strengthen your setup.
Would you like me to:
Analyze the chart if you provide a screenshot?
Provide a technical breakdown of current XAUUSD levels?
Help calculate risk-to-reward or position size for this trade?
Let me know how you'd like to proceed.

GBP/USD Breakout (28.05.2025)The GBP/USD Pair on the M30 timeframe presents a Potential Selling Opportunity due to a recent Formation of a Breakout Pattern. This suggests a shift in momentum towards the downside in the coming hours.
Possible Short Trade:
Entry: Consider Entering A Short Position around Trendline Of The Pattern.
Target Levels:
1st Support – 1.3424
2nd Support – 1.3380
🎁 Please hit the like button and
🎁 Leave a comment to support for My Post !
Your likes and comments are incredibly motivating and will encourage me to share more analysis with you.
Best Regards, KABHI_TA_TRADING
Thank you.
Disclosure: I am part of Trade Nation's Influencer program and receive a monthly fee for using their TradingView charts in my analysis.
