Bitcoin - Can the ascending triangle be broken?Introduction
Bitcoin is currently consolidating within a well-defined structure after weeks of volatile movement. Despite several failed attempts to break higher, the market continues to compress just beneath a major resistance zone. This type of tightening price action often signals a larger move approaching, as liquidity begins to build on both sides of the range. The chart highlights two key elements that will likely determine BTC’s next direction: the ascending triangle formation and the liquidity level resting below current price. Understanding how price reacts to these areas will be essential for anticipating the next significant impulse.
Ascending Triangle
BTC is forming an ascending triangle pattern, characterized by rising lows meeting a relatively horizontal zone of resistance. This resistance band, highlighted on the chart, has repeatedly capped upward attempts. Each time BTC pushes into the zone, it is met with selling pressure, but the higher lows reveal that buyers are steadily gaining ground. This pattern typically suggests accumulation and a potential bullish breakout once enough pressure builds.
If BTC can break above the upper boundary of this triangle with strength and volume, the move would likely target higher liquidity pools above recent highs. Such a breakout often leads to an impulsive leg upward, as trapped short positions are forced to cover and momentum buyers join in. For now, the ascending trendline remains a key structural support that defines the bullish side of this pattern.
Liquidity Level
Below the current range lies a clear liquidity zone, created by a cluster of equal lows and untested downside levels. This area is marked on the chart and represents where stop-loss orders and resting liquidity are likely positioned. Markets often revisit such zones before making a decisive breakout, particularly in triangle structures where liquidity builds on both sides.
A sweep of this liquidity, combined with a tap into the ascending trendline, would be a textbook setup for buyers to step back in. If BTC dips into this zone and rebounds strongly, it would further strengthen the market structure and increase the likelihood that the eventual breakout takes place to the upside. However, if this liquidity level fails and price breaks below the trendline, the bullish structure would be invalidated, opening the door for a deeper move down.
Final Thoughts
BTC is approaching a decision point, with price tightening inside an ascending triangle while liquidity pools gather below. As long as the ascending trendline continues to act as support, the market maintains a bullish bias, and a breakout above the resistance zone becomes increasingly likely. Still, a liquidity sweep to the downside before any major rally remains a strong possibility. Traders should pay close attention to how BTC reacts if it dips into the liquidity zone, as this response will reveal whether buyers are prepared to defend the structure. A clean breakout above the resistance band would confirm the next bullish leg, while a breakdown below the ascending trendline would signal weakness and shift the outlook.
Community ideas

The Real Bitcoin Bottom: It’s in the Power BillThe Cost of Mining 1 BTC – Autumn 2025 Deep Dive
First of all, I want to say that I already made a similar publication in 2020 about the cost of Bitcoin, and we reached these levels (the chart is below).
Introduction: The Bitcoin mining industry in Autumn 2025 stands at a crossroads. Network difficulty has soared to all-time highs, squeezing miner profit margins as hashpower races ahead of price. The hashprice – the daily revenue per unit of hashing power – has slumped to record lows around $54 per PH/s-day (down from ~$70 a year ago). Analysts expect this metric to languish between $50 and $32 until the next halving in 2028, underscoring how challenging the economics have become. In this environment, understanding the cost to mine 1 Bitcoin is more crucial than ever. Below, we present a detailed comparison of popular ASIC miners and analyze which rigs remain profitable (or not) at current prices. We’ll also explore how the cost of production acts like a magnetic price level for BTC – often drawing the market down to this “floor” before a rebound – and what that means for investors now.
Cost to Mine 1 BTC by ASIC Miner Model (at $0.03–$0.10/kWh)
To quantify Bitcoin’s production cost, we compare leading ASIC miners from Bitmain, MicroBT, Canaan, Bitdeer, and Block. Table 1 below shows key specs and the estimated cost to mine one BTC under different electricity prices (from very cheap $0.03/kWh to pricey $0.10/kWh):
Key Takeaways:
Electricity price is the dominant factor in mining cost. At an ultra-cheap $0.03/kWh (possible in regions with subsidized power or stranded energy), even older-generation miners can produce BTC for well under $30k per coin. In our table, all models have a cost per BTC between ~$21k and $27k at $0.03/kWh – a fraction of Bitcoin’s current ~$90k–$95k market price.
At a mid-tier rate of $0.05/kWh (typical for industrial miners in energy-rich areas), the top machines still show healthy margins. Bitmain’s flagship S21 XP leads with roughly $36k cost per BTC, while other new-gen rigs fall in the ~$39k–$45k range. These figures imply profit margins of 50–60% for efficient miners at $0.05 power.
At a pricey $0.10/kWh (common for retail electricity or high-tariff regions), mining costs skyrocket. Only the very latest ASIC (S21 XP) stays comfortably below the current BTC price, at around $72k per coin. Most other models hover in the $78k–$90k range, meaning their operators are earning little to no profit at spot prices. In fact, at $0.10/kWh, a miner like the Avalon A15 Pro would spend about $89k to generate one BTC – essentially breakeven with Bitcoin at ~$90k. This illustrates why high-power-cost miners struggle or shut off during downturns.
Profitable vs. Unprofitable: Current Market Reality
Which miners are still profitable at today’s rates? Given Bitcoin’s price in the low $90,000s and typical industrial electricity around $0.05–$0.07/kWh, the newest generation ASICs remain comfortably profitable, while older, less efficient models are on the edge. For example:
Latest-gen winners: The Bitmain S21 XP – with industry-best ~13.5 J/TH efficiency – can mine a coin for roughly $36k at $0.05/kWh, leaving a huge cushion against price. Even at $0.07/kWh (a common hosting rate), its cost per BTC would be on the order of ~$50k, still well below market price. Other 2024–2025 flagship units (Whatsminer M60S++, Bitdeer A2 Pro, Block’s Proto) likewise have breakeven power costs around $0.12–0.13/kWh; they remain viable in most regions except the very expensive ones.
Older-gen on the brink: By contrast, an earlier-gen workhorse like the Antminer S19 XP ( ~21.5 J/TH) or similarly efficient rigs from 2021–2022 generation become marginal at moderate power rates. An S19 XP mining at $0.08/kWh sees its cost per BTC climb to roughly ~$94k (near current price), and at $0.10 it exceeds $110k (mining at a loss). Many such units are only profitable in locales with <$0.05 power. This is why we’ve seen miners with older fleets either upgrade or retire hardware as the margin for profitability narrows.
The efficiency gap: The spread between best-in-class and older miners translates directly into survivability. A miner burning 30–40 J/TH can only stay online if they have extremely cheap electricity or if BTC’s price is far above average production cost. As of Q4 2025, Bitcoin’s price is indeed high, but so is the network difficulty – meaning inefficient gear yields so little BTC that electricity costs outweigh revenue in many cases.
According to one industry report, the cost of mining 1 BTC varies widely across companies – from as low as ~$14.4k for those with exceptional power contracts (e.g. TeraWulf’s U.S. facilities) to as high as ~$65.9k for others like Riot Platforms, even before accounting for overhead. (Riot’s effective cost was brought down to ~$49.5k after cost-cutting measures.) This huge range shows how electricity pricing and efficiency determine which miners thrive. In early 2025, the situation became so extreme that CoinShares analysts found the average all-in production cost for public mining companies spiked to ~$82,000 per coin – nearly double the prior quarter (post-halving impact) – and up to $137,000 for smaller operators
ixbt.com
. At that time Bitcoin was trading around $94k, meaning many miners, especially smaller ones, were underwater and operating at a loss. In high-cost regions like Germany, the breakeven cost even hit an absurd ~$200k per BTC, making mining there utterly unviable.
Bottom line: At current prices, only miners with efficient rigs and reasonably cheap power are making money. Those with older equipment or expensive electricity have minimal margins or are already in the red. This dynamic naturally leads to miners shutting off machines that don’t profit, which in turn caps the network hashrate growth until either price rises or difficulty drops. It’s a self-correcting mechanism – one that ties directly into Bitcoin’s production cost acting as a market floor.
Production Cost as Bitcoin’s “Magnetic” Price Level
There’s a saying in the mining community: “Bitcoin’s price gravitates toward its cost of production.” In practice, the production cost often behaves like a magnet and a floor for the market. When the spot price climbs far above the cost to mine, it invites more hashing power (and new investment in miners) until rising difficulty pulls costs up. Conversely, if price falls below the average production cost, miners start to capitulate – selling coins and shutting rigs – until the difficulty eases and the market finds a bottom. This push-pull keeps price and cost loosely tethered over the long run.
Notably, JPMorgan’s research this cycle highlighted that Bitcoin’s all-in production cost (now around ~$94,000) has “empirically acted as a floor for Bitcoin” in past cycles. In other words, the market has rarely traded for long below the prevailing cost to mine, because at that point fundamental supply dynamics kick in. As of late 2025, they estimate the spot price is hovering just barely above 1.0 times the cost (~1.03x) – near the lowest end of its historical range. This implies miners’ operating margins are razor-thin right now, and any extended move significantly below ~$94k would likely trigger miner capitulation and supply contraction. In plainer terms: downside from here is naturally limited – not by hope or hype, but by the economics of mining. If BTC dropped well under the cost floor, many miners would simply turn off machines rather than mine at a loss, removing sell pressure and helping put in a price bottom.
History supports this magnetic pull. In previous bear markets, Bitcoin has tended to retest its production cost during the worst of capitulations. For example, during the late-2018 crash and again in the 2022 downturn, BTC prices plunged to levels that put numerous miners out of business. But those phases were short-lived. Prices found support once enough miners quit and difficulty adjusted downward, allowing the survivors to breathe. The market “wants” to stay near the cost of production, as that is a sustainable equilibrium where miners neither drop like flies nor earn excessive profits. Whenever price strays too high above cost, it usually invites a surge in competition (hashrate) that raises the cost floor; when price sinks too low, hashpower falls until cost drops to meet price. It’s an elegant economic dance built into Bitcoin’s design.
Why Price Often Meets Cost Before Rebounding
If Bitcoin production cost is a de facto floor, why do we often see price fall all the way down to it (or even briefly below it) before the next big rally? The answer lies in miner psychology and market cyclicality:
Miner Capitulation & Shakeouts: Markets are cruel to the over-leveraged and inefficient. During bull runs, miners expand operations, often taking on debt or high operating costs under the assumption of continually high prices. When the cycle turns, Bitcoin’s price can free-fall toward the cost of production, erasing margins. The weakest miners (highest costs or debt loads) capitulate first – selling off their BTC reserves and unplugging hardware. This wave of forced selling can push price right to (or slightly under) the cost floor, marking a final “shakeout” of excess. Only when the weakest hands are flushed does the market rebound. It’s no coincidence that major bottoms often align with news of miner bankruptcies or mass liquidations.
The Iron Law of Hashrate: Miners are competitive and will run at breakeven or even slight loss for some time, hoping for recovery, rather than quit immediately. This means the network can temporarily operate above sustainable difficulty levels. Eventually, however, reality sets in. When enough miners can’t pay the bills, hashrate plateaus or drops, halting difficulty growth or causing it to decline. At that inflection point, the cost of mining stabilizes (or falls), giving relief to the remaining miners. The stage is set for price to rebound off the now-lower equilibrium. In essence, Bitcoin often has to tag its production cost to force a network reset and purge imprudent operators. Only after that cleansing can a fresh uptrend begin with a healthier foundation.
Investor Sentiment at the Floor: From a contrarian market perspective, a convergence of price and production cost typically corresponds with maximum pessimism. If Bitcoin is trading at or below what it “should” cost to make, it signals extreme undervaluation to savvy investors. In late 2022, for instance, estimates of BTC’s cost basis in the $18k–$20k range coincided with the market trading in the mid-$15k’s – a level where miners were going bankrupt and sentiment was in the gutter. Yet those willing to be greedy when miners were fearful reaped the rewards when price recovered. The same pattern could be unfolding now in late 2025: the public is fearful of Bitcoin’s recent pullback, but its cost floor (~$94k) suggests fundamental value support. Smart money knows that when price meets cost, downside is limited and upside potential grows.
Conclusion – Steeling Ourselves at the Cost Floor
In EXCAVO’s signature fashion, let’s cut through the noise: Bitcoin’s production cost is the line in the sand – the magnetized level where price and reality meet. As of Autumn 2025, that line hovers in the mid-$90,000s, and Bitcoin has indeed been gravitating here. The data shows miners barely breaking even on average. This is a make-or-break moment. If you’re bullish because everyone else is, check your thesis – the real reason to be bullish is that BTC is scraping its cost floor, a level from which it has historically sprung back with vengeance. Conversely, if you’re panicking out of positions now, remember that you’re selling into the teeth of fundamental support. The market loves to punish latecomers who buy high and sell low.
Yes, the mining industry is under stress; yes, the headlines scream fear. But those very pressures are what forge the next bull run. Every miner that shuts off today is one less source of sell pressure tomorrow. Every uptick in efficiency raises the floor that much higher, like a coiled spring tightening. Bitcoin has been here before – when production cost and price locked jaws in late 2022, and again in early 2025 post-halving. Each time, the doom and gloom was followed by a dramatic recovery as the imbalances corrected.
Our contrarian take: The cost of mining 1 BTC isn’t just a number on a spreadsheet – it’s the secret pulse of the market. Right now it’s telling us that the bottom is in or very near. Prices might chop around this magnet a bit longer, even dip slightly below in a final fake-out, but odds of a deep crash under the ~$94k cost basis are slim. The longer Bitcoin grinds at or below miners’ breakeven, the more hashpower will fall off, quietly tightening supply. When the spring releases, the next upward leg could be explosive (as even mainstream analysts like JPMorgan are eyeing ~$170k targets).
In summary, Bitcoin tends to revisit its production cost for one last test – and when it holds, it launches. Autumn 2025 appears to be giving us that test. The savvy, data-driven operator will view this not with panic, but with patience and resolve. After all, if you can accumulate Bitcoin near its intrinsic mining value while the herd is fearful, you position yourself on the right side of the trade once the inevitable rebound kicks in. As the saying goes, bears win, bulls win, but miners (and hodlers) who understand the cost dynamics win big in the end. Brace yourself, stay analytical, and remember: Bitcoin’s true floor is built in watts and hashes, and it’s solid as steel.
Best regards EXCAVO

Bitcoin Approaches Key Resistance and Prepares for Its Next MoveHi everyone, Domic here!
This week, the market has provided enough support for Bitcoin to recover, but not enough of a catalyst for a true breakout. The Fed’s 0.25% rate cut continues to favor risk assets, yet investors remain cautious ahead of the December 16 Nonfarm Payrolls report. If labor data weakens, expectations for further rate cuts will rise — a direct tailwind for BTC. On the other hand, an overly strong report could trigger selling near dynamic resistance zones such as the EMA34.
On the news side, the crypto market is lacking major catalysts: no new ETFs, no sudden inflows, and no events on the scale of a halving. Because of that, BTC’s current recovery is driven more by technical factors than by news.
Technically, BTC has bounced from the 86,000–88,000 zone with a clear set of bullish signals: long lower wicks, improving volume, and solid absorption of selling pressure. Price is now testing the EMA34 around 93,846 — a level where BTC has been rejected multiple times since October. This is a crucial “checkpoint,” and if price closes above it on the daily chart, the trend structure will shift significantly. The next target would be the EMA89 near 101,023 — considered the final line of defense for the long-term downtrend. A breakout above EMA89 would almost confirm a new bullish cycle.
In the main scenario, I expect BTC to face mild rejection at the EMA34 and pull back to the 90,500–91,500 zone to gather liquidity before attempting another push. If buyers defend this area well, BTC could break above 94,000 and move toward 96,500 – 98,000 – 101,000, with 101,000 (EMA89) being the decisive level that would open the door to a true “acceleration phase.”

Opinion about SPY(or ES!) directionHello, yesterday i have uploaded an analysis regarding BTC short position, after market close i want to suggest a stance about S&P500's next direction over few weeks to possible a month.
Macro-economic Context
Mentioned earlier, Powell have suggested uncertain rate decision stall or possibly cut in January FOMC. In many times FED have implied uncertainty in the interview scripts, but this time was different as Japanese rate decision is upcoming next week and stock market/cryptocurrency's liquidity have been low for 2months starting from October. As we integrate macro economic context to technical standpoint we can also probe higher sell power compared to bull force as in big tech stocks, such as NVDA or AMD, the news of China-US semiconductor sentiment regrading bull news or H20 chip bull news have only hunted short positions, yet have not suggested clear direction to upside.
{This post is actually not about where to buy, sell, stop out or leverage how much but this is more about knowing about general economic landscape so we, the crypto traders can see clearer picture of current liqudity flows.}
Technical standpoint
In this chart as we can all see the SPY touched major trendline connecting two major highs, now falling down post-FOMC. As this kind of structure formed, the former high have acted as resistance as well articulating short-term confluence/double top zone. However we are still uncertain as the price didn't actually drop down the double top zone, yet it is quite evident that price is failing to reclaim ATH in this current landscape further reinforcing the thesis of 'Traders are uncertain about an actual direction'
Final Opinion
So my stance is just two,
1. We should keep eye on Polymarket January rate cut odds, as i am not really familiar with prediction market betting i believe you guys have your own ways to decode the analysis of it
2. Although i think the price will keep slipping down, failing to break the structure of Lower-Low, Lower-High, it is important to not open aggressive short position unless the confirmation of 'double top' pattern formation have been validated.
Thank you for reading my weekend report, hope you guys have merry bullish Christmas.
*This is for educational purposes only, make your own decision, not a trading advice.

EURUSD Bullish Continuation Toward 1.17802Quick Summary
After the recent strong rally, EURUSD is expected to continue higher following a brief corrective move. The pair has not yet reached 1.17802, which remains a valid upside target. A pullback toward the H1 orderblock at 1.17080, aligned with the 61 Fibonacci level, may provide a solid buy opportunity if a clear reversal signal appears.
Full Analysis
EURUSD has delivered a strong bullish move recently, confirming sustained buying pressure in the market. Despite this strength, EURUSD has not yet reached the key level at 1.17802, which remains an active target within the current bullish structure.
Before continuing toward this level, a short term correction is likely. This pullback is expected to bring price into the H1 orderblock around 1.17080. The importance of this zone is reinforced by its alignment with the 61 Fibonacci retracement, making it a technically strong area for potential demand.
The preferred approach is not to buy the level blindly. A clear reversal signal or rejection from the orderblock is required to confirm that buyers are stepping back in. If such a reaction appears, the correction would likely be complete, opening the path for EURUSD to resume its upward move and continue toward 1.17802.

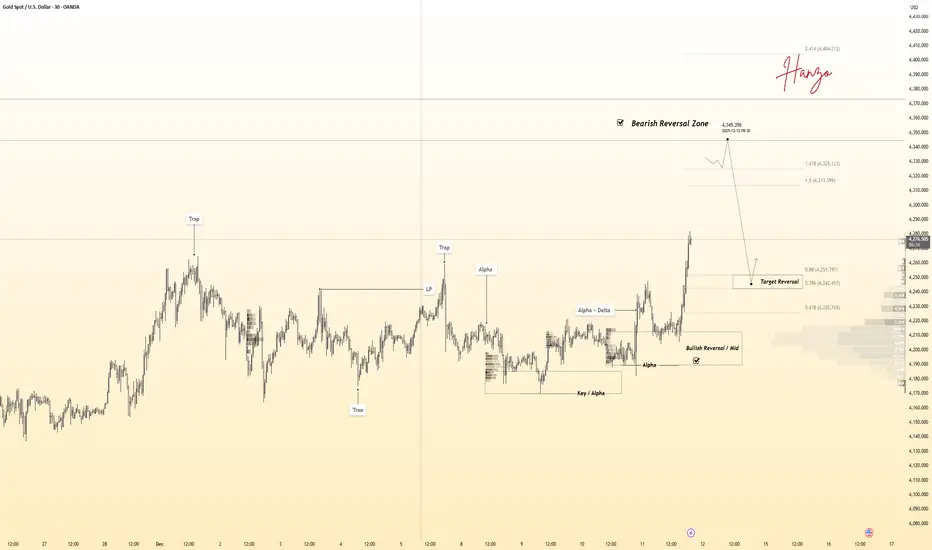
Gold 30Min Engaged ( Bearish Volume Reversal entry Detected )⚡Base : Hanzo Trading Alpha Algorithm
The algorithm calculates volatility displacement vs liquidity recovery, identifying where probability meets imbalance.
It trades only where precision, volume, and manipulation intersect —only logic.
✈️ Technical Reasons
/ Direction — SHORT / Reversal 4345 Area
☄️Bearish rejection confirmed through sharp candle body.
☄️Lower-high forming beneath resistance supply region.
☄️Volume decreasing confirms exhaustion in price rally.
☄️Sellers regained imbalance with heavy top rejection.
☄️Algorithm detects fading demand and shift to control.
⚙️ Hanzo Alpha Trading Protocol
The Alpha Candle defines the day’s real control zone — the first battle of momentum.
From this origin, the Volume Window reveals where the next precision strike begins.
⚙️ Hanzo Volume Window / Map
Window tracked from 10:30 — mapping true market behavior.
POC alignment exposes institutional bias and breakout potential zones.
⚙️ Hanzo Delta Window / Pulse
Delta window monitors real buying vs. selling power behind each move.
Tracks volume aggression to expose who controls the candle — buyers or sellers.
When Delta aligns with Volume Map, momentum becomes undeniable.
Volume Do Not Predict Price! - It Explains It!Most traders look at volume the wrong way.✖️
They expect volume to tell them where price will go next.
But volume’s real job is much more important:
Volume explains why price moved the way it did.
If you learn to read volume correctly, price action becomes clearer, not noisier.
1️⃣ Price Up + Rising Volume = Commitment
When price moves higher and volume expands, it means buyers are committed, not just reacting.
This is not random buying.
This is participation.
📈Rising volume during an impulse confirms that the move is supported by real interest, not just thin liquidity.
Strong trends are built on expanding volume.
2️⃣ Price Up + Falling Volume = Warning
When price continues higher but volume dries up, something changes.
The move still exists... but conviction doesn’t.
This often signals:
- exhaustion
- a potential pause
- or an upcoming correction
That’s when professionals stop chasing and start managing risk.
3️⃣ Sideways Price + Rising Volume = Accumulation or Distribution
This is where most traders get confused:
Price isn’t moving much, but volume is increasing.
That’s not boredom.
That’s positioning.
Large players don’t chase price.
They build positions quietly while price looks “dead.”
Breakouts that follow these zones tend to be fast and decisive, because the work was already done.❗️
4️⃣ Breakouts Without Volume Are Suspect
A breakout candle looks exciting.
But without volume, it’s just a move, not a decision.
Low-volume breakouts often lead to:
- fakeouts
- traps
- fast reversals
🏹Volume doesn’t need to explode... but it needs to confirm participation.
💡The Big Picture
Volume is not a signal by itself. It’s context.
Price tells you what happened, while Volume tells you how serious that move really was.
✔️When price and volume agree, trades feel easy.
✖️When they disagree, something important is hiding underneath.
⚠️ Disclaimer: This is not financial advice. Always do your own research and manage risk properly.
📚 Stick to your trading plan regarding entries, risk, and management.
Good luck! 🍀
All Strategies Are Good; If Managed Properly!
~Richard Nasr

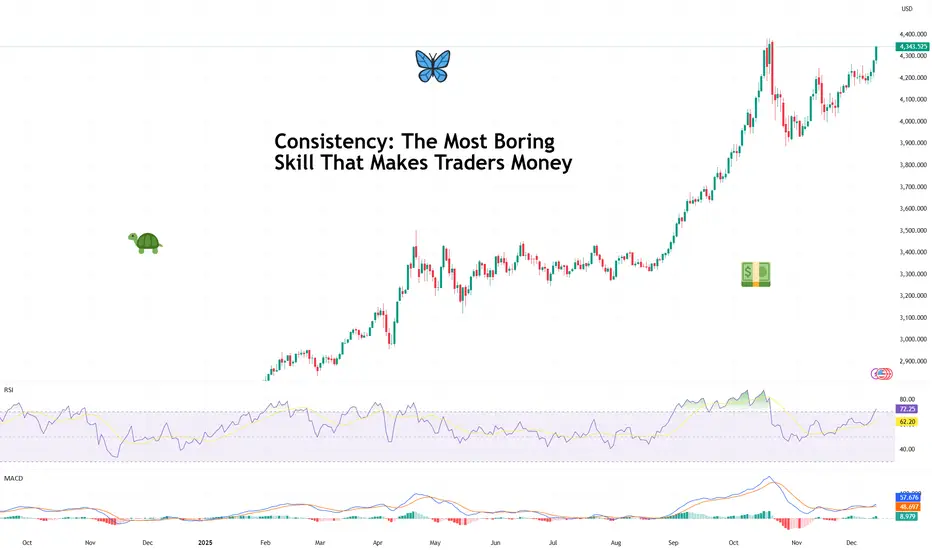
Consistency: The Most Boring Skill That Makes Traders MoneyAsk traders how they made their money and you’ll hear stories about perfect entries, heroic conviction, and that one legendary going-for-the-jugular trade they’ll mention at every dinner party.
What you almost never hear about is consistency — because it’s not glamorous, it doesn’t screenshot well, and it definitely doesn’t come with fireworks.
But consistency is the skill that turns trading from an emotional roller coaster into a durable business. It’s boring. It’s repetitive. And it’s responsible for more profitable careers than any secret indicator ever will.
🧠 Why the Market Rewards the Unexciting
Markets don’t pay you for being clever. They pay you for being repeatable.
Consistency works because markets are probabilistic systems. No single trade matters in the long run. What matters is what happens over time, across dozens or hundreds of decisions. (Good time to look back and see how you did this year.)
The trader who makes reasonable decisions again and again — even without brilliance — will eventually outperform the trader who occasionally nails a perfect call but can’t stop freelancing.
Think of it less like poker and more like compound interest. It doesn’t wow you at first. Then one day, you realize you’ve done pretty darn well.
📊 The Myth of the Big Trade
Every trader remembers their biggest win. And there’s nothing wrong with that. Some big trades can pay for a lot of small mistakes .
Big wins feel validating. They trigger confidence. But they also create dangerous expectations. Traders start chasing that feeling — trading bigger, faster, looser — and consistency quietly exits through the back door.
Professional traders know that a great trade doesn’t prove skill. A series of disciplined trades does.
The market doesn’t care how exciting your best trade was. It cares how well you behaved on the other ninety-nine.
🧮 Consistency Is Math, Not Motivation
Consistent traders don’t wake up feeling like it’s their lucky day.
They operate within a framework that reduces randomness in their decisions. They trade fewer setups, not more. They accept that being flat for the week is a position. They understand that not every day is designed to reward them.
This isn’t about grinding harder. It’s about removing unnecessary choices so execution becomes automatic.
Ironically, the less you try to be exceptional, the more real and reliable your results become.
📉 Losing Is Part of the Job
Consistency shows up most clearly during losing streaks. Anyone can look disciplined after a winning week. The test comes when trades stop working, narratives shift, and the urge to “make it back” creeps in.
Consistent traders don’t panic. They don’t revenge trade . They don’t rewrite their strategy after three red days.
Instead, they understand that drawdowns are not failures — they’re rent paid for staying in the game. The goal isn’t to avoid losses. It’s to keep losses from changing behavior.
🧠 Confidence Comes from Repetition
One of the quiet benefits of consistency is confidence — the real kind. Not the loud, chest-thumping confidence that comes from a hot streak. But the calm assurance that comes from knowing you’ve executed your plan a hundred times before.
That confidence allows traders to stay neutral when others get emotional. To reduce size when conditions change. To wait without feeling left out.
It’s the difference between reacting to the market and responding to it. Regardless if it’s fever-pitch earnings season or the Economic Calendar is jam-packed with events.
🕰️ The Long Game Always Wins
With that in mind, trading careers aren’t built in viral moments. They’re built in years upon years of working on your craft.
The traders who last aren’t necessarily the smartest or fastest. They’re the ones who made it boring enough to sustain it. And eventually, almost accidentally, the process builds itself into something that looks a lot like success.
Off to you : What’s your consistency strategy saying? Is boring beautiful or is risk-taking maxed out in your portfolio? Share your thoughts in the comments!
EURUSDHello Traders! 👋
What are your thoughts on EURUSD?
EURUSD extended its rally and touched the upper boundary of the ascending channel.
After reaching this resistance area, price has started a pullback, which appears to be a healthy correction within the broader bullish structure.
Price is now expected to retrace toward the channel support, which overlaps with a strong demand zone and key Fibonacci levels (0.382–0.5).
This confluence area increases the probability of bullish reactions.
As long as the structure remains intact, a rebound from this support zone could trigger the next upward leg, targeting higher highs inside the channel.
Don’t forget to like and share your thoughts in the comments! ❤️

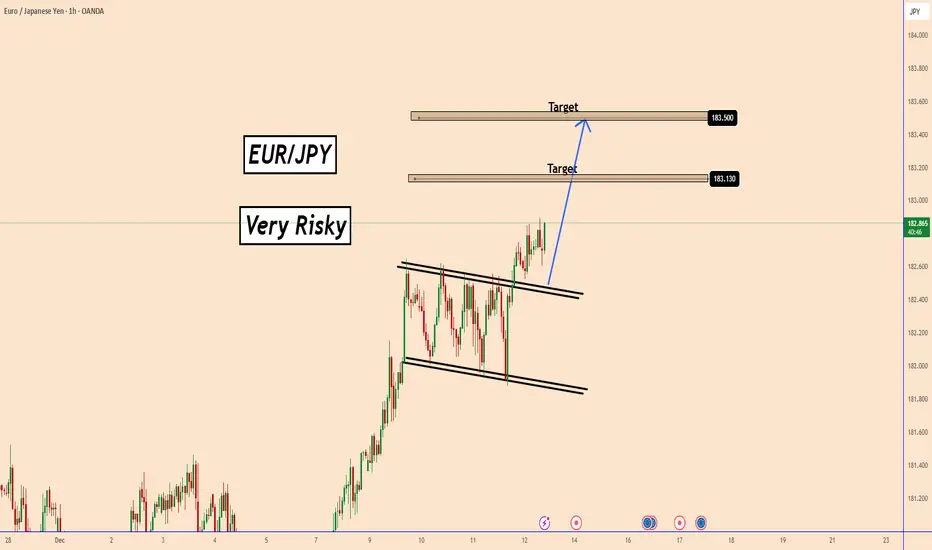
EURJPY Breaks the Flag! Bullish Continuation in PlayEURJPY Breaks the Flag! Bullish Continuation in Play
EURJPY continues its bullish momentum after breaking out of the Flag channel.
The breakout shows strong buyer pressure, and as long as the price holds above the channel’s upper boundary, the bullish structure remains intact.
With momentum building, EURJPY may head toward the next resistance levels, where short-term profit-taking could occur.
Targets:
183.13
183.50
You may find more details in the chart!
Thank you and Good Luck!
PS: Please support with a like or comment if you find this analysis useful for your trading day
EUR/USD Daily Chart Analysis For Week of Dec 12, 2025Technical Analysis and Outlook:
During the most recent trading session, the Eurodollar currency rose sharply, reaching the Mean Resistance level at 1.175, via the Mean Resistance level of 1.167. Current market conditions indicate that the price may pull back to the critical Mean Support level at 1.169.
However, it is also crucial to monitor the breakout level for this currency to the upside by a rise to the Interim Inner Currency Rally 1.178 via Mean Resistance 1.175.
Conversely, on the downside, a major re-ignited retracement may occur from the completed Interim Inner Currency Rally 1.178, with the possibility of extending to the Mean Support 1.163.

EURUSD 4-Hour: Liquidity HuntingThe following analysis is based on Liquidity Hunting logic on the EURUSD 4-Hour timeframe. The market is approaching a critical zone that smells like blood (Stop Losses).
1. Map of Parked Money (The Whale's Hunting Ground)
Smart Money always flows toward liquidity. Currently, the Price Magnet sits directly above the recent highs in the 1.1750 to 1.1800 range.
Buy-side Liquidity: Retail traders have hidden their Stop Losses (for Short positions) above the 1.1750 and 1.1800 peaks. Algorithms view this area as "fuel" for the next move.
Ultimate Target: If momentum persists, the primary liquidity pool lies above the September highs near 1.1900.
2. Recent Price Traps (Market Deception)
Observe the price action in November around the 1.1500 zone. The market executed a classic downside "Fake-out," convincing retail traders the trend was bearish, only to aggressively sweep their liquidity and reverse upward.
Current Status: The market is now creating "false hope" for late buyers (FOMO) to trap them right at the 1.1750 ceiling.
3. Institutional Footprint (The Concrete Wall)
Demand Zone (Support): The 1.1600 level is where heavy institutional orders are planted to defend the price. Any return to this zone will likely be met with algorithmic buying.
Supply Zone (Resistance): The 1.1800 - 1.1900 range is a heavy Bearish Order Block. Passing this zone without a corrective pullback will be extremely difficult.
4. The Next Ruthless Scenario (Projected Path)
Price (currently at 1.1737) is only a few pips away from the liquidity pool. Projected Path: There is a 90% probability the price will attack the stops above 1.1750 (Stop Hunt). Whales need these stops to trigger in order to generate the liquidity required for their next decision (either heavy selling or trend continuation).
5. Reaction Strategy (The Final Trigger)
This is the most critical part. Do not enter blindly. The reaction to the 1.1750 - 1.1800 zone is the deciding factor:
The Reversal Scenario (Sweep & Reclaim): If price spikes (wicks) above 1.1750/1.1780 quickly but the 4H candle fails to hold and the body closes below the resistance level (SFP - Swing Failure Pattern), this is a sign Whales are exiting/shorting.
Trigger: Short with a target back to 1.1600.
The Continuation Scenario (Valid Breakout): If a strong 4H candle (large body, small wick) closes firmly above 1.1800, the sell wall has been breached.
Trigger: Wait for a Retest of 1.1800, then Long targeting 1.1900.
WARNING: Price is currently in a "No Trade Zone" for buyers. The Risk-to-Reward ratio for a Long entry here is terrible. Wait for the reaction at 1.1750.

Sell EURUSD to 1.17I am shorting EURUSD to 1.17. Based on price action right now, this is what I am trading.

GOLD - Distribution phase. Target - ATH (4380), 4400...FX:XAUUSD is rallying after breaking through consolidation resistance. The fundamental background is positive, with the train heading for an all-time high.
Expectations of a soft Fed policy remain, with the market pricing in two rate cuts in 2026. India's pension fund regulator has allowed investments in gold and silver ETFs. An increase in US unemployment claims (+44,000) has heightened fears of a slowdown in the labor market.
A reversal in the Bank of Japan's policy (rate hike) and a pause by the ECB are boosting the appeal of gold.
Any correction is likely to be short-term and will be met with support from buyers. The baseline scenario remains bullish amid soft monetary policy and a weakening dollar.
Technically, it is dangerous to sell in the current market; it is worth looking for buying opportunities after corrections or pullbacks...
Resistance levels: 4325, 4335, 4380
Support levels: 4300, 4285, 4265
The rally phase is quite aggressive due to the long period of consolidation that the market has been in. All possible factors are supporting growth. In such a market, one can only buy on pullbacks. I expect a pullback from the indicated zone, within which growth to ATH can be considered.
Sincerely, R. Linda!

BTCUSDTHello Traders! 👋
What are your thoughts on BITCOIN?
Bitcoin is currently consolidating within a well-defined range between $88,000 and $95,000, while continuing to trade inside an ascending channel.
The lower boundary of this ascending channel aligns closely with the $88,000 support zone, adding confluence and strengthening this area as a key demand region. At the moment, price action is hovering near the channel support, suggesting that selling pressure is weakening.
As long as the price holds above the $88,000 support, we expect some short-term consolidation followed by a bullish push toward the upper range at $95,000.
A clean breakout above $95,000 could open the door for a continuation move toward the upper boundary of the ascending channel, which would act as the next upside target.
A sustained break below the channel support would invalidate this scenario.
Don’t forget to like and share your thoughts in the comments! ❤️

ETH/USD (2H timeframe)....ETH/USD (2H timeframe) chart clearly.
I have drawn a trendline break + bearish continuation with two downside targets.
Here are the exact targets based on My chart markings:
---
🎯 Target 1 (Short-term)
➡ $2,950 – $2,980 zone
This is the first major support area and aligns perfectly with your first target line.
---
🎯 Target 2 (Extended bearish target)
➡ $2,750 – $2,780 zone
This is the deeper support area you have marked, matching My second target zone.
---
📌 Summary
Current price: around $3,095
Trendline broke → bearish structure
Target 1: $2,950 area
Target 2: $2,760 area

BTCUSD Holds Buyer Zone - Push Toward 96,700 LikelyHello traders! Here’s my technical outlook on BTC/USD based on the current market structure. After a prolonged decline, Bitcoin reversed from the Support Level and broke out of the downward channel, shifting momentum in favor of buyers. The price then moved into a consolidation Range, where accumulation formed before a confirmed Breakout pushed BTC higher. Since then, Bitcoin has been respecting the rising Triangle Support Line, forming higher highs and higher lows. Buyers consistently defend this structure, keeping the bullish trend intact despite local corrections. Currently, BTC is holding above the 90,500–88,800 Buyer Zone, which serves as the key demand area maintaining bullish pressure. As long as the price stays above this zone, the upward scenario remains valid. The market is now heading toward the major 96,700 Resistance Level, located inside the broader Seller Zone. A breakout above this level may open the door for further continuation, while rejection could trigger a pullback toward the Triangle Support Line. For now, the structure favors buyers, with 96,700 as the main upside target. Please share this idea with your friends and click Boost 🚀

BTC Awaits a Liquidity Sweep Before Any Real RallyBitcoin on the H4 timeframe continues to hover inside a tight equilibrium band around 91,500–93,500, with price repeatedly tapping both edges of the range without showing directional commitment. The current movement suggests liquidity hunting rather than trend development, as every push toward 92,000 quickly gets absorbed.
Macro conditions still lean supportive thanks to the low-rate outlook, yet capital flows are favoring metals over crypto, leaving BTC with a muted recovery after the prior drop. Buyers remain cautious while sellers lose momentum, causing price to float above two demand/FVG layers at 89,500–90,500 and 86,500–88,000.
The scenario with the highest probability is a final liquidity flush. BTC may continue consolidating around 92,000–93,000 before sliding to 90,000 and dipping into the deeper FVG at 88,000–86,500. A clean reaction there would open room for the next impulsive leg upward.

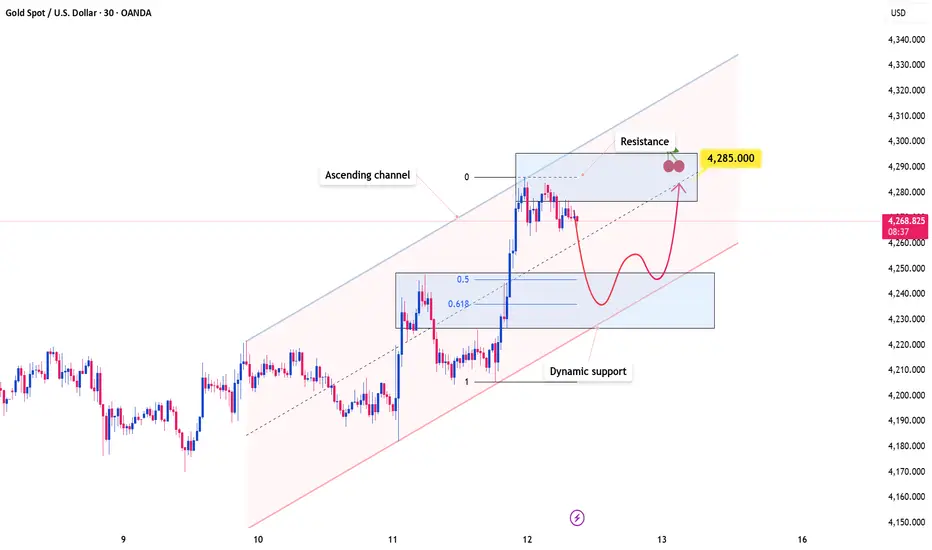
Gold Holds a High Ground While the Market Reprices RiskOANDA:XAUUSD continues to trade within a well-defined ascending channel, with price action consistently respecting both the upper and lower boundaries. This structure highlights strong bullish control, suggesting that buyers remain firmly in charge and that upside continuation is still favored.
Price has recently broken above a key resistance zone and may return to retest this level. If it holds as support, it would further validate the bullish structure and significantly increase the probability of a move toward the 4,285 target. This level aligns closely with the midline of the ascending channel as well as a previous resistance area, reinforcing its technical importance.
As long as price remains above this support zone, the bullish outlook stays intact. However, a failure to hold this level could weaken the current structure and open the door for a deeper pullback toward the lower boundary of the channel.
On the fundamental side, gold’s recent surge has been driven by an unexpected shift from the U.S. Federal Reserve toward monetary easing, including a return to bond purchases. This move pressured the U.S. dollar and effectively removed prior concerns over a prolonged hawkish policy stance, prompting renewed inflows into gold.
While short-term pullbacks remain possible due to overbought conditions, the broader trend continues to look constructive, supported by ongoing central bank buying and sustained demand for safe-haven assets.
TradeCityPro | Bitcoin Daily Analysis #246👋 Welcome to TradeCity Pro!
Let’s move on to Bitcoin analysis. The market has been ranging for a few days, but it still gives positions, and if we stay behind the chart, we can make profits from the market.
⏳ 1-hour timeframe
On the 1-hour timeframe, Bitcoin has formed a range box between the 88890 and 94167 zones, and for several days it has been moving between these two areas.
✔️ Currently, near the bottom of the box, the price has created a smaller range between 89849 and 90590, and since today is Saturday and volume is low, it is ranging between these two zones.
💥 If the price exits this box, the next move can continue toward either the top or the bottom of the main box.
🔔 That means with a break of 89849, the move can continue down toward 88890.
🎲 But if 90590 breaks, I will wait for a higher low and higher high to form above this zone, and then I will enter a long position.
⛏ The next resistance zones for Bitcoin are 92942 and 94167.
🧩 We get confirmation of Bitcoin turning bullish with a break of 94167. In that case, an upward move in higher cycles can begin.
⭐ On the other hand, if the price stabilizes below 88890, it can move again toward the 84000 support.
❌ Disclaimer ❌
Trading futures is highly risky and dangerous. If you're not an expert, these triggers may not be suitable for you. You should first learn risk and capital management. You can also use the educational content from this channel.
Finally, these triggers reflect my personal opinions on price action, and the market may move completely against this analysis. So, do your own research before opening any position.

Why Bitcoin Hits Your Stop Loss Before the Real MoveWhy Bitcoin Hits Your Stop Loss Before the Real Move
Have you ever placed a Bitcoin trade and noticed this? 🤔
Your stop loss 😭💸 gets hit… just a few pips from your entry… then the price suddenly rockets 🚀💎 in the direction you were expecting!
This is not bad luck. It’s a Stop Loss Hunt 💥, used by smart money 🏦💰 to collect liquidity before the real trend begins.
1️⃣ Liquidity Pools Above Highs & Below Lows 📊💎
Retail traders place stop losses at obvious highs/lows 📈📉
These stops create liquidity zones 💧, which smart money targets 🔍
Price moves to these zones to collect liquidity → fuels the next trend 🚀
Example:
BTC trending upward 📈
Traders place buy stops above the previous high ⬆️
Smart money pushes price to trigger stops 💥 → collects liquidity 💎 → then moves the price in the real trend direction 🚀
2️⃣ Stop Loss Sweep 💥⚡
Price triggers retail stop losses 🛑
Retail traders get stopped out 😭💸
Institutions enter large positions with minimal resistance 💹
Key Insight:
Price needs liquidity 💧 to move strongly.
Without collecting stops, smart money cannot drive momentum efficiently ⚡
3️⃣ Fake Breakouts & Wicks 🌪️🔥
Watch for wick spikes or sudden breakouts 🕵️♂️
These are stop loss hunts
Many traders panic 😱 and exit positions
Smart money uses this to trap retail traders and continue the trend 🚀
4️⃣ The Real Move Begins 🚀🔥
After liquidity is collected 💎💧
The true trend resumes 📈
Traders who waited can enter safely 🧘♂️💹
Often, the move is stronger and faster ⚡ because institutions now control the market
5️⃣ Market Psychology Behind Stop Hunts 🧠💭
Retail traders panic when stops are triggered 😅💸
Fear is used to manipulate sentiment 🧲
Recognizing this psychological trap helps you stay calm 🧘♂️ and trade strategically 🏆
6️⃣ How to Trade Stop Loss Hunts 💡🧠
✅ Avoid stops at obvious highs/lows 🚫
✅ Wait for liquidity sweep ⏳💧
✅ Watch for wick spikes 🌟 — early signs of stop hunts
✅ Follow market structure 📊 (BOS/CHoCH)
✅ Trade after confirmation ⏱️
✅ Patience + discipline = profits 💎💹
7️⃣ Examples in Bitcoin Trading 🔍
Double top wicks above high → triggers stops 💥 → continues trend 🚀
Price dips below support → triggers stops 😭 → rebounds ⬆️
💡 Observation: Every wick tells a story 🌟 — learn to read it!
💬 Key Takeaways
Stop Loss Hunts = institutional footprints 👣
Price hunts liquidity 💧 — that’s why your SL is hit 💥
Understanding this helps you:
Trade smarter 💎
Avoid losses 😅💸
Spot trends before they happen 🚀

EURUSD: Sellers Drive Pullback - 1.1670 Support in FocusHello everyone, here is my breakdown of the current EURUSD setup.
Market Analysis
EURUSD remains in a broader bearish structure, and the recent price action is unfolding within a clear downward context. After moving through a prolonged range phase, the pair broke lower and continued to respect the descending trend line, confirming sustained selling pressure. Price later formed a Triangle Support Line, where buyers attempted to reverse the trend, leading to a breakout above the trend line and a retest of the Support Zone around 1.1670. However, after this retest, EURUSD quickly reached the major 1.1760 Resistance, which has repeatedly acted as a strong reaction zone. From this level, a sharp rejection occurred, showing that sellers are still firmly active and protecting this resistance area.
Currently, the market is pulling back from the Resistance Zone and heading back toward the Support Zone, where the ascending structure meets previous breakout levels.
My Scenario & Strategy
My scenario is bearish as long as EURUSD remains below the 1.1760 Resistance and continues to move away from this rejection zone. I expect the price to pull back toward the 1.1670 Support, where the next reaction will determine short-term direction.
Therefore, a clean breakdown below the 1.1670 Support Zone would confirm further bearish continuation and open the path toward lower levels. However, if the pair tests the support and shows a strong bounce, a short-term recovery toward the trend line may occur — but the bearish outlook remains valid while price stays under the 1.1760 Resistance. For now, the market favors sellers, with the key objective being a move back into the Support Zone around 1.1670.
That's the setup I'm tracking. Thank you for your attention, and always manage your risk.

NZDCHF Potential Long Setup #3 (High Probability Reaction)MAIN TIME FRAME: 20H (Directional Bias)
Bullish Bias Confirmed
1.) Long-term trendline break
2.) SuperTrend flipped to green
3.) EMA 14 crossed above EMA 50 after prolonged consolidation
4.) Ichimoku Cloud breakout after extended ranging
5.) Back-to-back Wide Divergences confirmed after resistance break (rare setup)
6.) Fresh bullish structure forming
TRADE SETUP
1.) Support Zone
--> 2 clean rejections
--> Recently formed and aligned with prior structure
--> Previous support/resistance flip
--> Very clear and easy to identify
--> Wide Divergence neckline
--> Right shoulder of an Inverse Head & Shoulders pattern
2.) Candlestick Confirmation
--> Inside bar (short-covering & consolidation)
--> Spinning bottom (indecision at support)
--> Bullish engulfing candle (buyer dominance)
3.) SuperTrend aligned with bullish bias
ENTRY TIME FRAME: 1H
Break of trendline and resistance confirms Wide Divergence on RSI, MACD, and Stochastic, aligned with the bullish 20H bias.
Stop Loss (20H Based)
Below:
- support zone
- Wick rejections
- SuperTrend line
- EMA 50
- Fibonacci 38.2%
(Multi-layer protection)
TAKE PROFIT TARGETS (20H Based)
TP1
- Recent swing high
- Slanted neckline
TP2
- Fibonacci extension 50%–61.8%
TP3
- Fibonacci extension 100%
If you enjoy clean, rule-based, and objective trading ideas, consider following for more high-probability setups.
Your thoughts are welcome in the comments.
Disclaimer:
This analysis is for educational and informational purposes only and does not constitute financial advice. Trading involves risk. Always conduct your own analysis. I am not responsible for any losses resulting from the use of this idea.
