The vertical rise of Gold.In the mid-seventies Gold made a top and a bottom, from which we measure using a fibonacci extension tool.
Of special interest are the 2.272, 3.272 and 4.272 levels. Those give us a glimpse into the possible future, at which levels Gold might top out.
Since 2022 major Central Banks have been going on a Gold shopping spree, the once described barabrous relic seems to be a very coveted commodity, and it makes sense.
When everything becomes digital, virtual and ephemere, hard assets save the day.
Do you see 15K happening ?
Parabola

$BTC Following $GOLD - Parabola Incoming !P.S. CRYPTOCAP:BTC still on track to follow the TVC:GOLD parabola with this 10-12 week fractal which we should see between Thanksgiving and Christmas 🦃🎅
Will be following GOLD a bit more closely as Total Global Liquidity gave its first real fake-out showing ATH at EOM.

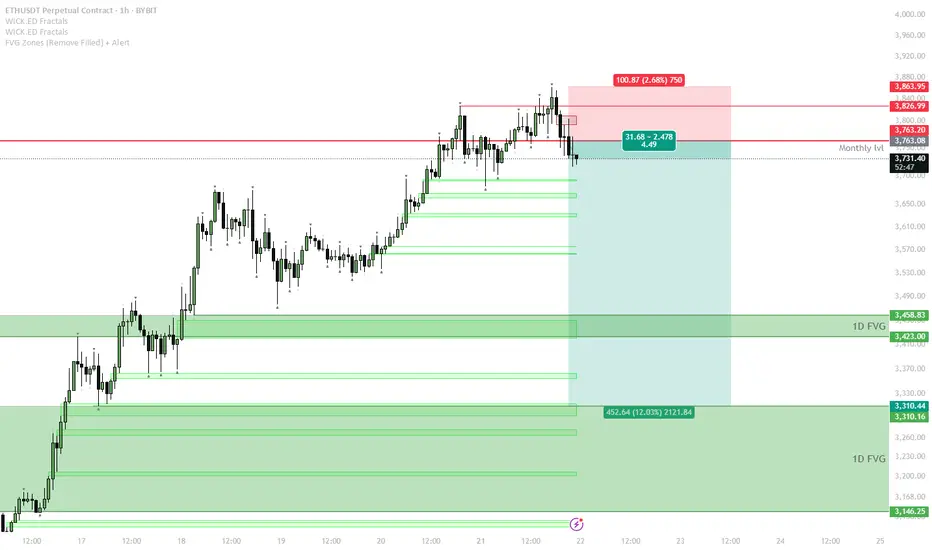
ETH Short Setup — Waiting for Range Formation After Parabolic Mo
The parabolic uptrend has broken, and ETH is testing the previous monthly resistance at $3,763.
If price fails to reclaim the monthly level and continues to range below it, expect a sideways range to form between $3,760–$3,850 (red box) and local support zones.
The short trigger is a sweep of the range high (top of the red box) followed by rejection or failure to hold above $3,850.
If price confirms a failed sweep, a short position can target the 1D FVG zone around $3,460, with the next possible target at $3,310.
Invalidation: A strong reclaim and acceptance above $3,850 invalidates the short idea — switch to neutral or bullish bias in that case.
The setup follows a classic pattern after a parabolic run: momentum stalls, a range forms, and liquidity is swept at the range top before a correction. Sellers are likely to step in if price fails to establish new highs above the red zone. Downside targets align with major FVGs and previous breakout areas, providing logical levels for profit-taking.
$BTC Extremely Bullish Daily Close - Parabola Underway?Hawt diggity dayumm 🥵
CRYPTOCAP:BTC really going for it following my original idea behind the parabola formation 🤯
Reclaiming ATH high at $112k will confirm the move 🤞

$BTC Historic Daily Close Above ATH - Pullback Warning*HISTORIC Daily Close for ₿itcoin marking a new ATH 🥇
Some hefty volume poured in as the Golden Cross nears.
If CRYPTOCAP:BTC breaks down from this impulsive trend we should see a pullback to the .786 Fib ~$102k to confirm this new ATH.
Bulls need the Weekly Close above $109k to prevent that.
Nonetheless, this confirms the start of the parabola I’ve mentioned over the past month in my analysis 💯
Next big target is the 1.618 Fib ~$130k 🤑
Congrats Hodlers 🥳

$BTC Trump Pump $100k Target HitTRUMP PUMP IS BACK 🔥
$100k target hit ✅
Another massive rip for CRYPTOCAP:BTC closing within the golden zone 🏆
Need some consistent PA in here or a rip and close above the .786 fib.
200DMA (now sitting at $90,861) is still my base case as mentioned in my original analysis several weeks ago.
IF this is the start of the PARABOLA, and you have some dry powder, a retest of ATH ~109k and then correction to .786 ~$101k would be your entry, with a SL just below the .618 ~$93k
Exciting to watch either way it goes!
This is why you always prepare for both scenarios 🤓

$BTC Huge Daily Close Above the .618 Fib !Very BIG Daily Close for ₿itcoin above the .618 Fib 🥵
CRYPTOCAP:BTC needs to close the next week in or above the green box demand area in order to keep the rally alive and flip resistance into support.
As I originally mentioned in my idea, PA either needs to correct accordingly or this is the long-awaited PARABOLA in the making.
I still stand with my original belief on how this will play out, and have numbered my ideas accordingly.
1. Correct to 200DMA
2. Correct to 50DMA
3. Inverse Head and Shoulders reversal pattern
4. PARABOLA 🚀
I hope it's time to MOON more than anyone!
but I still have a good chunk of cash on the sideline in case the market needs more time 🤓

BTC's Rhythm, it likes 3...3 is a powerful concept in our existence. Body/Mind/Spirit. Positive/Negative/Neutral. Father/Son/Holy Ghost. You get the idea. BTC is no different.
In this chart, 0 (at the bottom, fib time) is anchored to Halvings. The period between Halvings gives us 0.33 and 0.66; one third and two thirds of the cycle respectively. In splitting the chart time up this way, a clear pattern emerges (for the past Decade or so).
From Halving to 0.33, BTC tends to Rally hard (Parabola Phase).
From 0.33 to 0.66, BTC tends to Correct.
From 0.66 to 0 (next Halving), BTC Tends to put in a Bottom/Base.
While past performance does NOT indicate future results, history does tend to rhyme. Will this time be different? Will institutional adoption alter this cycle? Will the maturing of BTC as a Global Asset change the cadence of its growth? Only time will tell.
So far this Halving is holding true to past rhymes. If, and that's a BIG IF, it continues to follow this chart... our current Parabola should endure thru ~~ Aug '25; At which point a heavy correction is quite likely.
If we see structure breaking to the downside (on the weekly timeframe), then perhaps this time IS different; as that has not occurred in previous "Parabola" Phases. This gives us a clear invalidation of this theory.
As always, good luck, have fun, and practice solid risk management.

I think is time to start talking about PARABOLASOnce BTC goes above previous ATH is a good time to start analyzing parabolas. If you look closely once it breaks previous ATH the movent continues ascending in a parabolic move and then braking the pattern to culminate in a lateral correction or bear markets. Lets see this time

Bitcoin Macro Parabolic Continuation?If continuation, the steepness of the parabola implies a large move...$85k at a minimum. If the parabola breaks, distribution targets (~50% correction) are on the table.

3 Touches and your done #BITCOIN is on Parabola watch.#Crypto creates many parabolic moves
as they are reflexive assets fuelled by Fear and Greed.
I am currently on alert that we may have a parabolic rise on our hands.
And we could #BTC double to reach very close to that $100K level
BEFORE summertime.
Our #Alts could go beserk
but we must have some sort of selling plan in place.
You need to come up with your own plan!

Doge to go parabolic at any moments notice.. I feel that moment is now.. Doge on 30m timeframe is making the same patterns ETH did when ETH was around 200 dollars..
#NFA It's just a vibe I have.. Wish you all luck!
First target is 10 cents, then 13 dollars.

Follow the yellow brick road; a guide to inflation based on SPXThis chart shows 1) a potentially opposing perspective to the linked Dow Jones great depression 2.0 idea and 2) that whilst inflation took a lifetime to cause -90% damage for the boomers it now takes only about a generation for the zoomers to suffer the same damage a century later

Parabolic SymmetryBLX 3M. ^10 charts only over here.
A bottom here near $6.8K fits beautifully.
Bullish fibonacci levels.
We could very well be living through the most important time in bitcoin history.
1:1 is pretty high up there. Whoa.
Could be.
.. Just an idea.r

LINKBTC - close to the bottomLINKBTC is near the tip of a falling wedge which have a bullish bias and it's very close to the daily 200 SMA.
We can see bullish divergence on almost all timeframes and the 23500 - 25000 range is a zone of major support.
The parabola for LINK/BTC is still intact and it's very close to it.
This all points to a reversal in the near future and looks like a great zone to accumulate for long-term positions.
Let me know what you think and best of luck with your trades!

Bitcoin (BTC) In The Trough Zone Can we Hold $40,000?We've been through this rodeo with Bitcoin many times. On a downtrend for the past 2 months and a nice 42% dump from new all time highs set November 11th. Oversold on the daily timeframes on the Stochastic RSI, RSI, and MACD showing signs of confluence. We could bet getting close to bottom soon and another parabola on Bitcoin has formed. We're still in a downtrend though and need to hold above $40,000. If we can't hold $40,000 then $37,000 is next the next destination.

Plotting the Future for the Altcoin MarketA continuation pattern of parabolas can be drawn
Leading to continual diminishing volatility
The first run was obvious the most bullish
The second (current) parabola will soon collapse into the next one, which I believe will reach an angle of 17° at peak
This is different to my other altcoin market analyses, it does seem more logical than the other, more bullish perspectives I have been throwing out..
For example below

What Happens at the Top of a Parabolic MoveA comparison between Bank of America and BTC
Both experience similar price action (BTC is log, BAC is normal chart)
Yet you can see on both the action at the top of the bull move
A peak is attained and then quickly rejected from

The Bear-inatorThe Bear-inator or Bear market curve is a new theory i've been building upon while waiting for BTC to moon ! The general basis of this curve is the identification of similarities in each bull run and the potential indication that it points too .
I spent a while educating myself on the previous runs and noticed big wicked gaps creating a gapped like approach to each run. I had also noticed that most runs ended with a retest of resistance before plummeting to a low. I now identified similarities between runs however i had no way of linking these two ideas until ...
I discovered that pulling a curve from the 'pre-run gap' gave an indication to the current conditions to the market while also giving an indication as to where the marjor resistance may lie in the future. While this theory is yet to be tested in the future , it has been backtested on all previous runs ( par the black swan event ) and the same gap like features gives similar results.
Now while this is a good indicator in hindsight , we have started to follow the same pattern of gapping and ive noticed a few more similarities between this run and a previous run ! The 2018 run and the 2017 run both start with a wider distance from the curve and both result in a parabolic like leg. This gives me hope to a very bullish future while also potentially highlighting areas to watch for the future .
I will continue to monitor this idea and update it monthly while i continue to expand my knowledge - Oliver :D

QDEL - Classic ABC Zigzag TRADE TYPE: Simple trade using the concept of parabolic corrections and zigzags. TIMELINE: 1-10 days. Look for double bottom at the end of zigzag to confirm end of correction and reversal to the long side.

Bitcoin parabolic curve formationI am watching for something like this in next 4 months. I think now we are at stage 1 and we will consolidate a little bit here before next move to the upside. Probably this stage 1 bottom could be around $43k in my opinion and next move could be around end of september or begining of octomber.

Parabolic movements usually end up where they started."The four most dangerous words in investing are; This time it's different" - Sir John Templeton

Ethereum bearish parabolic curveLong term I am bullish on crypto but it looks like we have a bearish parabola. From here I think that we have two options. We will either dump more until we find support. I think one of the first spots is the long term trend line which is around $1800. But if we break out of this parabola, parabolas usually retrace 50% or even up to 78%. So the fib levels are the targets. From there we would probably consolidate until we decide which direction we would want to move.
