DOGEUSDT - Consolidation after growth is a positive signBINANCE:DOGEUSDT is testing resistance, but the coin is not going to reverse yet. Focus on the current consolidation at 0.145 - 0.1534. A long squeeze or a breakout of resistance could trigger growth.
Bitcoin has been growing throughout the week, forming a retest of resistance. If the growth continues, it could support a bullish run in altcoins.
After the rally, DOGE moved into consolidation at 0.145 - 0.1533. The market is showing positive dynamics. The altcoin may test the consolidation support before growing. However, a breakout of the 0.1533 resistance and a close above the level could trigger an early rise.
Resistance levels: 0.1534, 0.1648
Support levels: 0.145, 0.139
Regarding the current consolidation in the trading range format, I highlight two levels: 0.1534 and 0.145. If the overall positive background persists, a false breakdown of support at 0.145 or a breakout of resistance at 0.1534 with the price closing above the level could trigger further growth towards the local zone of interest at 0.165.
Best regards, R. Linda!
Parallel Channel

EURUSD Breakdown Confirmed, 1.1640 Support in FocusHello traders! Here’s my technical outlook on EURUSD (2H) based on the current chart structure. EURUSD initially traded within a well-defined ascending channel, showing a strong bullish structure with higher highs and higher lows after the market started to grow from the lower levels. This bullish phase reflected steady buyer control, supported by a rising support line and multiple clean reactions along the channel structure. Eventually, price broke above the channel resistance, signaling momentum expansion. Following the breakout, EURUSD entered a clear range, where price consolidated between key highs and lows, indicating temporary balance between buyers and sellers. Multiple internal reactions and false moves within this range highlighted uncertainty and distribution near the highs. After topping out, price turned around and transitioned into a short-term descending channel, marking a shift in momentum. During this pullback, EURUSD broke below the range support and the descending channel support, confirming increasing bearish pressure. Price is now trading below the Resistance Level near 1.1720, which aligns with the former breakout area and the Seller Zone, reinforcing it as a strong supply region. The recent breakout below this level suggests sellers are gaining control in the short term. Currently, price is reacting around the Buyer Zone near the Support Level around 1.1670. This area aligns with prior demand and has already produced a small bounce, indicating potential short-term reaction. However, the overall structure remains corrective within the broader move. My scenario: as long as EURUSD remains below the 1.1720 Resistance Level, bearish pressure is likely to persist, with TP1 targeting the 1.1640 Support Level. A clear breakdown below support would open the door for further downside continuation. Conversely, a strong reclaim and acceptance back above resistance would invalidate the bearish bias and signal a potential trend shift. For now, price is at a key decision zone where sellers hold the advantage while support is being tested. Please share this idea with your friends and click Boost 🚀

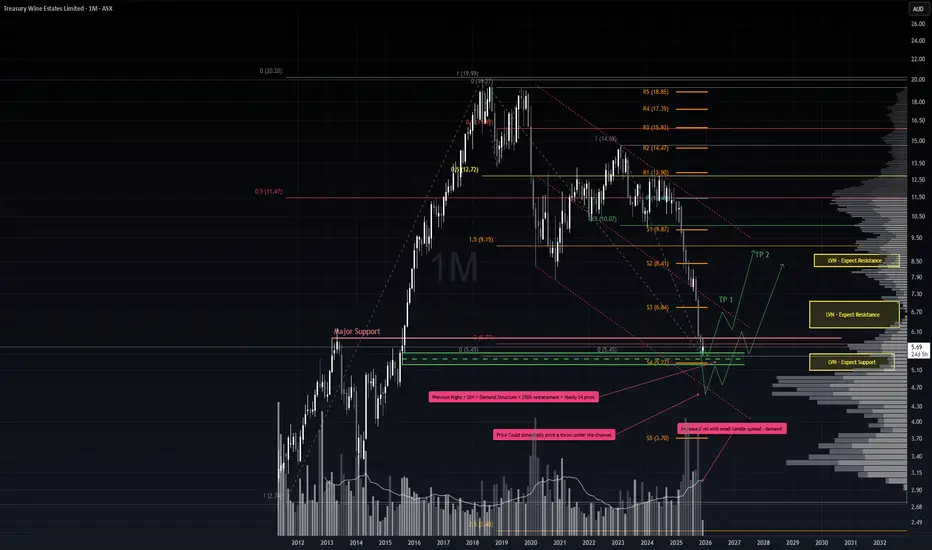
Relief Rally Incoming?It’s been a punishing stretch for TWE holders, but price action has now pulled back into a critical zone where a relief rally could emerge. The broader trend remains bearish, so any positioning here must respect that context.
Key Support Factors
1. 200% retracement from the 2018 double top.
2. Low Volume Node (LVN) zone, indicating limited price acceptance and potential for sharp moves.
3. Demand structure anchored by the August 2015 candle.
4. Historical tops acting as structural support.
5. November monthly candle showed notable demand — high volume on a narrow spread.
6. 11 consecutive weeks down in a single swing, aligning with Gann’s 7–10 bar exhaustion principle.
7. Proximity to the yearly S4 pivot, reinforcing the demand zone.
Trade Scenario 1 – Aggressive Entry
Setup: Despite no confirmed trend reversal, risk-tolerant traders could begin scaling in here, supported by the confluence of demand factors.
Stop Loss: 5.22 — just beneath the demand structure and S4 pivot.
Take Profit: Initial target at the midline (EQ) of the downward channel. If price breaks cleanly above, extend targets toward the upper bounds of the channel.
Trade Scenario 2 – Throw-Under Reversal
Setup: If the S4 pivot and demand structure fail, watch for a throw-under pattern whereby price dips below support but quickly reclaims the range.
Confirmation: A bullish hammer or doji on surging volume, ideally accompanied by negative sentiment, would strengthen the reversal case.
Take Profit: Similar roadmap to Scenario 1 — first target at the channel EQ, then potentially the upper boundary if momentum builds.
Summary
This is a high-risk, counter-trend play. The confluence of structural supports, exhaustion signals, and pivot proximity offers a tactical window for relief. However, discipline around stops and scaling is essential, as the long-term bear market backdrop remains intact.
* Note, price pathing is not time based, just the overall price movement
BTCUSDT Long: Uptrend Continues Toward 94,500 ResistanceHello traders! Here’s a clear technical breakdown of BTCUSDT (4H) based on the current chart structure. BTCUSDT initially traded within a well-defined descending channel, reflecting sustained bearish pressure during that phase. This move ended with a clear pivot point, followed by a strong breakout from the descending channel, signaling a shift in market control from sellers to buyers. After this breakout, price transitioned into a broad range, where BTC consolidated for an extended period, showing balance between supply and demand with multiple internal reactions.
Currently, BTC is approaching a key Supply Zone around the 94,500 level, where previous selling pressure is expected to re-emerge. This area aligns with the upper boundary of the ascending channel, increasing the likelihood of a reaction. Below current price, the Demand Zone near 86,800 remains a critical support level, marking the prior breakout area and the base of the bullish structure.
My scenario: as long as BTCUSDT holds above the Demand Zone and stays within the ascending channel, the bullish bias remains intact. I expect price to test the 94,500 Supply Zone, where a reaction or short-term pullback may occur. A clean breakout and acceptance above supply would signal further upside continuation. However, a strong rejection from supply followed by a breakdown below channel support would suggest a deeper corrective move. For now, structure favors buyers while price remains within the ascending channel. Manage your risk!

BTCUSDT: Sellers Defend 91,800 as Bullish Momentum WeakensHello everyone, here is my breakdown of the current BTCUSDT setup.
Market Analysis
BTCUSDT spent a significant period trading inside a well-defined range, where price oscillated between clear support and resistance levels, showing indecision and balanced participation from both buyers and sellers. Multiple breakout attempts from this range failed, confirming the strength of the boundaries and the lack of sustained momentum during that phase. Eventually, price broke out of the range to the upside and transitioned into a clean ascending channel, signaling a short-term bullish shift. This move was supported by higher highs and higher lows, reflecting increasing buyer control. However, as price approached the major Resistance Zone around 91,800, bullish momentum started to fade. The market printed reactions and hesitation near this resistance, indicating strong selling interest at higher levels.
Currently, the upper boundary of the ascending channel is being tested, and price is currently struggling to hold above the 90,000 Support Zone, which previously acted as a key breakout and demand area. The recent price action suggests that the upside move is losing strength and may be corrective rather than impulsive.
My Scenario & Strategy
My primary scenario: as long as BTCUSDT remains below the 91,800 Resistance Zone and fails to reclaim the upper part of the ascending channel, the bias favors a short-term bearish correction. A rejection from resistance increases the probability of a pullback toward the 90,000 Support Zone, which is the first key downside target. If this support fails to hold, further downside continuation toward lower range levels becomes possible.
However, a strong bullish breakout and acceptance above 91,800 would invalidate the short bias and open the door for renewed upside continuation within or above the channel. For now, price is at a critical decision area, with sellers defending resistance and buyers attempting to hold structure. Caution and proper risk management are essential in this zone.
That's the setup I'm tracking. Thank you for your attention, and always manage your risk.

Dxy long trade setup?This count is based on my assumptions so anything can happen not a trading or financial advice just for educational purposes only kindly do your own ta thanks trade with care good luck.

GBPJPY: Classic Bullish Pattern 🇬🇧🇯🇵
GBPJPY violated a horizontal resistance of a narrow
accumulation range on a daily time frame.
It provides a strong bullish signal.
Expect a rise to 212.5 level.
❤️Please, support my work with like, thank you!❤️
I am part of Trade Nation's Influencer program and receive a monthly fee for using their TradingView charts in my analysis.

GOLD - The battle for 4400. Will the growth continue?FX:XAUUSD starts the week of 2026 with a rise of more than 1.5%, staying above $4,400 amid escalating geopolitical tensions in Latin America
Geopolitical crisis: US-Venezuela, Donald Trump threatened new military intervention if the interim government does not comply with Washington's demands.
Expanding risks: Trump hinted at Colombia and Mexico. The situation between Russia and Ukraine remains tense. Against this backdrop, investors are actively shifting funds into defensive instruments, including gold and the US dollar
Important US labor market data is expected this week, which could add to volatility. Venezuela has set up a commission to free Maduro, indicating a further escalation of the conflict.
Gold remains a priority for investors amid unprecedented geopolitical uncertainty. Short-term corrections are possible, but the overall uptrend is likely to continue, especially if the conflict in Latin America escalates
Resistance levels: 4440, 4470, 4519
Support levels: 4400, 4373
If the bulls keep gold above 4410-4400, then in the short and medium term, gold will be able to continue to grow despite the fact that the daily ATR has already been exhausted. Local and global trends are bullish...
Best regards, R. Linda!

EURJPY - Correction (hunting for liquidity) before growthFX:EURJPY is entering a correction amid an uptrend that has been ongoing since March last year. Zone of interest: 183.0
Amid the growth of the dollar, the euro is entering a correction, but the main trend of the index is bearish.
The key area of interest and liquidity for the currency pair is 183.43 - 183.15. A false breakout/long squeeze and holding the price above this level could trigger further growth. Locally, we have a correction against the backdrop of a global bullish trend
Resistance levels: 184.26, 184.82
Support levels: 183.43, 183.15
A pullback on a bullish trend is an additional opportunity to enter the market at a favorable price. Focus on support at 183.43 - 183.15 (additionally 183.0)
Best regards, R. Linda!

ETHEREUM - Consolidation near 3150 ahead of rallyBINANCE:ETHUSDT.P is rising after breaking through trend resistance and consolidating. The main trend remains bearish, but there are local indications of bullish support. The 3150 trigger is ahead.
Bitcoin is strengthening amid geopolitical nuances, acting as a hedging factor (locally). A rise in the leading cryptocurrency could support Ethereum, which, in turn, could trigger a breakout of 3150 and a subsequent rally.
Ethereum is consolidating near 3150, forming resistance (a trigger). Technically, consolidation continues, and the coin may test local lows at 3120-3100 before retesting 3150 and continuing the rally.
Resistance levels: 3150, 3200, 3270
Support levels: 3120, 3100, 3077
If the pullback is not deep and the price quickly returns to retest 3150, then we can continue to monitor the coin, waiting for a signal to long...
If the bulls hold the price above resistance after breaking through 3150, this move could trigger continued growth toward 3200-3270.
Sincerely, R. Linda!

Natural Gas At Crucial Levelwww.tradingview.com
Natural Gas recent Daily Move is at crucial Juncture and at Interesting confluence
1. Break out of Bigger Parallel channel
2. Retest of the channel and raise
3. Break of Smaller Parallel Channel
4. Todays Daily candle retesting 0.9 of Fib.
Entry - 3.959
Targets - 4.656, 5.618,
Long term Targets -- 6.634 ( Minimize to see the confluence of Fibonacci's.
Stop Loss -- 3.685
Long Term View
www.tradingview.com

EURCAD higher bearish expectations
OANDA:EURCAD last what we are see is be break of DESCENDING TRIANGL, currently price on trend line, expecting here break of same.
SUP zone: 1.62800
RES zone: 1.60500, 1.60000

EURUSD: Fake Breakout at Resistance Signals Move Toward 1.1680Hello everyone, here is my breakdown of the current EURUSD setup.
Market Analysis
EURUSD previously traded inside a clear downward channel, reflecting sustained bearish pressure during that phase. After forming a base, price broke out of the descending channel and transitioned into a strong upward channel, confirming a shift in market control toward buyers. This bullish leg was supported by a sequence of higher highs and higher lows, showing healthy upside momentum. As price approached the key Resistance Zone around 1.1770–1.1780, bullish momentum started to weaken. Multiple attempts to break above this resistance resulted in fake breakouts, signaling strong seller interest at the highs.
Currently, following these rejections, EURUSD failed to hold above the upper boundary of the ascending channel and broke below short-term support, indicating a loss of bullish structure. Price is now compressing below resistance and forming a structure that resembles a triangle breakdown, suggesting increasing downside pressure. Below current price, a well-defined Support Zone around 1.1680 stands out as the next key area where buyers may attempt to defend and slow the decline.
My Scenario & Strategy
My primary scenario: as long as EURUSD remains below the 1.1770 Resistance Zone and continues to respect the broken channel / triangle resistance, the bias favors sellers. Any pullbacks toward resistance that show rejection can be considered short opportunities, with downside continuation toward the 1.1680 Support Zone as the main target.
However, a clean breakout and acceptance back above resistance would invalidate the short scenario and signal a potential return to bullish continuation. Until then, structure and price action favor further downside or corrective movement lower.
That's the setup I'm tracking. Thank you for your attention, and always manage your risk.

BTCUSDT Pullback to Buyer Zone $87,900 Before Next ExpansionHello traders! Here’s my technical outlook on BTCUSDT (3H) based on the current chart structure. Bitcoin is trading within a broader consolidation phase following a strong bearish impulse earlier in the chart. After the sell-off, price found a clear pivot low, from which buyers stepped in and initiated a recovery. This recovery led to a breakout above a key structure level, confirming a shift from bearish pressure into stabilization. Following the breakout, BTC moved into a well-defined range, highlighting balance between buyers and sellers. The lower boundary of this range aligns with the Buyer Zone around 87,300, which has acted as a strong support area with multiple successful defenses. Each dip into this zone has been met with buying interest, confirming it as a key demand area. On the upside, price remains capped by the Seller Zone / Resistance around 89,800–90,700, where selling pressure has repeatedly limited further advances. More recently, BTC has started to form a rising support line, indicating gradually strengthening bullish pressure. Price is currently trading above this support line and holding above the Buyer Zone, suggesting that the latest pullbacks are corrective rather than impulsive. The overall structure shows compression between rising support and horizontal resistance, often a precursor to an expansion move. My scenario: Bitcoin may first attempt a corrective pullback toward the Buyer Zone (TP1) around 87,900, which aligns with a key horizontal support level and the lower boundary of the recent consolidation structure. This area has already shown strong demand in the past, making it a high-probability reaction zone. As long as price approaches this zone without strong impulsive bearish momentum, the move can be viewed as a healthy retracement within the broader consolidation / emerging bullish structure. A clear bullish reaction from the Buyer Zone—such as long lower wicks, bullish engulfing candles, or strong impulsive candles—would signal that buyers are still in control. Please share this idea with your friends and click Boost 🚀

DOW JONES INDEX (US30): Bullish Setup Explained
Dow Jones broke and closed above a resistance line of an
expanding wedge pattern.
An occurrence of a consequent change of character suggests
a highly probable bullish continuation.
The market will most likely reach 48527 soon.
❤️Please, support my work with like, thank you!❤️
I am part of Trade Nation's Influencer program and receive a monthly fee for using their TradingView charts in my analysis.

GOLD - Trading range 4300 - 4400. Interest in hedge assetsLet's consider FX:XAUUSD before the opening of the trading session. The main nuance is how the market will react at the opening after the increase in geopolitical risks due to the actions of the US...
Starting January 5, liquidity will begin to grow in the market after the Christmas and New Year holidays. However, the year is starting with an increase in geopolitical risks due to US actions in Venezuela... The Russian-Ukrainian conflict is still not progressing in negotiations, which also creates additional risks. The Pacific and Asian sessions may be reactive...
The dollar is forming a correction within a downward trend, but it will be necessary to monitor the index's reaction to the US geopolitical actions that took place on Saturday. The growth of the index may put pressure on the metal...
Gold is forming a trading range of 4300-4400. Globally, we have a bullish trend, but locally, gold is forming a correction. BUT! It is necessary to monitor the price reaction relative to 4315-4300 from the opening of the Pacific, Asian, and European sessions....
Resistance levels: 4355, 4400, 4440
Support levels: 4315, 4302, 4275
Accordingly, based on the available technical and fundamental data, we can assume that there may be a bullish run from the 4300 zone. I do not rule out an attempt to retest 4300 - 4275 (long squeeze) before growth...
Best regards, R. Linda!

XAUUSD Short: Rejection from Supply – 4,340 Demand as TargetHello traders! Here’s a clear technical breakdown of XAUUSD (1H) based on the current chart structure. After an extended bullish phase, Gold was trading inside a well-defined ascending channel, confirming strong buyer control and a sequence of higher highs and higher lows. During this phase, price respected the channel structure multiple times, using the lower boundary as dynamic support. Before the impulsive move higher, XAUUSD also formed two visible consolidation ranges, indicating accumulation prior to expansion. A clean breakout from the upper range triggered strong upside momentum and accelerated price toward the upper channel boundary.
Currently, XAUUSD is trading near the Demand Zone around 4,340, which aligns with a rising trend line and a previous reaction area. A recent dip below this level resulted in a fake breakout, followed by a quick recovery back above demand, suggesting buyers are still active in this zone. Price is now reacting upward from demand, but remains capped below the 4,400 supply area, keeping the structure corrective rather than fully bullish.
My scenario: as long as XAUUSD remains below the 4,400 Supply Zone, the bias favors sellers. I expect price to show rejection signals in this area—such as long upper wicks, bearish engulfing candles, or failed breakouts—followed by renewed downside pressure. The first downside target is a move back toward the 4,340 Demand Zone. A clean breakdown and acceptance below this level would confirm bearish continuation and open the door for a deeper move toward lower support levels. Manage your risk!

Ethereum Inside the Decision ChannelShort-Term Technical Analysis (Days to Weeks)
On the daily timeframe, ETH is trading inside a large ascending channel (purple box). After a decline from the channel’s upper boundary, price is now sitting near the mid-channel support and internal dashed trendline, aligned with the moving average (orange). This area represents a critical decision zone.
Bullish Short-Term Scenario:
A sustained move above $3,150–$3,200 and a bullish reclaim of the moving average could trigger a new upward leg toward the upper channel boundary.
Bearish Short-Term Scenario:
Failure to hold above $3,000 and a breakdown of the internal trendline could open the door for a deeper pullback toward the channel low.
Short-Term Target:
$3,800–$4,200
Short-Term Stop-Loss:
Daily close below $2,900
Long-Term Technical Analysis (Months to 1 Year)
From a broader perspective, ETH remains structurally bullish but range-bound. Price action inside the channel suggests controlled accumulation/distribution rather than a strong directional trend.
Bullish Long-Term Scenario:
A confirmed breakout above the ascending channel could launch ETH into a powerful trending phase with new all-time targets.
Bearish Long-Term Scenario:
A breakdown below the channel floor would signal structural weakness and a deeper corrective phase.
Long-Term Target:
$5,200–$5,800
Long-Term Stop-Loss:
Structural break below $2,300
Fundamental Analysis (Brief)
Ethereum remains the backbone of the Web3 ecosystem:
• Growing adoption of DeFi, NFTs, and Layer 2 solutions
• Net supply reduction through fee-burning mechanisms
• Potential institutional inflows via ETH-based ETFs
• Core infrastructure for smart contracts and tokenized economies
Key risks include L1 competition and broader crypto market conditions.
Final Takeaway
ETH is sitting at a major inflection zone:
• Holding mid-channel support favors a move higher
• Breakdown increases downside risk toward channel lows
At this level, waiting for confirmation offers the best risk-to-reward setup.

EURUSD Holding Buyer Zone - Rebound Toward 1.1780 in FocusHello traders! Here’s my technical outlook on EURUSD (2H) based on the current chart structure. EURUSD is trading within a broader bullish structure after a strong upside move from the lower levels. Earlier, price advanced inside an ascending channel, confirming sustained buyer control and a sequence of higher highs and higher lows. Following this impulsive rally, EURUSD broke above a key structure level and transitioned into a consolidation phase near the highs. Currently, price is reacting around the Buyer Zone near 1.1740, which aligns with a key Support Level and a previous breakout area. This zone has already shown multiple reactions, indicating active demand. Above, the market remains capped by a descending Resistance Line and the Seller Zone around 1.1780, where selling pressure previously caused a rejection. The recent move into support appears corrective rather than impulsive, suggesting a pause within the broader bullish trend. My scenario: as long as EURUSD holds above the 1.1740 Buyer Zone, the bullish structure remains intact. A strong reaction from this area could lead to another push toward the 1.1780 Resistance Level (TP1). A confirmed breakout and acceptance above resistance would open the door for further upside continuation. However, a decisive breakdown below the buyer zone would weaken the bullish setup and signal a deeper corrective move toward lower support levels. For now, price remains at a key decision area, with buyers defending structure while consolidation continues. Please share this idea with your friends and click Boost 🚀

ADAUSDT the 0.33 to 0.66 is easy now ADA is currently trading at the $0.33 level following a notable decline. This zone may now represent a potential reversal area, with the next key technical target positioned near $0.66—a 100% appreciation from current levels.
For this bullish scenario to materialize, confirmation through price action and volume is required. A sustained move above near-term resistance with increasing buying volume would signal a reversal in momentum and could mark the beginning of a new upward phase.
DISCLAIMER: ((trade based on your own decision))
<<press like👍 if you enjoy💚

PLATINUM: Breakout and retestPlatinum just Broken out and retested to ascending channel on a weekly TF. It'll continue bullish rally for a long term target above 2900. If it closes below 1850 on a weekly TF, this bullish setup will become invalid.

BITCOIN - Flat holding back the market. Focus on 90K...BINANCE:BTCUSDT.P is forming a local uptrend, based on cascading support generated by the market during low (holiday) liquidity.
Fundamental support for Bitcoin and the cryptocurrency market is still absent, or not felt. Accordingly, it's too early to talk about a bullish reversal, rally, or pump. The daily chart shows a downtrend and consolidation in a flat/symmetrical triangle pattern. The zone of interest (liquidity area) is 89950 - 90600. A false breakout/short squeeze could shift the imbalance toward bears and trigger a reversal and decline within the current trading range, which in turn could trigger a decline in the altcoin market.
Resistance levels: 89950, 90600, 91900
Support levels: 88000, 86800, 85000
A localized upward movement amid a global downtrend, as long as this zone is not broken, can be considered a counter-trend correction. A short squeeze through the liquidity zone could trigger a bluer price move toward lower zones of interest, such as 88K - 85K.
Sincerely, R. Linda!

Be careful with crypto! The channel is already broken. Downward movement is powerful too.
It could be the crypto doom!
