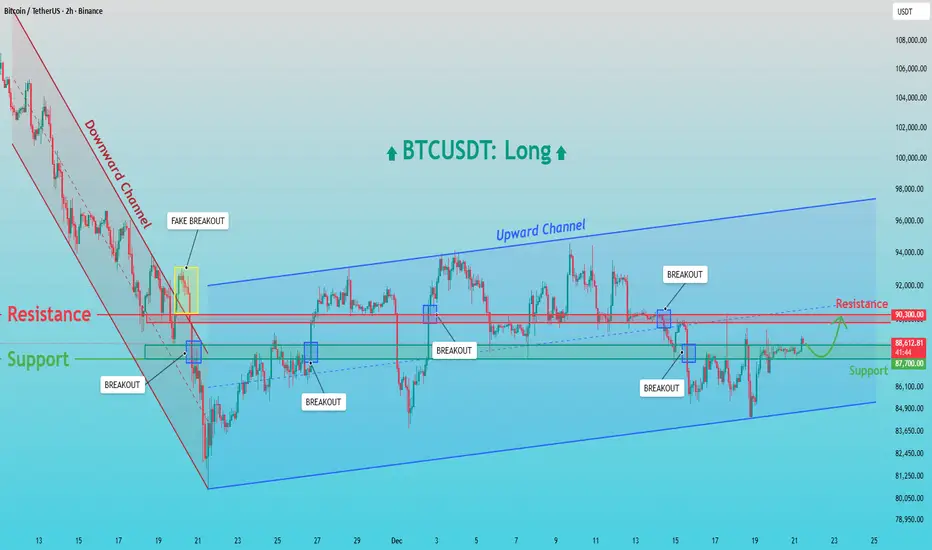
BTCUSDT: Holds Demand - Retest of 90,300 Resistance LikelyHello everyone, here is my breakdown of the current BTCUSDT setup.
Market Analysis
BTCUSDT recently transitioned from a strong downward channel into a broader bullish recovery phase. After a prolonged bearish move, price formed a base near the channel low, where selling pressure weakened. This led to a breakout from the downward channel; however, the first move above resistance resulted in a fake breakout, indicating that sellers were still active at that level. Following this, Bitcoin found strong demand around the 87,000 Support Zone, where buyers stepped in aggressively. From this area, price began to form higher lows and successfully established an ascending (upward) channel, signaling a shift in short-term market structure toward bullish control. Within this upward channel, BTC experienced several clean breakouts above intermediate resistance levels, confirming improving momentum. The key horizontal level around 90,300 acted as a major resistance, where price was rejected multiple times. Despite these rejections, the market did not break down sharply, suggesting absorption of selling pressure rather than distribution.
Currently, BTCUSDT is pulling back toward the 87,000 Support Zone, which aligns with previous resistance turned support and the lower boundary of the upward channel. Price action here remains constructive, with consolidation rather than impulsive selling, indicating that the move lower is corrective.
My Scenario & Strategy
My primary scenario remains bullish as long as BTC holds above the 87,000 support. This zone is a key demand area, and a strong reaction from here could lead to another attempt toward the 90,300 Resistance and a continuation within the upward channel. A confirmed breakout and acceptance above the 90,300 level would open the door for further upside toward higher channel targets.
However, a failure to hold the 87,000 Support Zone would signal weakness and could trigger a deeper correction toward the lower channel boundary. For now, the market structure favors long positions, with support holding and resistance as the next upside objective.
That's the setup I'm tracking. Thank you for your attention, and always manage your risk.
Parallel Channel
Selena | XAUUSD – Thought On Year Closing December last 2 weeksFOREXCOM:XAUUSD
After a sharp rejection from all-time highs, Gold entered a corrective phase that remained controlled and trend-respecting. Buyers defended the lower parallel support multiple times, creating higher lows. The reclaim of previous rejection as support is a key structural shift, signaling that sellers are losing control. Current price behavior shows compression under psychological resistance, typically preceding an expansion.
This is trend continuation logic, not mean reversion.
Key Scenarios
✅ Bullish Continuation Scenario 🚀
Condition: Hold above psychological demand + channel support
🎯 Target 1: 4,380
🎯 Target 2: 4,450
🎯 Target 3: 4,500 (psychological expansion)
❌ Bearish Breakdown Scenario 📉
Condition: 4H close below parallel support
Current Levels to Watch
Resistance 🔴: 4,380 – 4,450 – 4,500
Support 🟢: 4,280 – 4,180 – 3,925
⚠️ Disclaimer: This analysis is for educational and informational purposes only. It is not financial advice.

GOLD - We've updated ATH. What's next? A correction?FX:XAUUSD hit a new all-time high, approaching $4,425, for a bunch of reasons, one of which is increased interest in hedging against geopolitical risks...
Fundamental situation:
The US has increased sanctions pressure on Venezuela. Israel is considering options for attacking Iran's nuclear program. Russia-Ukraine negotiations show no progress. Weak US data (inflation and employment) have reinforced expectations of two Fed rate cuts in 2026.
On Tuesday, US GDP data for the third quarter and durable goods orders are expected, as well as speeches by Fed members, which may adjust short-term dynamics. The combination of geopolitical uncertainty and soft monetary policy continues to support the upward trend.
Resistance levels: 4420
Support levels: 4406, 4400, 4380
Any correction is likely to be limited as long as the current fundamental background remains unchanged. However, when entering the market, it is necessary to take into account the level of risk. Buying in the high zone is high risk. We are waiting for a pullback or correction to the indicated zone before making any decisions.
Best regards, R. Linda!

APTUSDT - Correction and liquidity capture before the fall BINANCE:APTUSDT.P is making a countertrend move towards the zone of interest 1.66 - 1.68. Global and local trends are downward, and bearish pressure may do its job...
Bitcoin is consolidating within a downward trend. A retest of resistance is forming; if bears keep the market under pressure again, the decline of the flagship will also increase pressure on the altcoin market.
APT has been forming a global downward trend for quite some time. After updating the low to 1.400, we are seeing profit-taking and a rally to the zone of interest 1.66 - 1.68. A short squeeze could trigger a resumption of movement within the main trend.
Resistance levels: 1.6623, 1.6873, 1.734
Support levels: 1.553, 1.5035
A retest of the specified resistance zone and the absence of bullish momentum could give us a false breakout, which in turn could trigger a reversal of the local downward movement...
Best regards, R. Linda!

BITCOIN - Manipulation and liquidity hunting before the crash BINANCE:BTCUSDT.P is stuck in the range of 85K - 90K. There is no liquidity in the market, but at the same time, the downward trend continues...
Earlier, we discussed such a nuance as the breakdown of support for the upward local trend. The global trend is bearish, and this nuance generally indicates a weak market. In addition to this, there is no liquidity in the market: there has been no inflow of funds into the cryptocurrency market in the last few weeks, hence the current manipulations that have been taking place over the last few days. (A low-liquidity instrument is easy to control...)
Technically, Bitcoin is within the trading range of 85,000-89,400, which is formed after the breakout of the support of the upward channel, i.e., in the short zone. A retest of 89-90K could lead to a short squeeze and a fall.
Resistance levels: 89,400, 89,900, 90,600
Support levels: 85,000, 83,800
A short squeeze and liquidity capture relative to the specified resistance zone could trigger a further decline, provided that bears keep the market near the previously broken boundary of the upward line...
Sincerely, R. Linda!

IONQ MOVING IN ASCENDING CHANNELAscending channel can be seen clearly. Currently price is at the channel bottom with very good support at 45.
it also made a high at , and pulled back to low of 45
Either buy at CMP 48 and average at 45. I expect it to stay above 45, and hit 55 again, next 65 and 75 would the targets.

Stay in channel or breakdown and fall out of channel?Been in these parallel channels based of the black trend line since q1, q2 of 2013 until now December 2025 where it's still inside, only falling out for a few weeks in q2 of 2013 and the first 3 quarters of 2015. Every time during this span when it hit the bottom of the bottom channel or fell under it was a low and good buying opportunity. Been in it over 10 yrs give or take besides when falling under the trendline and parallel channels. I'm not an experienced TA person or charter, so I don't know if it is more likely to stay in the channels and above the trendline making this a low, or if it's more likely for it to breakdown and fall under the trendline. If it's the latter then that would go with the 4yr bull/bear market pattern and theory that it is continuing right now and bear market started in October and the top is in. Idk if it is more likely than not if that's the case just by looking at the charts, or if the cycle pattern will break or change and extend, and this be a low before going higher to the top of one of the mini parallel channels and have an alt season before a bear market. Or if the whole structure in general is changing. So I'm putting this up to ask y'all more experienced charters to tell me your takes.

OBOY | Long-Term Channel BreakoutPrice has broken out of a long-term parallel channel with volume confirmation.
RSI indicates strong bullish momentum.
Multi-timeframe structure (D/W/M) supports upside continuation.
Potential Zones: 13.70 – 15.80
Pullbacks may offer secondary opportunities.

GBPCAD - Trend Intact, Buyers Watching This Zone!!📈GBPCAD remains overall bullish on the higher timeframe, with price respecting a well-defined rising channel.
📹The key focus right now is the confluence zone where horizontal support aligns with the lower blue trendline. This intersection has already proven its importance in the past, and as long as it continues to hold, the bullish structure remains valid.
🏹From a trend-following perspective, this is the type of location where I’ll be looking for longs, not chasing price higher. The plan is simple: patience at support, confirmation on lower timeframes, and alignment with the broader uptrend.
Only a clean breakdown below this support–trendline intersection would weaken the bullish bias and force a reassessment. Until then, dips into this zone favor buyers.
Will this support fuel the next leg higher, or do sellers finally break the structure? 🤔📊
⚠️ Disclaimer: This is not financial advice. Always do your own research and manage risk properly.
📚 Stick to your trading plan regarding entries, risk, and management.
Good luck! 🍀
All Strategies Are Good; If Managed Properly!
~Richard Nasr

XAUUSD Demand Holding - Resistance Retest in PlayHello traders! Here’s my technical outlook on Gold (XAUUSD, 4H) based on the current chart structure. After a strong bullish impulse from the 3,650–3,700 area, price formed a clear ascending channel, respecting both rising support and resistance. Higher highs and higher lows continue to confirm bullish market control. Previously, Gold reached the Seller Zone around 4,360–4,380, where price entered consolidation and later turned lower. Selling pressure weakened near the 4,270 level, allowing buyers to step back in. Price then broke above 4,270, flipping it from resistance into support and signaling a bullish market structure shift. A corrective pullback followed into the Buyer Zone at 4,260–4,280, aligning with previous resistance turned support and the lower boundary of the ascending channel. Buyers successfully defended this area, keeping the bullish structure intact. Currently, price is consolidating below the Seller Zone (4,360–4,380), showing accumulation rather than strong rejection. My scenario: as long as price holds above the Buyer Zone (4,260–4,280), Gold may continue higher toward the Seller Zone / TP1. A clean breakout above resistance would open the door for further upside, while a failure to hold support could lead to a deeper corrective move. For now, the bias remains bullish. Please share this idea with your friends and click Boost 🚀

Bitcoin Tests Resistance - Downside Risk Toward $85,700Hello traders! Here’s my technical outlook on BTC/USD based on the current chart structure. After a prolonged bearish move inside a clearly defined descending channel, Bitcoin attempted a recovery and managed to break out of the channel. However, this upside move lacked strong follow-through. Price entered a consolidation range, where multiple reactions and fake breakouts signaled distribution rather than accumulation. This behavior suggested that sellers were still active at higher levels. Following the range, BTC formed a triangle structure, capped by a descending Triangle Resistance Line and supported by a rising Triangle Support Line. Price has been compressing within this structure, but recent attempts to push higher were rejected near the 88,500 Resistance Level (TP1), confirming strong selling pressure at this zone. Currently, BTC is trading near the upper boundary of the triangle, where sellers continue to defend resistance. As long as price remains below the Triangle Resistance Line and fails to reclaim 88,500, the bearish scenario remains in play. My scenario: I expect a rejection from the triangle resistance, followed by a move back toward the 85,700 Support Level, which aligns with both horizontal support and the lower triangle boundary. A clean breakdown below 85,700 would confirm bearish continuation and open the door for a deeper decline. Only a strong breakout and hold above 88,500 would invalidate this short setup. For now, the market favors sellers below resistance, with 88,500 as key resistance and 85,700 as the main downside target. Please share this idea with your friends and click Boost 🚀

EURUSD Holds Demand - Retest of 1.1760 Resistance LikelyHello traders! Here’s my technical outlook on EURUSD based on the current chart structure. After a prolonged bearish phase inside a descending channel, EURUSD found a solid base near the lower boundary, where selling pressure weakened and price turned around. This reversal led to a clean breakout above the descending resistance, signaling a shift in market structure from bearish to bullish. Following the breakout, price moved higher but entered a corrective phase, forming a series of pullbacks while maintaining higher lows. As momentum rebuilt, EURUSD broke above the key horizontal level and accelerated into an ascending channel, confirming bullish continuation. Price then pushed into the Seller Zone near 1.1760, where a fake breakout occurred — indicating strong supply but not a full trend reversal. After this rejection, the pair pulled back into the Buyer Zone around 1.1700–1.1720, which aligns with previous resistance turned support and the lower boundary of the ascending structure. Currently, EURUSD is holding above the support level, suggesting that the pullback remains corrective. Buyers continue to defend this zone, keeping the bullish structure intact. My scenario: as long as price holds above the 1.1700 Buyer Zone, EURUSD may bounce and make another attempt toward the 1.1760 Resistance / TP1. A confirmed breakout and acceptance above this level would open the door for further upside continuation. A failure to hold support, however, could lead to a deeper correction within the structure. For now, the bias remains bullish, with support holding and resistance as the main upside target. Please share this idea with your friends and click Boost 🚀

IF Market taps our marked zone we can look for Buys..As you can see market is forming Bullish Flag if its breaks the take profit will as same as the length of flag pole.

What to Expect From Gold on Monday?!
As Christmas Holidays are just around the corner, we see that
many instruments started to slow down and overall volatility dropped
significantly.
Gold remained relatively calm the last week too.
The price formed a narrow horizontal range on an hourly time frame,
respecting that from Tuesday.
I think that we will see a continuation of such a consolidation after the market opening.
Gold will likely stay calm at least till the release of the US Core PCE Price Index
after the NY Session opening.
Expect price movements within the range.
❤️Please, support my work with like, thank you!❤️
I am part of Trade Nation's Influencer program and receive a monthly fee for using their TradingView charts in my analysis.

Nifty 50 Daily Chart — Pole & Flag Breakout in MotionA classic Pole & Flag breakout is unfolding on the Nifty 50, confirming bullish continuation after a sharp impulse leg. The pole represents the strong rally from early December, while the flag is a tight corrective channel marked by lower highs and higher lows — now decisively breached.
🔹 Key Highlights:
Flag breakout aligns with Elliott Wave (5) extension
Volume confirmation supports breakout strength
Fibonacci retracement at 0.618 (₹26,084) acts as a magnet
Targets:
🎯 ₹26,315
🎯 ₹26,485
🎯 ₹26,700
ATH reclaim zone: ₹26,277
🧠 Strategic Insight
This setup signals trend continuation, not reversal. Traders can use pullbacks to the breakout zone (~₹25,900–₹26,000) as re-entry points with tight risk.

BITCOIN, H4 - Bearish while below 90kFrom the beginning of October Bitcoin moves to the south forming the channel. Last few days brought range between 85k and 90k. It seems that breakout from this consolidation will bring some extended move.
Based on recent price action, bears are in favour.
Trade carefully!

SLPUSDT channel breakout ahead and massive pump The current price action of SLP reflects a prolonged bearish trend, with the token consistently establishing new all-time lows—a dynamic that has understandably resulted in a significant portion of holders facing unrealized losses. From a technical perspective, this extended decline may also be viewed as a potential basing or accumulation phase, often preceding a strong reversal.
The key technical development to monitor is a decisive breakout above the prevailing descending trendline . Such a breakout, confirmed by a sustained increase in buying volume, would be the first strong signal of a potential trend reversal .
In this scenario, the initial measured move could project a rally in the vicinity of +300%. Should momentum accelerate further following a successful breakout, the structure of such a basing pattern could support longer-term projections of 5x to 6x gains . However, these more ambitious targets are contingent on a sustained shift in market structure and continued strong buyer participation.
DISCLAIMER: ((trade based on your own decision))
<<press like👍 if you enjoy💚

USOIL/PLATINUM ratio signals BIG commodity bull marketBoth crude and platinum are inflation sensitive assets. Precious metals have been ripping and it is only a matter of time before crude follows. During the last big commodity bull market, both crude and platinum charged upwards, depicted in the ascending parallel on the ratio chart. This capital rotation was triggered by a double bottom in the USOIL/PLATINUM ratio. We are nearing a similar technical scenario with a double bottom imminent. Platinum has already broken out. Will oil be next?

Bullish Airlines Cleared for Altitude!After squinting at the 4H chart like Sherlock with a caffeine addiction, I’ve confirmed: our price broke out of a flag pattern like it was tired of napping. It even did the polite thing—came back to retest—like, “Excuse me, just checking if I actually broke out. Yep. Cool.”
Now it’s back on its bullish treadmill, charging uphill like a gym bro after pre-workout.
As long as we’re above 3200, this beast might just pump harder than Bitcoin on caffeine and hopium.
🎯 Final destination? 161.80% Fib extension at 3580.22—aka “Mount Take Profit.”
Pack snacks. It’s a climb.

BNB About to Crash Hard or Just Faking You Out?Yello Paradisers, is BNB setting up for a major dump, or is this just another trap for impatient traders? This next move could catch a lot of people off guard if they're not paying attention to key levels.
💎BNBUSDT is currently looking bearish, as it's reacting strongly from a key resistance zone. This level is further reinforced by the 200 EMA, making it a significant area of confluence. On top of that, price has recently broken down from an ascending channel, which adds further confirmation to the potential shift in trend direction. When these signals line up like this, the probability of a bearish move increases substantially.
💎Now, ideally, we want to see a pullback into the resistance zone. That would give us a much better risk-to-reward entry for a potential short. However, entering blindly is never the move — we need clear confirmation. Specifically, we’ll be watching for a strong bearish candlestick pattern to form right at the resistance zone. If we get that, we can then expect a move toward the next liquidity zones and support levels below.
💎That said, we must stay objective. If BNB manages to break above the invalidation level and closes a candle beyond that point, it will completely invalidate the current bearish outlook. In that scenario, it's better to stay out and wait patiently for stronger price action to develop. There’s no need to force trades when the setup isn't perfect.
🎖Strive for consistency, not quick profits. Treat the market as a businessman, not as a gambler.
MyCryptoParadise
iFeel the success🌴

USDCAD: Bullish Outlook Explained 🇺🇸🇨🇦
USDCAD broke and closed above a resistance line
of a falling parallel channel on a daily.
It suggests a strong buying pressure and an oversold
state of the market.
I will expect a rise next week at least to 1.385 level.
❤️Please, support my work with like, thank you!❤️
I am part of Trade Nation's Influencer program and receive a monthly fee for using their TradingView charts in my analysis.

S&P 500 index at PRZ — Next Bullish Rally!!!In general, I place significant importance on the S&P 500 index( SP:SPX ), especially over the past month, because of its strong correlation with the crypto market, particularly Bitcoin( BINANCE:BTCUSDT ). When sharp movements occur in the S&P 500 index, we often see a mirrored effect in the crypto market and Bitcoin’s chart.
Currently, the S&P 500 index is moving near the support zone($6,776_$6,712) and the Potential Reversal Zone(PRZ) , and it appears to have successfully broken the upper line of the descending channel, which is a positive sign for a continued bullish trend in the coming days.
From an Elliott Wave perspective, it seems that the S&P 500 has completed a zigzag correction(ABC/5-3-5) within the descending channel, and we can expect an upward wave towards the resistance zone($6,853_$6,823).
I expect that the S&P 500 will begin to rise again from the Potential Reversal Zone(PRZ) and could climb at least up to $6,816. If it breaks resistance zone($6,853_$6,823), we can expect even more gains, which can also positively impact the broader markets.
What’s your outlook on the S&P 500 index and the U.S. stock market?
First Target: $6,816
Second Target: $6,834
Stop Loss(SL): $6,739(Worst)
Note: During U.S. trading hours, market volatility and emotions tend to increase. Please make sure to apply strict risk and capital management.
💡 Please respect each other's opinions and express agreement or disagreement politely.
📌S&P 500 Index Analyze (SPX500USD), 1-hour time frame.
🛑 Always set a Stop Loss(SL) for every position you open.
✅ This is just my idea; I’d love to see your thoughts too!
🔥 If you find it helpful, please BOOST this post and share it with your friends.

GBPUSD - Relief Rally Into Resistance? Sellers Watching Closely📉GBPUSD remains overall bearish on the higher timeframe. Price is still trading within a descending structure, and the broader trend continues to favor sellers rather than buyers.
The recent upside move is best viewed as a corrective bounce, not a trend reversal. Price is now approaching a key confluence zone, where the former structure, horizontal resistance, and the descending trendline align.
This is the type of location where trend-following shorts become interesting. I’m not interested in selling blindly, but rather in waiting for lower-timeframe bearish confirmation once price reacts at this resistance zone.
⚔️As long as price remains below the descending trendline and fails to reclaim the range above, the bearish bias stays intact. A clean break and hold above this resistance would be the only thing that forces a reassessment.
For now, this looks like sellers getting another chance at a better price.
Will this resistance cap the move once again, or do bulls finally break the structure? 🤔
⚠️ Disclaimer: This is not financial advice. Always do your own research and manage risk properly.
📚 Stick to your trading plan regarding entries, risk, and management.
Good luck! 🍀
All Strategies Are Good; If Managed Properly!
~Richard Nasr
