GOLD → Psychological level retest before growth FX:XAUUSD breaks through consolidation resistance and renews its high to 4155. As part of a minor correction, a retest of 4100 may form and a battle for key support...
The probability of a Fed rate cut in December has risen to 81%. Fed members (Williams, Waller, Daly) supported the possibility of easing this year.
Progress in negotiations between the West and Ukraine with Russia reduces demand for defensive assets.
Gold remains sensitive to inflation and retail sales data. Strong figures could adjust rate expectations and limit growth, while weak data would support the bulls.
Technically, a retest of the 4110-4100 zone is forming. If the bulls hold their ground above this level, a new trading range of 4100-4150 could form.
Resistance levels: 4155, 4211
Support levels: 4111, 4100
The importance of the 4100 zone is that it is an area of imbalance and breakeven, a consolidation boundary, as well as a psychological level. Accordingly, the reaction to this area should be aggressive. If the reaction is weak, the price may be dragged below 4100. Otherwise, I expect consolidation above 4111 and further growth to 4155 (possibly to 4200).
Best regards, R. Linda!
Parallel Channel

BNBUSDT → The hunt for liquidity before the decline BINANCE:BNBUSDT.P breaks through the 880 support level as part of a global downtrend and updates its low to 790. Fundamentally and technically, the situation is weak...
Bitcoin and the cryptocurrency market as a whole are in a global downtrend. Within the trend, countertrend corrections are forming as a “hunt for liquidity” before the decline continues...
After updating its low to 790.9, BNB is forming a pullback, the target of which may be the resistance area of 879-888, which acts as a break-even zone (area of interest for MM). A false breakout could trigger a decline of 1/2, 2/3 of the current range.
Resistance levels: 879-880, 940
Support levels: 837, 814, 790
A retest of resistance and a lack of bullish potential could trigger a false breakout. Consolidation and a close below 879 could lead to another phase of selling and a correction to 837-814.
Best regards, R. Linda!

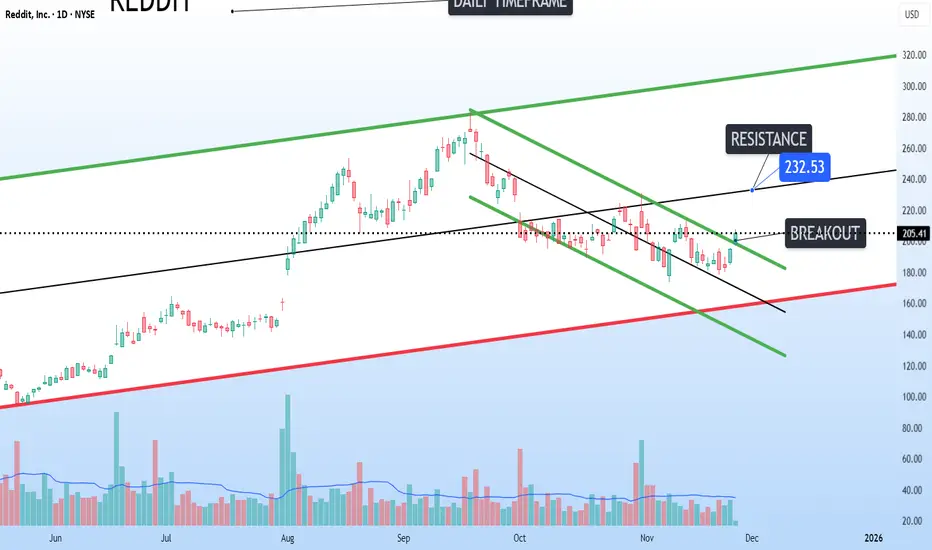
Breakout of local descending channelReddit NYSE:RDDT : The breakout from the local descending channel targets $232 before resistance, which is the mid-range of the ascending channel.
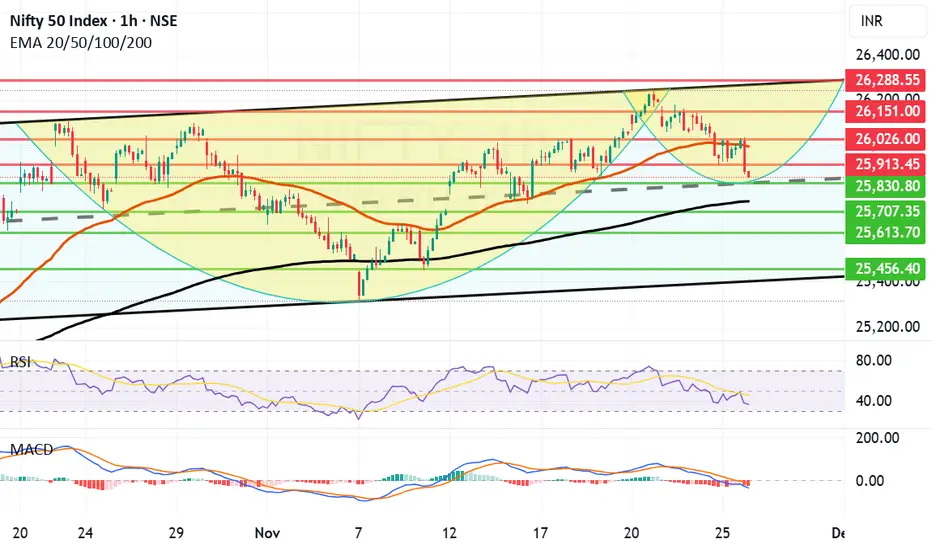
Relentless Profit Booking brings Nifty Further down. What next?The fall in Nifty continued today as again there was again profit booking. However the candles formed in hourly chart indicate that may be a temporary bottom is nearby. The supports nearby are at 25830, 25751 (Father line support, Major Support), 25707, 25613 and finally 25456. The resistance on the upper side for Nifty are at 25913, 25026, 25151 and finally 25288 which can be a new ATH and channel top resistance. (This will be tough to cross.)
The candle still is little bit negative to neutral and MACD is also yet to take a proper turn towards Bullish reversal so little bit of pain still might be there but you never know today's low of 25857 might also work as reversal point.
Disclaimer: The above information is provided for educational purpose, analysis and paper trading only. Please don't treat this as a buy or sell recommendation for the stock or index. The Techno-Funda analysis is based on data that is more than 3 months old. Supports and Resistances are determined by historic past peaks and Valley in the chart. Many other indicators and patterns like EMA, RSI, MACD, Volumes, Fibonacci, parallel channel etc. use historic data which is 3 months or older cyclical points. There is no guarantee they will work in future as markets are highly volatile and swings in prices are also due to macro and micro factors based on actions taken by the company as well as region and global events. Equity investment is subject to risks. I or my clients or family members might have positions in the stocks that we mention in our educational posts. We will not be responsible for any Profit or loss that may occur due to any financial decision taken based on any data provided in this message. Do consult your investment advisor before taking any financial decisions. Stop losses should be an important part of any investment in equity.
BTCUSD: Bulls Aim for Recovery Toward $92,000 Resistance ZoneHello everyone, here is my breakdown of the current Bitcoin setup.
Market Analysis
BTCUSD continues to move within a clearly defined Downward Channel, respecting both the descending resistance line and the lower support boundary. After a prolonged bearish continuation from the major Range structure seen earlier, Bitcoin broke several intermediate support levels before reaching the Support Zone around $84,000, where strong buyers stepped in. A Fake Breakout below the channel support triggered aggressive buying activity, sending the price back above the Support Zone and forming a short-term recovery structure. From this point, BTCUSD made a corrective bounce and even managed to break above a minor descending resistance, confirming a temporary shift in momentum.
Currently, price is approaching the Resistance Zone near $88,000–$90,000, which aligns with the upper boundary of the Downward Channel. This area has previously generated strong sell-offs and remains the key obstacle for buyers. A clean breakout above $90,000 would signal bullish continuation and may lead to a deeper recovery toward the next liquidity cluster near $92,000–$94,000. As long as BTCUSD holds above the $84,000 Support Zone, the short-term structure supports a bullish correction. However, if price gets rejected from the $90,000 resistance and fails to stay above support, sellers may regain control and push the market back toward the lower channel boundary.
My Scenario & Strategy
From my perspective, BTCUSD maintains a bullish corrective outlook while respecting the Support Zone around $84,000. The first target remains the $90,000 Resistance Zone, which matches both horizontal resistance and the channel’s upper boundary. A confirmed breakout above $90,000 would open the path toward $92,000–$94,000, where the next reaction levels are located. I will look for long opportunities during pullbacks toward the Support Zone or along the rising minor trendline that formed after the fake breakout.
If BTCUSD breaks back below $84,000, the bullish scenario becomes invalid, and a continuation of the major downward trend may follow. For now, price action supports a bullish recovery setup as long as buyers defend the Support Zone.
That's the setup I'm tracking. Thank you for your attention, and always manage your risk.

XAUUSD Ascending Channel Strengthens: Bulls Target $4,130 TP1Hello traders! I want to share my view on the current XAUUSD setup. After a deep corrective move, gold has formed a local bottom around the Support Level at $4,000–$4,030, where strong buying pressure has re-entered the market. As shown on the chart, price is gradually climbing within a well-defined ascending channel, supported by the rising trendline and a parallel upper boundary. Inside this structure, the Buyer Zone has played a crucial role, providing the base for previous impulsive breakouts. Several fake breakdowns below the channel support confirmed the presence of significant demand. After these rebounds, XAUUSD twice reached the Seller Zone and the Resistance Level near $4,130, where it faced clear rejection and rotated back toward the Buyer Zone. Currently, gold is holding above the ascending channel support. If buyers continue to defend the $4,030 level and price remains stable within the Buyer Zone, I expect a move toward TP1 → $4,130, which is the nearest resistance. A clean breakout above this level would open the door for further bullish continuation toward the upper supply area around $4,200–$4,230. However, if the price breaks below the Buyer Zone and drops out of the channel, the bullish scenario becomes invalid, and the market may revisit the $4,000 support area. For now, the structure remains moderately bullish as long as price holds above demand and stays inside the ascending channel. Please share this idea with your friends and click Boost 🚀

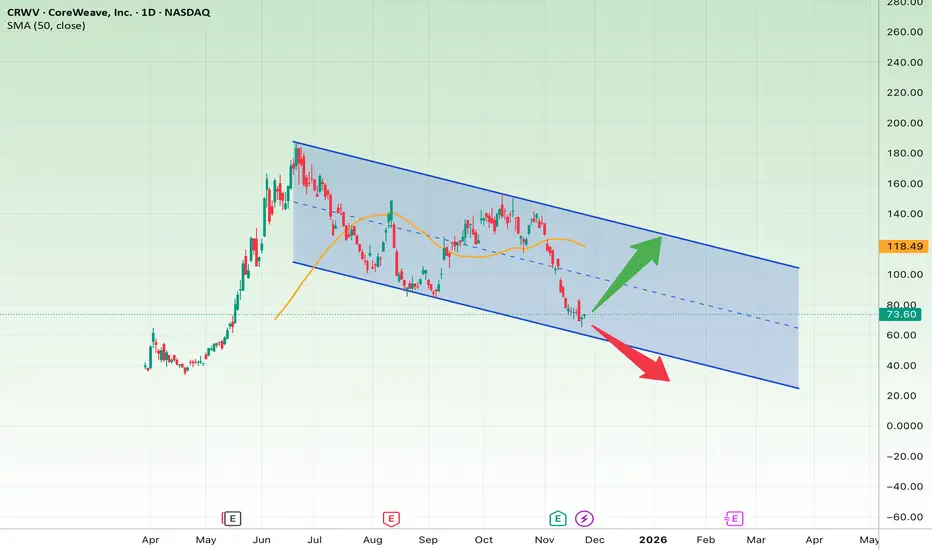
Is CRWV Ready for a Major Rebound—or a Bigger Crash?The chart shows CRWV moving inside a downward trending channel, and the price is now touching the bottom of the channel, where it has shown a mild bullish reaction. This zone can offer a good risk-to-reward long opportunity, but only if the lower boundary holds.
Bullish Scenario (if price holds above the channel bottom)
As long as CRWV stays above $68–$72:
• Target 1: $90
• Target 2: $105
• Target 3: $118 (top of the channel)
Bearish Scenario
If the price breaks below $68:
• Downside target: $50
• Extended bearish target: $30
Stop-Loss
• A confirmed break below $68 with strong bearish volume
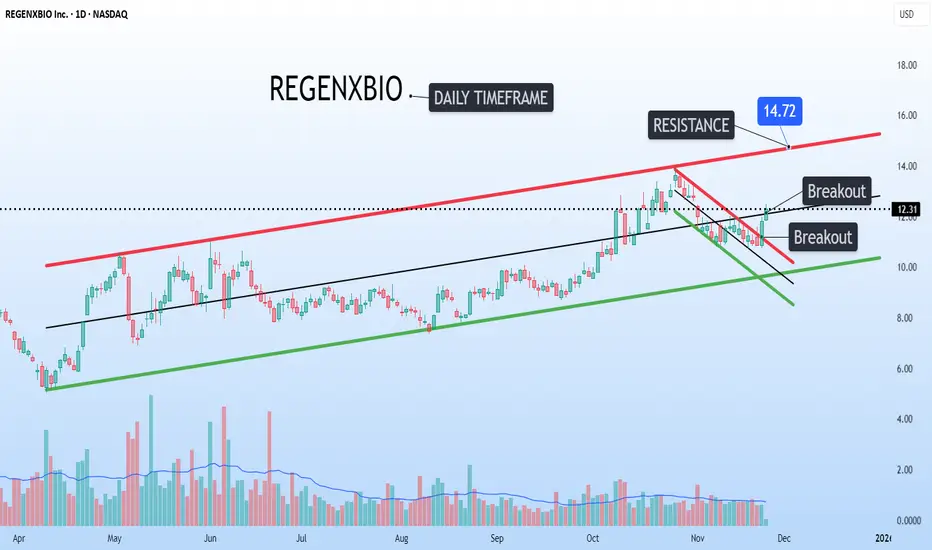
REGENXBIO Breakout of descending channelREGENXBIO NASDAQ:RGNX is gearing up for a big move on its daily chart after holding strong within a multi-month ascending channel.
The price action recently pulled back from the top of the channel and has now broken out of a short-term descending channel, indicating that buyers are starting to regain control.
The stock is currently sitting right on top of the middle mid-range of the larger ascending channel, which is a key pivot point for a continuation of the rally.
If NASDAQ:RGNX can hold this breakout and make a solid move higher, the next major target is that top channel resistance near $14.72.
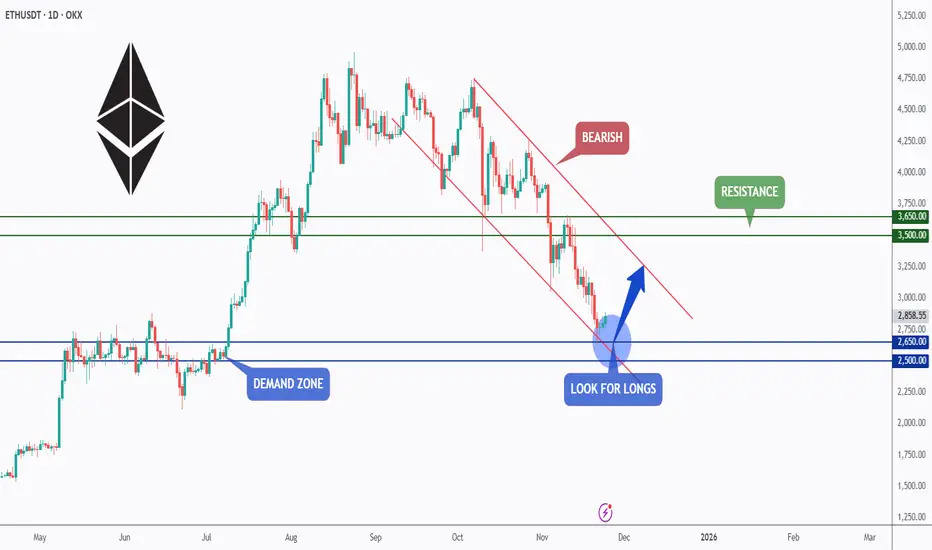
ETH - Demand Zone Meets Channel Support… Correction Loading?⚔️ETH is currently trading around a major demand zone, which lines up perfectly with the lower bound of the falling channel. This intersection forms a strong confluence area where buyers typically step in to absorb the selling pressure.
🏹As long as ETH holds above the $2,500–$2,650 zone, we will be looking for long setups, anticipating a big corrective move toward the upper bound of the falling channel. This would align with the natural rhythm of impulse → correction inside a bearish channel.
If the bulls manage to defend this area, the next targets sit around $3,500–$3,650, which represent the next key resistance levels. However, a break below the demand zone would invalidate the bullish correction setup and open the door for further downside.
ETH is now at a decisive point… will the demand zone trigger the next corrective leg upward? 🤔
⚠️ Disclaimer: This is not financial advice. Always do your own research and manage risk properly.
📚 Stick to your trading plan regarding entries, risk, and management.
Good luck! 🍀
All Strategies Are Good; If Managed Properly!
~Richard Nasr
Bitcoin is falling via the Descending channel As observed in typical market behavior, a descending channel often emerges as a corrective structure following significant upward movements—precisely the pattern currently visible on the Bitcoin chart. This channel reflects a near-term consolidation phase, allowing the market to absorb previous gains and establish a new equilibrium.
A decisive breakout above the upper boundary of this channel, particularly when supported by increasing volume, would signal the resumption of the primary bullish trend. In such a scenario, a renewal of upward momentum could propel the market toward new all-time highs, aligning with the broader bullish market structure.
DISCLAIMER: ((trade based on your own decision))
<<press like👍 if you enjoy💚

XRPUSDT is near channel support zone As observed on the chart, XRP has initiated a corrective phase within a defined descending channel, experiencing significant downward momentum. The price is now testing the channel's lower support boundary for a potential reversal. A strong reaction at this level, followed by a bullish reversal candle with supporting volume, could signal the start of an upward move toward the channel's upper resistance.
A decisive breakout above the channel, especially with increasing volume, would indicate a shift in market structure and likely activate further bullish momentum. In such a scenario, initial technical projections suggest a measured move toward the $4.00 level, which aligns with the pattern's implied volatility and previous key resistance zones.
DISCLAIMER: ((trade based on your own decision))
<<press like👍 if you enjoy💚

CRYPTO market see that bottom go for long The total cryptocurrency market capitalization is now testing a critical technical confluence, positioned at both a multi-week channel support and a significant historical demand zone. Following the recent market correction, this level represents a pivotal area where buyer interest has traditionally emerged. Should this support level hold, we anticipate a potential market-wide recovery that would likely catalyze upward momentum across major assets, with Bitcoin expected to lead this bullish reversal. The current price action suggests this zone may serve as the foundation for the next sustainable advance.
DISCLAIMER: ((trade based on your own decision))
<<press like👍 if you enjoy💚

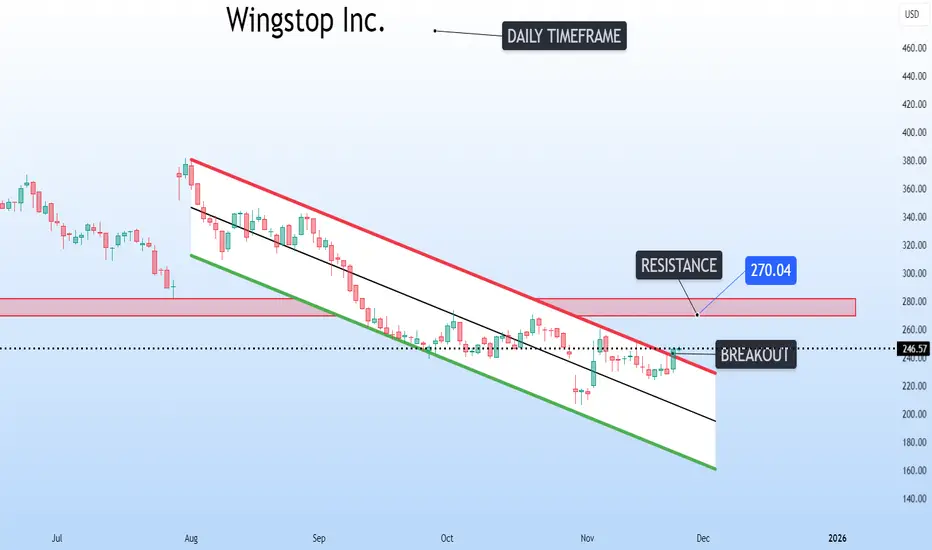
Wingstop Breakout from Descending ChannelWingstop NASDAQ:WING just triggered its first real shift in momentum.
After months of drifting inside a clean descending channel, price has now broken out of that structure and is pressing directly into the long-standing downtrend line that’s been capping every rally since August.
The real battlefield sits between $𝟮𝟳𝟬 𝗮𝗻𝗱 $𝟮𝟴𝟬.
Clear that level, and the downtrend that’s been weighing on this chart for months could finally be done.
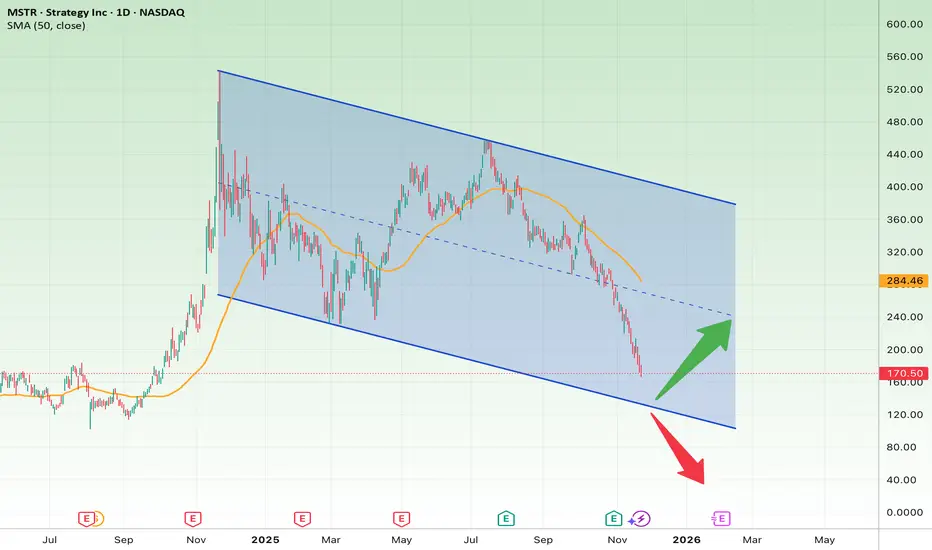
MSTR at a Breaking Point: Reversal Rally or a Deep Breakdown?The chart shows MSTR trading inside a large descending channel, with price now approaching the bottom boundary of the channel — a zone where strong reactions usually occur. The recent sell-off has been steep, indicating the stock is potentially oversold at current levels.
1. Key Support (Bottom of Channel)
• Major support: $150 – $160
This is the lower boundary of the descending channel and the most important level on the chart.
2. Bullish Scenario (Green Path)
If MSTR finds support at the bottom of the channel:
• Price may bounce toward the midline of the channel around $230 – $240.
• If momentum continues, the next key resistance is near the 50-day SMA and upper channel resistance at $280 – $300.
3. Bearish Scenario (Red Path)
If price breaks below the channel:
• A sharp decline toward $100 – $120 becomes likely.
• This is the next major support zone below the channel.
Bullish Targets
• TP1: $230
• TP2: $280
• TP3 (extended target): $320
Bearish Target
• TP (Downside): $120
Stop-Loss
• A daily candle closing below $150
This would confirm a breakdown from the channel and invalidate the bullish setup.
BTC not in great spot for trading up or downLong or short here looks sub optimal. To many landmines either way. Best option for long is we fall to the major GP then pivot back to the 107k area.
We are holding this for range POC and creating a daily level for now, so does appear up is the direction, just not happy with R/R here. Check out my ETH chart posted earlier, that is much clearer on a long with great R/R, or if it we do roll over for a short.

My Ideal Elliott Wave Entry ModelThe IMSETT 3/C Entry Model.
Every trader wants to catch the big moves the ones that pay quickly and decisively. In Elliott Wave, those moves often come during Wave 3. It's the strongest part of the trend, and when you're positioned early, the risk-to-reward is unmatched.
But not every opportunity hands you a clean Wave 3 on a silver platter. Sometimes you’re looking at a Wave C instead. That’s where the 3/C Entry Model comes in. It’s designed to get you aligned with high-conviction moves—whether the market is in a trend or a zig zag.
Here’s the edge: both Wave 3 and Wave C often start the same way—a strong, motive push off an AOI (area of interest), followed by a retracement. That shared structure gives us an anchor. Whether we’re labeling it a 3 or a C doesn’t change the fact that the initial impulse gives us clarity, direction, and a place to manage risk.
That’s what the IMSETT Model is built around:
Identify
Motive
Scout
Entry Plan
Track
Trade
Each step is focused, actionable, and repeatable. You're not trying to outguess the market—you’re reacting to structure, preparing for common behavior, and executing with intent.
I do have a video with a walk through.
This just the way I look for clarity in setups. As with everything in trading, nothing will work every time so do your own research this is not financial advice.
Cheers!
Trade Safe, Trade Clarity.

EURUSD: Targets focus on declines to 1.1480 support levelHello everyone, here is my breakdown of the current Euro setup.
Market Analysis
EURUSD continues to trade within a clear Downward Channel, maintaining a strong bearish structure characterized by consistent lower highs and lower lows. Early in the chart, the pair formed a prolonged Range Phase, signaling indecision before sellers eventually took control and pushed the price downward. After breaking below the range, EURUSD repeatedly retested the Resistance Area around 1.1550, where the market showed strong bearish reactions. Each bounce into this resistance zone resulted in a clear rejection, proving that sellers consistently defend this area. The chart also highlights multiple Breakout attempts, all of which failed to sustain upward continuation, confirming a lack of bullish strength. Additionally, the chart shows the formation of a Triangle Pattern, with price reacting between the Triangle Resistance Line and the Triangle Support Line. Despite temporary recoveries, every move upward was limited and capped by descending trendline pressure.
Currently, EURUSD broke below the minor structure support again, demonstrating that bearish momentum remains dominant. Price is now heading toward the Support Zone near 1.1480, which aligns with both horizontal demand and the Triangle Support Line. This confluence makes it a key level to watch. As long as EURUSD trades below the 1.1550 Resistance Area and stays inside the Downward Channel, the bearish structure remains intact. Any bullish recovery is likely to be corrective rather than trend-changing unless buyers manage to break above major resistance.
My Scenario & Strategy
I expect EURUSD to continue edging lower toward the 1.1480 Support Zone, following the recent rejection from resistance. A minor upward correction may occur, potentially retesting broken support or the Triangle Resistance Line, but such a move would likely be short-lived without strong bullish confirmation.
A confirmed breakdown below 1.1480 would open the path for deeper bearish continuation within the Downward Channel. Only a solid breakout above 1.1550, backed by strong buying pressure, would challenge the prevailing bearish trend. For now, selling the pullbacks remains the more favorable strategy while price stays below major resistance.
That's the setup I'm tracking. Thank you for your attention, and always manage your risk.

XAUUSD: Price Holds Triangle Support, Aiming for $4,120Hello everyone, here is my breakdown of the current Gold setup.
Market Analysis
XAUUSD is trading within a broad symmetrical triangle structure, where price continues to respect both the Triangle Resistance Line and the Triangle Support Line. After a strong bullish rally inside the Upward Channel earlier, Gold reached the Resistance Area around $4,120–$4,130, where a sharp reversal occurred. This zone has consistently acted as a major supply level, triggering multiple corrections in recent sessions. Following the breakout below the Upward Channel, XAUUSD entered a consolidation phase supported by the Support Zone near $4,000, which aligns with the lower triangle boundary. This level has proven to be a key reaction zone, showing strong buyer interest each time price tested it.
Currently, Gold attempted another bullish push after bouncing from the Triangle Support Line. Price is now approaching the Resistance Area once again, but buyers face strong selling pressure around $4,080–$4,120, which overlaps with both horizontal resistance and the descending triangle boundary. A break and close above the Triangle Resistance Line would confirm bullish continuation and likely lead to a retest of higher liquidity levels near $4,180–$4,200. As long as XAUUSD stays above the $4,000 Support Zone, the broader structure remains bullish. However, sustained failure to break the resistance area may result in another corrective move back toward the Triangle Support Line.
My Scenario & Strategy
From my perspective, as long as Gold holds above $4,000, the bullish bias remains intact.
My near-term target (TP1) is the $4,120 Resistance Area, with potential extension toward $4,160–$4,200 if buyers manage a clean breakout above the triangle resistance. I will look for long entries on pullbacks toward the Triangle Support Line or the Support Zone around $4,000–$4,020, especially if bullish rejection patterns appear.
If XAUUSD breaks below the $4,000 level, the bullish setup becomes invalid and deeper correction toward $3,960–$3,920 may follow. For now, price action favors a bullish continuation setup, provided support continues to hold.
That's the setup I'm tracking. Thank you for your attention, and always manage your risk.

EURUSD Weakens at Resistance — Pullback Toward 1.1480 ExpectedHello traders! Let’s break down the current EURUSD structure. EURUSD continues to trade inside a broad descending channel, where both the resistance and support lines have been respected multiple times, forming a steady sequence of lower highs and lower lows. Each touch of the upper boundary resulted in a clear Turned Around reaction, confirming the strength of seller control within the overall bearish trend. Earlier, the pair entered a range phase in the left section of the chart, where price consolidated before breaking to the downside. This breakout accelerated bearish momentum, pushing EURUSD toward the lower half of the channel. Subsequent attempts at recovery formed shallow corrections, each aligning with the mid-channel dashed trendline, signaling persistent downward pressure. Recently, price approached the Buyer Zone near the 1.1480–1.1500 region, which also overlaps with the broader Support Level and the lower boundary of the descending channel. This area has previously acted as a strong reaction zone, and buyers are once again attempting to hold this level. At the moment, the EURUSD pair is showing early signs of a potential corrective rebound, with the price aiming for the nearest resistance level around 1.1540, which also coincides with the seller's zone. This region previously acted as support, and is now expected to serve as a barrier for a retest. As long as the pair remains below the descending resistance line, the broader trend remains bearish. A short-term correction to the level around 1.1540 is likely if buyers continue to defend the support level. However, a deviation from the resistance cluster could trigger renewed selling pressure, potentially sending EURUSD back to the channel bottom for another reaction. In my opinion, the price will move towards TP1 with a target of 1.14800. A confirmed break above the descending resistance line would be the first sign of a possible bullish shift, opening the door for a stronger recovery. Please share this idea with your friends and click "Boost" 🚀

SLPUSDT take a look at this chart soon massive pump SLPUSDT presents a compelling technical setup with significant potential. After an extended bearish period spanning multiple years, the token is now approaching a critical technical juncture. The daily chart shows the asset consolidating near the upper boundary of its long-term trading channel.
A decisive breakout above this channel resistance, particularly when accompanied by substantial volume confirmation, could signal the completion of the accumulation phase and mark the beginning of a new bullish cycle. Based on the depth and duration of the preceding basing pattern, technical projections suggest a potential appreciation target of 300% or more upon successful channel breakout validation.
DISCLAIMER: ((trade based on your own decision))
<<press like👍 if you enjoy💚

SUI Technical Analysis — Is a Major Reversal Coming?SUI is currently moving inside a large descending channel, consistently respecting both the upper and lower trendlines. Price is now approaching a critical decision zone where two scenarios become likely.
Bearish Scenario (Red Path)
If the current weakness continues, SUI may drop toward the bottom of the channel, which aligns with the long-term rising trendline.
• Support Zone: $0.70 – $0.75
This area is the strongest confluence of support on the chart.
A bounce from here would be highly probable.
Bullish Scenario (Green Path)
If SUI holds above the lower boundary and shows a reversal pattern, we can expect a recovery toward the mid-range of the channel.
• First Target: $1.63
• Second Target: $2.38 (midline + major horizontal level)
A break above the midline could signal a trend shift.
Suggested Trade Plan
• Entry Zone: Around $0.75 – $0.80 (lower channel + long-term trendline)
• Stop-Loss: $0.60 (below channel + invalidation level)
• Target 1: $1.63
• Target 2: $2.38
Risk/reward becomes highly favorable only if price gets closer to the lower trendline.

XRP at a Make-or-Break Moment: Rebound Ahead or Major Breakdown?XRP has now reached the lower boundary of its long-term ascending channel, a level that has historically triggered either strong bullish reversals or major breakdowns.
This area represents the true decision point between continuation of the uptrend or a potentially deep correction.
Technical Overview
Structure
• Price has been moving inside a broad ascending channel for more than a year.
• It is currently testing the channel support.
• The 50-day SMA is above the price → bearish pressure still present.
Bullish Scenario (if the channel support holds)
If XRP stabilizes above 1.90–1.95:
Targets:
• Target 1: $2.43
• Target 2: $2.85
• Target 3: $3.20
• Major Target: Channel top near $4.00
Conditions for confirmation:
✔ Holding the lower channel line
✔ Reclaiming the 50-day SMA
Bearish Scenario (if the channel support breaks)
A daily close below $1.85 would confirm a breakdown.
Targets:
• Target 1: $1.60
• Target 2: $1.28
• Final Target: $1.00 or lower
This scenario becomes active if the channel fails.
Suggested Stop-Loss
For long positions: $1.85
For short positions (after breakdown confirmation): $2.05

BTCUSDT DAILY ANALYSIS📌 1. Main Condition of BTCUSD Daily
From the chart, it is clear that:
➤ BTC is currently in a strong corrective phase (strong downtrend).
The daily resistance trendline (red) is very dominant.
The weekly support trendline (purple) has already broken → a clear signal of structural weakness.
Price is now sitting right inside the Demand OB + High Volume Support zone (green area).
This is a logical zone for a buy reaction or relief bounce.
📌 2. Current Price Action
➤ Yesterday’s volume was extremely high.
High volume occurring as price hits a demand zone typically indicates one of two possibilities:
Seller absorption by large buyers → potential reversal/bounce.
Capitulation → final sell-off before sideways or reversal.
Based on the candlestick:
Yesterday’s candle shows a long lower wick, indicating buyers reacted strongly to demand.
But the candle closed red → buyers are not fully in control yet.
So, there is a reaction — but not yet a valid signal for a mid-term reversal.
📌 3. Should You Wait for a Bullish Engulfing?
I recommend:
✅ Yes — wait for a Bullish Engulfing or Strong Reversal Candle.
Because:
Market structure is still bearish (lower low – lower high).
A bullish engulfing inside a demand zone confirms buyers have taken over.
Volume is present → we only need a confirmation candle.
Bullish engulfing inside demand + strong volume = high-probability entry.
📌 4. Will BTC Consolidate?
After such a sharp decline, BTC often:
➤ Consolidates inside the demand zone before deciding the next direction.
This is supported by:
Long lower wick
Extreme volume spike
Price already far from the resistance trendline
Price sitting in major demand OB
Most likely scenario:
BTC will enter a ranging / sideways phase for a few days before breaking up or down.
📌 5. Key Levels
Major Support
$82,000 – $78,000 = demand + high-volume node
If this breaks → next target $73,500, or even $68,000 (long green trendline below).
Closest Resistance
$90,000 – $92,000 = supply retest + broken structure
If price breaks above → potential move toward $96,000.
