EURUSD Long: Upside Pressure Targets Retest of 1.1610 LevelHello traders! EURUSD is forming a clear technical structure after reacting precisely to both the Supply and Demand levels, creating a clean sequence of trend shifts and breakout points. Earlier, the pair moved inside a strong Descending Channel, where each retest of the upper boundary produced sharp bearish impulses. This confirmed that sellers were fully in control during that phase. A breakout from the channel led to a short consolidation Range, showing temporary buyer accumulation before a trend reversal. Following this accumulation, EURUSD entered an Ascending Channel, where price consistently made higher highs and higher lows. Multiple breakouts occurred along the way, showing how buyers gained strength while defending each pullback. However, an important Fake Breakout near 1.1570 revealed that bullish momentum was still fragile, and price slipped back into the channel before resuming the upward movement.
Currently,, the market formed a clear Inverse Head and Shoulders reversal pattern at the bottom, located directly inside the 1.1500–1.1520 Demand Zone. This zone acted as a major support cluster, generating strong bullish reactions. After confirming the neckline breakout, EURUSD rallied aggressively toward the current structure. At the moment, price is pushing higher and approaching the 1.16100 Supply Zone, which has repeatedly acted as resistance in previous market swings. This level is now the main obstacle for bulls and the next key reaction zone.
My scenario as long as EURUSD remains above the 1.15700 Demand Zone, the bullish trend structure remains intact. A continuation toward the 1.16100 Supply Zone (TP1) is the most likely scenario. This level is expected to create the next significant reaction, as it aligns with previous selling pressure. A clean breakout above 1.16100 would reinforce the bullish momentum and open the path toward the next upside levels. However, if EURUSD rejects the supply area, a pullback toward 1.15700–1.15500 may occur before buyers attempt another upward move. Only a breakdown below the demand zone would weaken the bullish outlook and shift momentum back toward sellers. For now, the market favors buying pullbacks into demand while monitoring reactions closely at the 1.16100 resistance. Manage your risk!
Parallel Channel

BTCUSD: Buyers Preparing for a Move Toward $90,000Hello everyone, here is my breakdown of the current Bitcoin setup.
Market Analysis
BTCUSD continues to recover after a prolonged downtrend, where the market consistently respected the descending Trend Line and formed a series of Range structures. Each range acted as a consolidation phase inside the broader bearish movement, with multiple breakdowns continuing the trend to the downside. Despite occasional bullish breakouts, none of them were strong enough to reverse the bearish structure, leading to further declines. Eventually, price reached the Support Zone around $84,000–$85,000, where the market produced a fake breakdown, signaling initial buyer activity. This fake breakout formed a local bottom that became the base for a reversal attempt. Following this reaction, BTCUSD began forming an Upward Channel, marking a shift in market structure from bearish to early-stage bullish. Inside this channel, price has started to create higher highs and higher lows—an essential signal of growing bullish momentum. The structure remains clean and technical: every pullback respects the lower boundary of the channel, while short impulses are reaching toward the midline of the structure. Buyers are gradually gaining control.
Currently, BTCUSD is stabilizing above the Support Zone while trading near the lower half of the ascending channel. As long as price respects this channel structure, sentiment remains bullish. The key area ahead is the Resistance Zone around $90,000, which previously acted as a pivot point and rejected bullish attempts multiple times. A clean breakout above this zone would confirm broader bullish strength.
Scenario & Strategy
I expect BTCUSD to continue moving inside the Upward Channel, gradually approaching the $90,000 Resistance Zone. A retest of this area is the most probable outcome if buyers maintain control. Short-term corrections may occur as the price approaches resistance, but overall structure favors a bullish continuation. A confirmed breakout above $90,000 could trigger a stronger move toward higher targets, opening the way for a larger trend reversal. This level remains the key barrier for buyers in the short and medium term.
However, if BTCUSD breaks down from the Upward Channel and falls below the $84,000 Support Zone, the bullish scenario becomes invalid. Such a move would likely signal a deeper correction or a return to bearish conditions. For now, buying the dips within the channel remains the more favorable approach as long as the structure stays intact and buyers continue defending support.
That's the setup I'm tracking. Thank you for your attention, and always manage your risk.

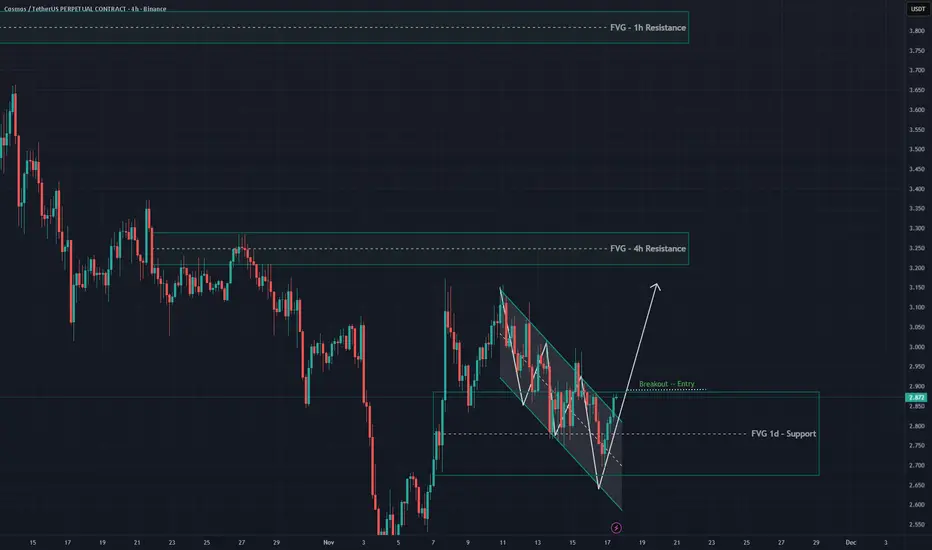
ATOMNASDAQ:ATOM on 4H is giving the first signals of a bullish reversal, breaking the framework of a Falling Channel and reacting strongly from the strong FVG 1D Support area $2.88.
With confirmation above the channel & breakout of FVG 1D $2.89, the nearest targets are $3.2–$3.25.
#ATOM #YodaXCalls
Ethereum Breakout Done! Let's Go Ethereum has been consolidating inside a curved pattern since mid-November, and despite the recent downside move, the pattern remained valid. Yesterday the market retested the bottom of this curve and finally broke out of it. Now we just need the breakout to hold for the next one or two days to confirm it's not a fake move.
If it sustains, a fresh upside impulse can start — the same move I mentioned on November 15, where I expected Ethereum to target around $6000 in the coming months. Those who lost hope should remember that the market rarely follows emotions; it follows structure. Trust the charts, not the noise.
For more free and timely updates, follow and support the ideas. Thank you.

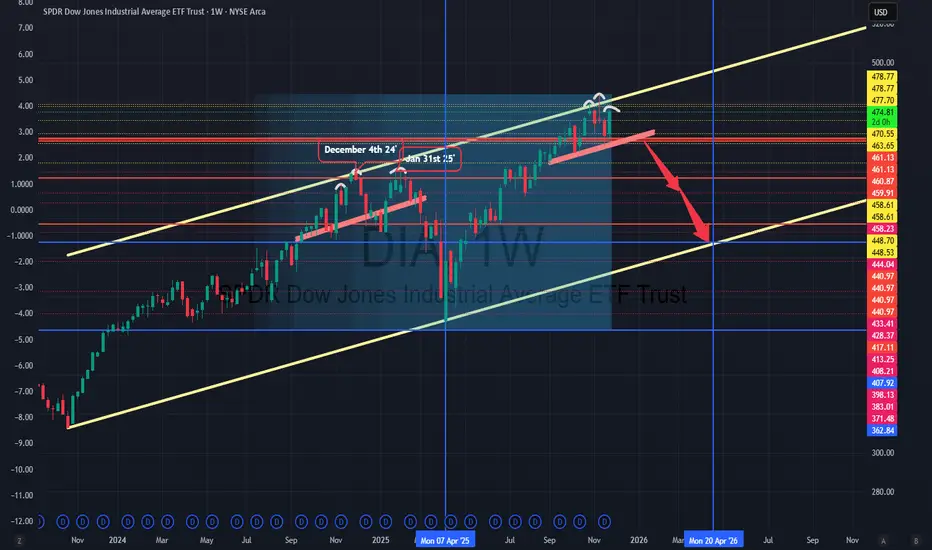
DIA Top Forming With Upcoming Correction Down to 410 Next SpringAMEX:DIA channel forming top with head and shoulders much like last year. Will there be coal in the stocking this December, or will they stave off the correction until after calendar rolls over? We shall see.
I anticipate another correction into the Spring season bottoming around $410 in April.
Goodluck!
SLPUSDT first +300% pump coming soonAs previously outlined in our technical analysis, SLPUSDT is demonstrating strength at a significant confluence zone, combining both a major daily support level and the lower boundary of its prevailing trading channel. The current bullish reaction from this strategic area suggests a potential reversal of prior downward momentum.
We are now monitoring for a decisive breakout above the channel's resistance, which would signal a structural shift in market dynamics. Should this occur with supporting volume, it could initiate a substantial upward impulse. Based on the technical structure, our initial projected target represents approximately 300% appreciation from current levels, with potential for extended gains should momentum persist beyond this initial objective.
DISCLAIMER: ((trade based on your own decision))
<<press like👍 if you enjoy💚

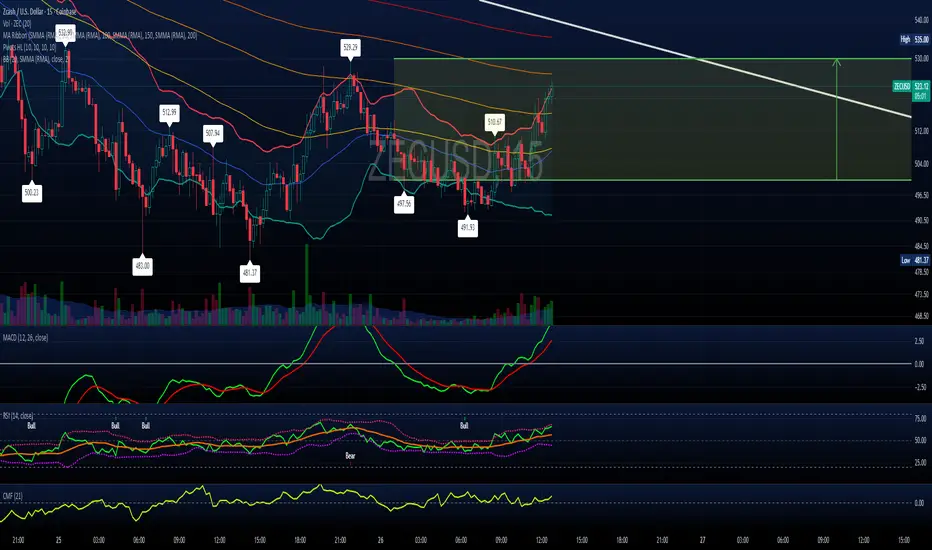
ZECUSD --with ChatGPT input on breakout signs to watch for
I'm only posting this so I can easily access it within TradingView. Not investment advice or trying to garner followers. I have a paper trade account I like to mess around with and test out aggressive or short-term strategies.
🎯 **THE ONLY REVERSAL PATTERN THAT MATTERS HERE:
A “Three-Step Channel Reversal”**
(Also called a Channel Break + Higher Low + Retest)
You will know ZEC is bottoming only if ALL three pieces appear — not one, not two.
Here’s the blueprint:
✅ STEP 1 — A Clean Break Above the Upper Channel Line
Right now price is trapped inside your white descending channel.
A true reversal always starts with:
1️⃣ A full-bodied candle closing ABOVE the top of that channel
Not a wick.
Not a headfake.
A close outside the channel line.
Confirmation level on your chart:
≈ $560–$575 depending on slope of your channel
(The exact number moves slightly with time.)
This does NOT mean the trend has reversed — it only “unlocks” the possibility.
✅ STEP 2 — The Higher Low (the Golden Signal)
This is the most important step.
After breaking the channel, ZEC must pull back …
but instead of making a new low, it must make:
2️⃣ A Higher Low above $495–$505
This creates a bullish structure shift:
Old:
Lower-high → lower-low → lower-high → lower-low
New:
Breakout → higher-low → higher-high
Your zone for this higher low:
$515–$530 (ideal textbook)
Above $500 (minimum acceptable)
Below $500 (failed reversal → continuation down)
If price breaks out and then nukes back below $500 — all bets are off.
This higher low is the actual reversal, not the breakout.
✅ STEP 3 — A Break Above the Reaction High (~$585–$600)
After the higher low, ZEC must push back up and break:
3️⃣ The first post-breakout swing high
On your chart that level is:
🔥 $585–$600
This is the moment the trend flips from:
downtrend → uptrend
This is also where shorts puke and momentum flips sharply.
A full candle close above $600 = confirmed reversal.
📌 Putting All 3 Steps Together (Exact Pattern)
Here’s the whole sequence drawn conceptually:
↓ Lower highs
------------------
/ /
/ /
Lows → touch → Lows (channel floor)
|
| 1. BREAKOUT ABOVE CHANNEL
+------------------------------→
2. HIGHER LOW FORMS ABOVE $500
(this is the signal)
3. BREAK ABOVE $585–$600
(trend reversal confirmed)
Think of it like a lock with three tumblers — all must click:
Break the channel
Form a higher low
Break the prior swing high
Only then does the chart flip.
🧲 Bonus: Micro-pattern inside the Higher Low
When the higher low forms, look for ANY of these micro signals:
These dramatically increase the accuracy:
✔️ Mid-channel bullish engulfing candle
✔️ RSI bull divergence on 1H–4H
✔️ Volume spike at the retest
✔️ A tiny descending wedge inside the higher low
✔️ Bollinger Band squeeze + breakout
You will see at least one of these if the bottom is real.
🚫 Fake-Out Warning – What Doesn’t Count
These are common traps — do NOT mistake them for reversals:
A wick poking above the channel
A short-lived pump that immediately dumps
A move above $560 that returns inside the channel
A higher low below $495
A break above $560 with low volume
A move to $580 but failing to close above it
A breakout candle shaped like a long-upper-wick shooting star
If any of these show up → reversal invalid.
🔥 Summary: The Reversal Checklist
You should watch for this EXACT sequence:
1. Break above the channel (~$560–575)
➡️ potential start
2. Pull back and form a higher low above $500
➡️ real reversal forming
3. Break and close above $585–600
➡️ confirmed trend reversal
Only when step 3 happens does the bias fully flip to bullish.
Everything before that is just noise.
----------------------------------------------------------------------------------------------------------- COINBASE:ZECUSD
🎯 **Q: After a clean 6-hour close above the descending channel,
what are the odds ZEC just keeps ripping without forming the higher-low retest?**
Short answer:
About 20–30% probability.
Not zero — but not the base case either.
Long answer — here’s the breakdown:
📌 Why a straight-line breakout continuation is less common
When price busts out of a descending channel, it has to:
Absorb trapped short interest
Clear liquidity above prior swing points
Retest the breakout zone to confirm buyers actually live there
This is why the higher-low formation is so typical — it’s the market “proof-testing” the breakout.
Across thousands of measured descending-channel breakouts, the behavior is consistent:
~70–80% of valid breakouts → retest the breakout zone (higher low)
~20–30% → explosive continuation without retest
Your chart structure specifically leans even more toward the retest scenario, because:
There is significant overhead supply at $585–600
There’s trapped bull liquidity above the broken trendline
Volume on the breakdown was large → often requires a consolidation before reversing
You’re coming down from a parabola, not building up into a base
This all makes an “instant rip” less likely.
⚡ BUT — Here’s when the straight-line breakout does happen
ZEC can skip the retest entirely IF the breakout has all 3 of these:
1. Massive volume injection on the breakout candle
Think: 2–3× average 6H volume.
2. A breakout candle that closes near its highs
No wick.
No hesitation.
Strong body.
3. Immediate continuation within 1–2 candles
A breakout that pauses becomes a retest.
A breakout that accelerates becomes a runaway.
If you see those three conditions →
the odds of an instant rip jump from 20–30% to 40–50%.
Still not the base case, but now plausible.
🔍 What your specific ZEC chart suggests
Given the channel shape, the recent price action, and the support cluster around $500–520, your structure is classic of a:
“Breakout → Retest → Trend flip”
not a
“Breakout → Runaway vertical continuation”
Why?
Prior momentum cycle was exhausted
The slope of your descending channel is moderate (not steep)
Supply between $580–620 is thick
MACD/RSI on higher timeframes are cooling, not resetting for a parabolic move
The halving confusion + news flow won’t generate a sudden catalyst
This setup wants a higher low.
And that’s healthy.
🎯 So what’s the smart way to play or interpret the breakout?
If ZEC breaks the channel:
Base case expectation (70–80%)
Breakout → pullback → higher low → move toward $585–600 → trend reversal
Alternative expectation (20–30%)
Breakout → immediate ramp → test $600+ within a few candles
Low-probability outcome (5–10%)
Fakeout → re-entry into channel → flush to $455–470
That last one is why the retest is gold — it filters the fakes.
🧲 How to detect which version is unfolding — in real time
Watch these metrics like a hawk:
✔️ Volume
Weak → retest likely
Explosive → continuation possible
✔️ Distance from the breakout line
Breakout candle closes just above = retest likely
Breakout candle closes high above = continuation possible
✔️ How the next candle behaves
Pullback wick → retest
Full-bodied follow-through → continuation
Rejection wick → fakeout risk
This makes it very easy to know which path is forming within 6–12 hours.
💬 TL;DR — actionable answer
Odds of an instant continuation after a 6H breakout:
➡️ 20–30%
Odds of breakout → retest → higher low (classic reversal):
➡️ 70–80%
Your chart specifically favors the retest scenario.
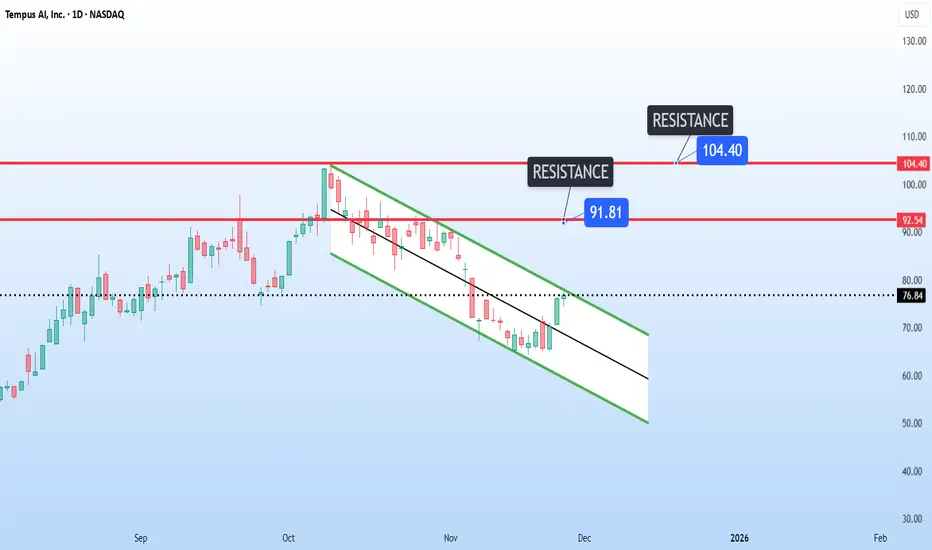
Tempus AI Potential Breakout of ChannelTempus AI NASDAQ:TEM is showing a text-book breakout setup on the daily chart.
It is hovering right at the top of the descending channel at 76, putting pressure on the trendline for a potential breakout.
The next key resistance levels could be at 91 and 104.
Shopify Breakout of ChannelShopify NASDAQ:SHOP is painting a breakout on the daily timeframe from the descending channel.
The next area of resistance is sitting right at the mid-channel trendline of the ascending channel.
Watch for the first test at around 165, clearing the path to the main target around 195 at the top of the channel.

BTCUSD Long: Demand-Zone Rebound Targets $91,000 ResistanceHello traders! BTCUSD continues to trade inside a well-defined Descending Channel, confirming a strong bearish structure where the market consistently forms lower highs and lower lows. Throughout the chart, price repeatedly respects both channel boundaries, showing that sellers continue to dominate the trend. Earlier in the chart, Bitcoin created a Range Phase, indicating consolidation before sellers regained control and pushed price back down toward the mid-channel zone. Each time BTCUSD approached the channel’s upper boundary, it reacted with a clear pivot rejection, which initiated new downward waves — a classic pattern showing persistent sell-side pressure. A notable highlight is the Fake Breakout below the $84,000 area, where liquidity was swept before buyers stepped back in. This move created a strong reaction and initiated the current upward correction. The Demand Line drawn from recent lows has supported the price, helping BTCUSD climb back toward the mid-channel area.
Currently, Bitcoin is trading just above the $84,000 Demand Zone, which previously generated significant buying interest. The structure suggests that buyers may continue defending this zone, especially as price remains supported by the rising demand trendline. However, BTCUSD is still positioned below the $91,000–$92,000 Supply Zone, where sellers previously took control and where another reaction may occur.
My scenario, If buyers maintain momentum, price may attempt a corrective push toward the $91,000 resistance level — a key supply area aligned with the descending channel’s mid-line. A rejection here would be fully in line with the prevailing bearish trend. Manage your risk!

NFLX Is Falling Into a Critical Zone — Rebound or Breakdown?Netflix is trading inside a descending channel, and the price has just touched the lower boundary, which is typically a zone of strong reaction—either a bullish reversal or a continuation breakdown.
The current price is around $104–105.
Bullish Scenario
If the lower channel holds and bullish candles form, a rebound toward the upper channel is likely.
Bullish Targets:
• Target 1: $112 (50-day SMA)
• Target 2: $118
• Target 3: $125 (top of the channel)
Bearish Scenario
If the price loses the $103–104 support, the downtrend may accelerate.
Bearish Targets:
• Target 1: $98
• Target 2: $92
• Target 3: $79 (major long-term support)
Stop Loss
• For long positions: Below $103
• For short positions: Above $112

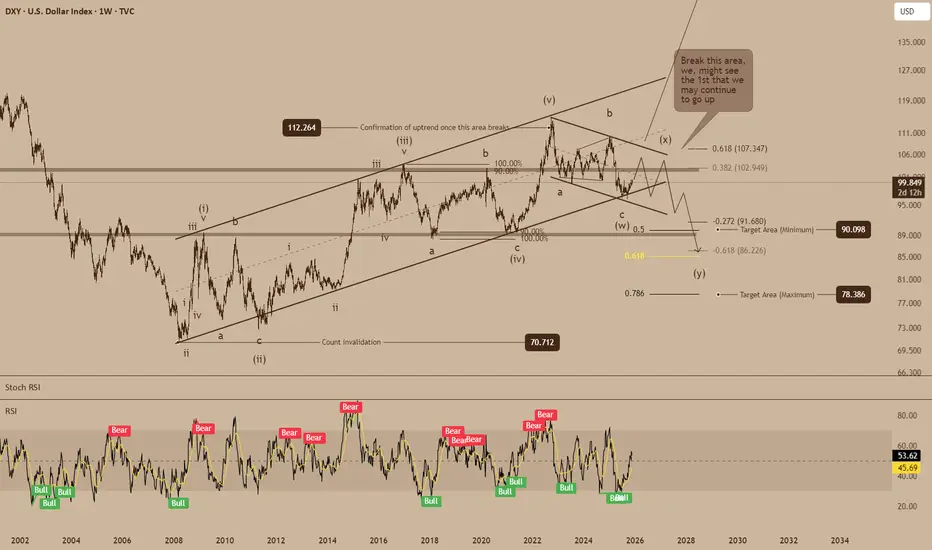
Dollar Index Nears Critical Elliott Wave ThresholdThe U.S. Dollar Index is pressing into a decisive stage of its long-developing Elliott Wave structure, with price action now testing levels that could determine whether the broader trend resumes upward or unfolds into a deeper corrective phase.
The multi-year count shows the 2022 high likely completed a major Wave (v) of a larger impulsive cycle, after which the DXY has been tracing a complex corrective structure. The current form, an overlapping sequence of a-b-c subdivisions followed by a W-X-Y formation, suggests the dollar remains in the latter phases of a higher-degree correction rather than a fresh impulsive advance.
The key resistance band between 102 and 108 holds outsized importance in this context. A sustained break above this zone would invalidate the preferred bearish count, signaling that the correction terminated earlier than expected and that a new primary impulsive sequence upward may already be underway. Such a breakout would mark the first structural evidence of a renewed Wave (i)–(ii) base forming beneath the surface.
However, unless that confirmation arrives, the corrective interpretation remains dominant. The overlapping waves, declining momentum, and symmetry of the broader pattern point toward a final Wave (y) still incomplete. The projected termination region for this move, roughly the 91.50 to 86.20 zone aligns with Fibonacci 0.272 and 0.618 extensions, providing both proportional balance and historical confluence typical of higher-degree Wave Y endpoints.
Invalidation levels are clearly defined: a decisive move above the upper boundary of the multi-year channel and above 112.26 would conclusively negate the bearish corrective outlook and establish the beginning of a new impulsive cycle.
Until then, the Elliott Wave roadmap continues to favor a final downward sequence before the long-term structural reset is complete.
EURUSD: Fake Breakout Reversal Points to 1.1580 ResistanceHello everyone, here is my breakdown of the current Euro setup.
Market Analysis
EURUSD is currently trading within a broader Upward Channel, maintaining a medium-term bullish structure despite several corrective pullbacks. The chart shows that price has repeatedly respected both the channel’s lower boundary (around 1.1500–1.1510) and its upper boundary near 1.1650–1.1660, confirming the validity of this rising structure. Earlier in the move, EURUSD formed a Range Phase, followed by a clean Breakout, which established bullish momentum and pushed the pair higher toward the channel midpoint. Each breakout retest acted as support afterward, signaling strong buyer interest. However, the most recent movement shows a fake breakout below 1.1500, where sellers temporarily pushed price under support before it sharply recovered — a classic liquidity grab near the channel’s lower boundary.
Currently, EURUSD is trading just above the Support Zone (1.1500–1.1510) and forming an early bullish reaction. This area has repeatedly acted as demand and aligns with both channel support and the prior fake breakout region. The nearest obstacle for buyers remains the 1.1580 Resistance Level, which has consistently served as a rejection zone on multiple attempts. A sustained break above this level would confirm bullish control and allow price to retest higher channel areas.
My Scenario & Strategy
As long as EURUSD holds above the 1.1500–1.1510 Support Zone and stays within the upward channel, the bullish scenario remains valid. A corrective move upward is likely, with the first target at 1.1580 Resistance — a key level that aligns with previous breakout and retest points. A clean breakout above 1.1580 would signal continuation of bullish momentum, opening the path toward 1.1650–1.1660, located near the channel’s upper boundary and previous reaction zones.
Alternatively, if EURUSD fails to break 1.1580 and forms another rejection, sellers may attempt to push price back into the support area. A confirmed breakdown below 1.1500 would invalidate the current bullish structure and could shift the market toward a broader bearish correction. For now, long positions remain favorable while price stays above the channel’s lower boundary, with bullish continuation dependent on overcoming the 1.1580 resistance level.
That's the setup I'm tracking. Thank you for your attention, and always manage your risk.

GOLD → Distribution phase. Focus on 4150...FX:XAUUSD is trading at a one-and-a-half-week high, supported by a weaker dollar and growing expectations of Fed policy easing. More news ahead...
US PPI inflation showed signs of slowing (2.7% y/y). Retail sales and consumer confidence were weaker than expected. The probability of a Fed rate cut in December rose to 85%. Fed members (Williams, Waller, Miran) supported the possibility of easing
However, progress in Russia-Ukraine negotiations is limiting growth
Today, attention is focused on data on jobless claims and durable goods orders
The combination of soft monetary policy, geopolitical risks, and structural demand from the Central Bank creates a favorable backdrop.
Resistance levels: 4156, 4211
Support levels: 4146, 4111
Gold continues to recover after breaking out of consolidation and holding above 4110. Focus on the next trading range (consolidation) of 4156 - 4111. If the bulls keep the price above 4146 - 4156, the next target could be 4211 - 4245.
Best regards, R. Linda!

EURUSD Buyers Defend Support — Targets 1.1600 Resistance RetestHello traders! Let’s break down the current EURUSD structure. EURUSD is trading within a broad ascending structure, finding strong support at the Buyer Zone (1.1500–1.1510), which aligns with both the Support Level and the lower boundary of the rising channel. This area has acted as a key reaction point multiple times, confirming the presence of strong buyers and forming the base for several upward impulses. Earlier, the pair broke out of the descending triangle structure, retesting the former Seller Zone before continuing lower. After reaching the channel support, EURUSD formed a local bottom and started to grow, respecting the trendline and creating higher lows. A fake breakout occurred near the mid-channel resistance, where buyers quickly returned, signaling continued demand. Currently, EURUSD is approaching the Resistance Level at 1.1600, which also serves as the first major take-profit area (TP1). This zone has previously caused corrective moves and remains the main barrier for buyers. If the pair maintains momentum and stays above the Buyer Zone, I expect a bullish push toward TP1 → 1.1600, where sellers may again attempt to hold resistance. A confirmed breakout above 1.1600 would unlock a path toward higher levels within the ascending structure. However, if EURUSD breaks below 1.1500 and fails to hold the Buyer Zone, the bullish scenario becomes invalid. In that case, the price may revisit deeper support levels and potentially exit the rising channel. For now, the structure remains moderately bullish, with buyers dominating as long as the pair trades above demand and respects the ascending support line. Please share this idea with your friends and click "Boost" 🚀

TCS 4 hr chart view | Channel line | reaction @ 1.618"TCS - 4-hour view: Price is reacting to the downside from the top of the channel, as well as the short-term 1.1618 extension, where many moves tend to temporarily reverse. I’m watching for the next pullback to see if it can hold the symmetry and break higher, or if it will break the symmetry to the downside. NSE:TCS Chart link: i.imgur.com

GOLD → Psychological level retest before growth FX:XAUUSD breaks through consolidation resistance and renews its high to 4155. As part of a minor correction, a retest of 4100 may form and a battle for key support...
The probability of a Fed rate cut in December has risen to 81%. Fed members (Williams, Waller, Daly) supported the possibility of easing this year.
Progress in negotiations between the West and Ukraine with Russia reduces demand for defensive assets.
Gold remains sensitive to inflation and retail sales data. Strong figures could adjust rate expectations and limit growth, while weak data would support the bulls.
Technically, a retest of the 4110-4100 zone is forming. If the bulls hold their ground above this level, a new trading range of 4100-4150 could form.
Resistance levels: 4155, 4211
Support levels: 4111, 4100
The importance of the 4100 zone is that it is an area of imbalance and breakeven, a consolidation boundary, as well as a psychological level. Accordingly, the reaction to this area should be aggressive. If the reaction is weak, the price may be dragged below 4100. Otherwise, I expect consolidation above 4111 and further growth to 4155 (possibly to 4200).
Best regards, R. Linda!

BNBUSDT → The hunt for liquidity before the decline BINANCE:BNBUSDT.P breaks through the 880 support level as part of a global downtrend and updates its low to 790. Fundamentally and technically, the situation is weak...
Bitcoin and the cryptocurrency market as a whole are in a global downtrend. Within the trend, countertrend corrections are forming as a “hunt for liquidity” before the decline continues...
After updating its low to 790.9, BNB is forming a pullback, the target of which may be the resistance area of 879-888, which acts as a break-even zone (area of interest for MM). A false breakout could trigger a decline of 1/2, 2/3 of the current range.
Resistance levels: 879-880, 940
Support levels: 837, 814, 790
A retest of resistance and a lack of bullish potential could trigger a false breakout. Consolidation and a close below 879 could lead to another phase of selling and a correction to 837-814.
Best regards, R. Linda!

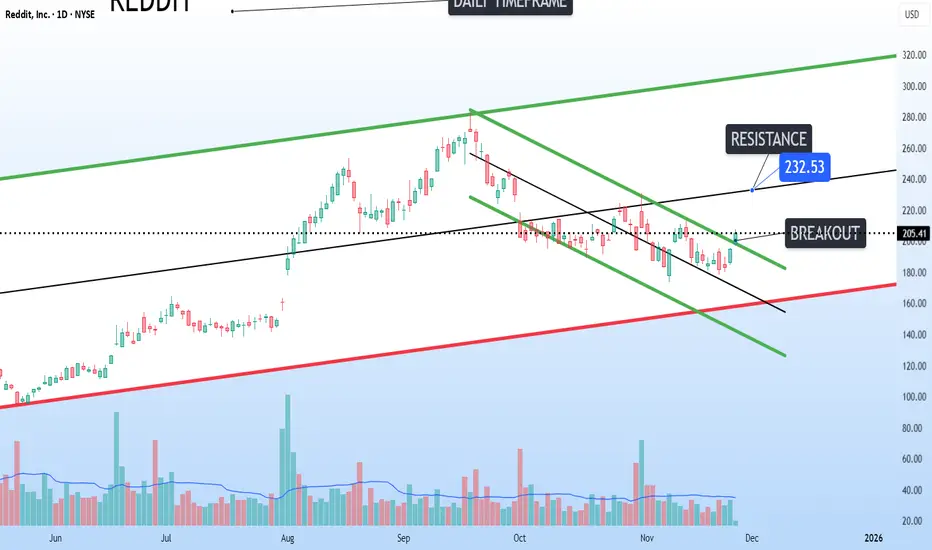
Breakout of local descending channelReddit NYSE:RDDT : The breakout from the local descending channel targets $232 before resistance, which is the mid-range of the ascending channel.
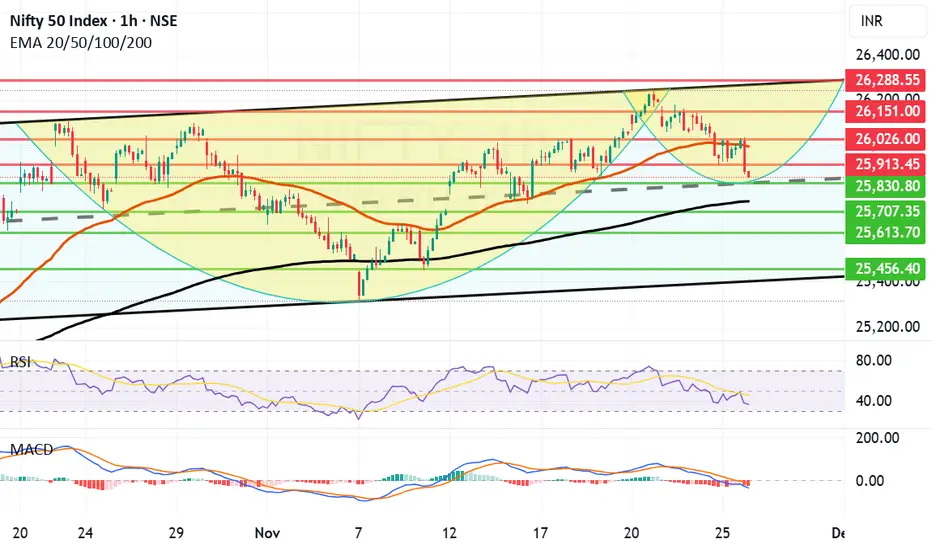
Relentless Profit Booking brings Nifty Further down. What next?The fall in Nifty continued today as again there was again profit booking. However the candles formed in hourly chart indicate that may be a temporary bottom is nearby. The supports nearby are at 25830, 25751 (Father line support, Major Support), 25707, 25613 and finally 25456. The resistance on the upper side for Nifty are at 25913, 25026, 25151 and finally 25288 which can be a new ATH and channel top resistance. (This will be tough to cross.)
The candle still is little bit negative to neutral and MACD is also yet to take a proper turn towards Bullish reversal so little bit of pain still might be there but you never know today's low of 25857 might also work as reversal point.
Disclaimer: The above information is provided for educational purpose, analysis and paper trading only. Please don't treat this as a buy or sell recommendation for the stock or index. The Techno-Funda analysis is based on data that is more than 3 months old. Supports and Resistances are determined by historic past peaks and Valley in the chart. Many other indicators and patterns like EMA, RSI, MACD, Volumes, Fibonacci, parallel channel etc. use historic data which is 3 months or older cyclical points. There is no guarantee they will work in future as markets are highly volatile and swings in prices are also due to macro and micro factors based on actions taken by the company as well as region and global events. Equity investment is subject to risks. I or my clients or family members might have positions in the stocks that we mention in our educational posts. We will not be responsible for any Profit or loss that may occur due to any financial decision taken based on any data provided in this message. Do consult your investment advisor before taking any financial decisions. Stop losses should be an important part of any investment in equity.
BTCUSD: Bulls Aim for Recovery Toward $92,000 Resistance ZoneHello everyone, here is my breakdown of the current Bitcoin setup.
Market Analysis
BTCUSD continues to move within a clearly defined Downward Channel, respecting both the descending resistance line and the lower support boundary. After a prolonged bearish continuation from the major Range structure seen earlier, Bitcoin broke several intermediate support levels before reaching the Support Zone around $84,000, where strong buyers stepped in. A Fake Breakout below the channel support triggered aggressive buying activity, sending the price back above the Support Zone and forming a short-term recovery structure. From this point, BTCUSD made a corrective bounce and even managed to break above a minor descending resistance, confirming a temporary shift in momentum.
Currently, price is approaching the Resistance Zone near $88,000–$90,000, which aligns with the upper boundary of the Downward Channel. This area has previously generated strong sell-offs and remains the key obstacle for buyers. A clean breakout above $90,000 would signal bullish continuation and may lead to a deeper recovery toward the next liquidity cluster near $92,000–$94,000. As long as BTCUSD holds above the $84,000 Support Zone, the short-term structure supports a bullish correction. However, if price gets rejected from the $90,000 resistance and fails to stay above support, sellers may regain control and push the market back toward the lower channel boundary.
My Scenario & Strategy
From my perspective, BTCUSD maintains a bullish corrective outlook while respecting the Support Zone around $84,000. The first target remains the $90,000 Resistance Zone, which matches both horizontal resistance and the channel’s upper boundary. A confirmed breakout above $90,000 would open the path toward $92,000–$94,000, where the next reaction levels are located. I will look for long opportunities during pullbacks toward the Support Zone or along the rising minor trendline that formed after the fake breakout.
If BTCUSD breaks back below $84,000, the bullish scenario becomes invalid, and a continuation of the major downward trend may follow. For now, price action supports a bullish recovery setup as long as buyers defend the Support Zone.
That's the setup I'm tracking. Thank you for your attention, and always manage your risk.

XAUUSD Ascending Channel Strengthens: Bulls Target $4,130 TP1Hello traders! I want to share my view on the current XAUUSD setup. After a deep corrective move, gold has formed a local bottom around the Support Level at $4,000–$4,030, where strong buying pressure has re-entered the market. As shown on the chart, price is gradually climbing within a well-defined ascending channel, supported by the rising trendline and a parallel upper boundary. Inside this structure, the Buyer Zone has played a crucial role, providing the base for previous impulsive breakouts. Several fake breakdowns below the channel support confirmed the presence of significant demand. After these rebounds, XAUUSD twice reached the Seller Zone and the Resistance Level near $4,130, where it faced clear rejection and rotated back toward the Buyer Zone. Currently, gold is holding above the ascending channel support. If buyers continue to defend the $4,030 level and price remains stable within the Buyer Zone, I expect a move toward TP1 → $4,130, which is the nearest resistance. A clean breakout above this level would open the door for further bullish continuation toward the upper supply area around $4,200–$4,230. However, if the price breaks below the Buyer Zone and drops out of the channel, the bullish scenario becomes invalid, and the market may revisit the $4,000 support area. For now, the structure remains moderately bullish as long as price holds above demand and stays inside the ascending channel. Please share this idea with your friends and click Boost 🚀

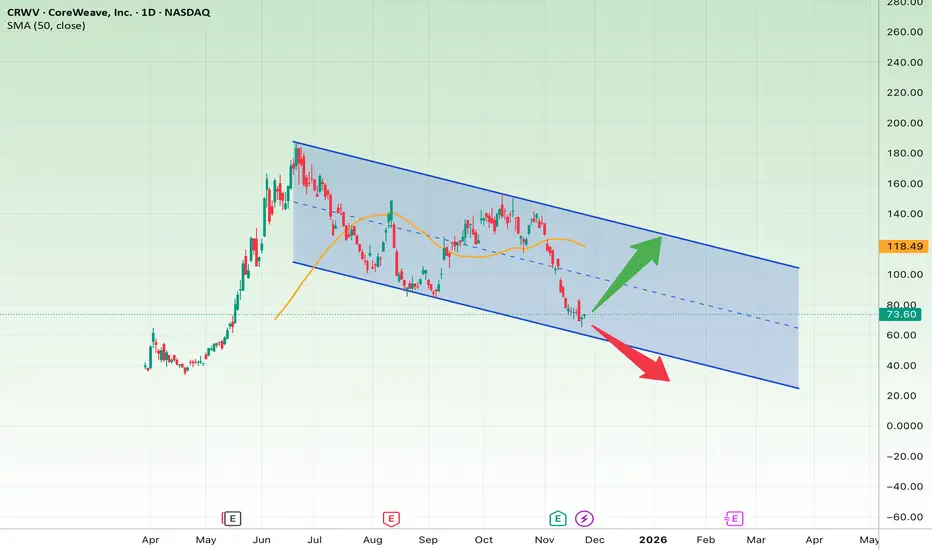
Is CRWV Ready for a Major Rebound—or a Bigger Crash?The chart shows CRWV moving inside a downward trending channel, and the price is now touching the bottom of the channel, where it has shown a mild bullish reaction. This zone can offer a good risk-to-reward long opportunity, but only if the lower boundary holds.
Bullish Scenario (if price holds above the channel bottom)
As long as CRWV stays above $68–$72:
• Target 1: $90
• Target 2: $105
• Target 3: $118 (top of the channel)
Bearish Scenario
If the price breaks below $68:
• Downside target: $50
• Extended bearish target: $30
Stop-Loss
• A confirmed break below $68 with strong bearish volume