XAUUSD: Buyers Target $4,080 Resistance ZoneHello everyone, here is my breakdown of the current Gold setup.
Market Analysis
Gold (XAUUSD) has recently formed a constructive bullish structure after rebounding from the 3,930–3,960 Buyer Zone, which aligns with the lower boundary of the Upward Channel. This demand zone has consistently acted as a strong accumulation area, indicating that buyers are actively defending it. Prior to this rebound, price moved within a Downward Channel, where several fake breakouts occurred — showing that sellers were gradually losing momentum and failing to maintain downside pressure.
Currently, a breakout from the Downward Channel shifted the market tone, and since then, XAUUSD has started forming higher lows, signaling an early trend reversal. The price is now trading back inside a new Upward Channel, and the structure suggests buyers are preparing for a continuation move. At the moment, XAUUSD is approaching the mid-range of the channel, while the next major resistance sits near 4,130, which previously acted as a supply level and point of distribution.
My Scenario & Strategy
The current setup suggests that as long as price remains above the 3,930–3,960 demand region, the bullish setup remains intact. I expect Gold to continue moving gradually toward the 4,080–4,130 resistance zone in the short term. A confirmed breakout above 4,130 would likely signal strong bullish continuation, opening the way for a larger upward move toward 4,200 and beyond.
However, if XAUUSD breaks back below 3,930, the bullish structure would be invalidated, and price could revisit deeper support levels before attempting another upward leg. For now, I prefer to look for long entries on pullbacks within the channel, targeting a continuation toward the resistance levels mentioned above.
That's the setup I'm tracking. Thank you for your attention, and always manage your risk.
Parallel Channel

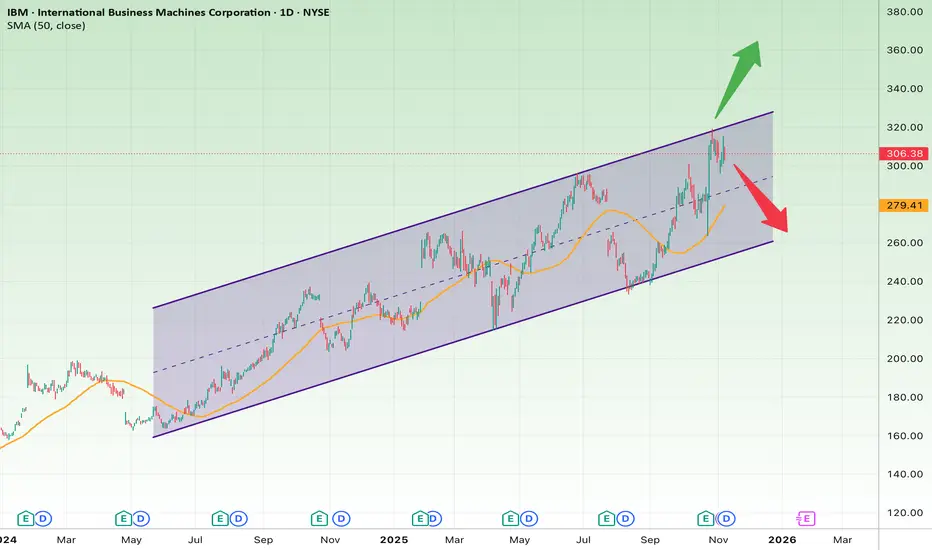
IBM On the Edge of a Major MoveThe daily chart of IBM shows a well-defined ascending channel that has been intact since around April 2024. The price is now testing the upper boundary of the channel, a crucial decision point that could lead either to a breakout continuation or a pullback toward support.
Short-Term Outlook (2–6 Weeks)
IBM is currently hovering around the 305–310 USD resistance zone, right near the top of its rising channel.
The 50-day SMA (~259 USD) is acting as dynamic support.
If price breaks above 310 USD with strong volume, a momentum rally could push toward 330–340 USD.
Bullish Scenario (short-term):
Entry: After a confirmed breakout above 310 USD
Target: 330 → 340 USD
Stop Loss: Below 295 USD
Bearish Scenario (short-term):
If IBM fails to break 310 and drops below 295, a correction toward the midline or the 50-day SMA is likely.
Target: 270 USD
Stop Loss: Above 310 USD
Long-Term Outlook (3–9 Months)
The broader trend remains bullish as long as the price stays within the ascending channel.
The channel floor around 250 USD is a key long-term support level.
If IBM successfully breaks and holds above the channel resistance (~310 USD), the next wave could extend toward 350–370 USD.
However, a breakdown below 250 USD would invalidate the bullish structure and may trigger a deeper retracement toward 220 USD.
Bullish Scenario (long-term):
Target: 350 → 370 USD
Stop Loss: 250 USD
Bearish Scenario (long-term):
Target: 220 USD
Stop Loss: 290 USD
Summary
IBM is at a critical turning point near the top of its long-term uptrend channel.
A breakout above 310 USD could ignite a strong rally toward 340–370 USD,
while failure to break resistance could lead to a short-term pullback to 270–250 USD.
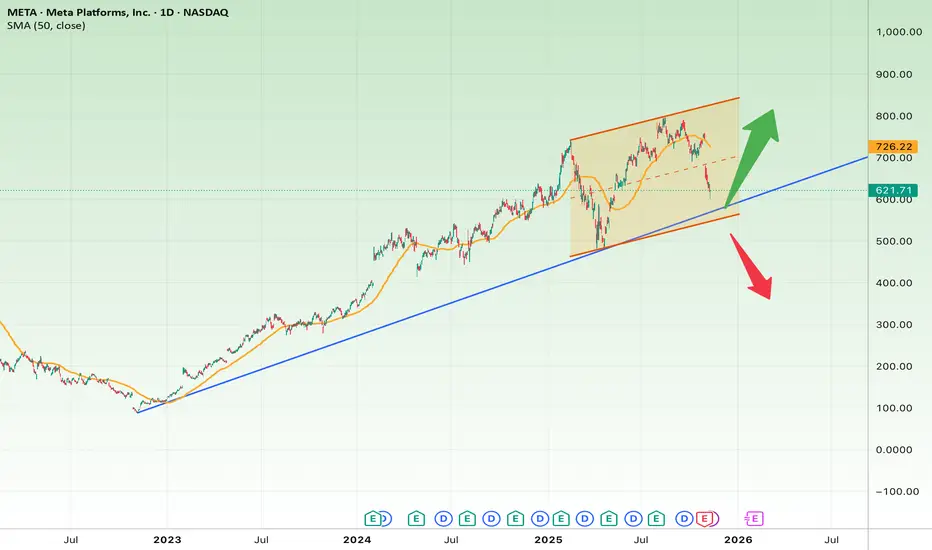
META - Approaching a Key Support ZoneOn the daily chart, META stock has been trading within a rising short-term channel after a strong uptrend from early 2023 to mid-2024. The price is now around $620, approaching the main long-term uptrend line (blue) drawn from the 2023 lows — a critical level that also aligns with the 50-day moving average (SMA50).
Bullish Scenario:
If META holds the $600–$630 support zone and forms a bullish reversal candle, a rebound toward $725 and potentially $800 could follow. This would confirm the continuation of the long-term uptrend.
Bearish Scenario:
If the trendline fails and the price closes below $580, a deeper correction toward $500 is likely. Such a breakdown would indicate the start of a medium-term consolidation phase.
Summary:
The $600 zone is the critical decision point — the line between trend continuation and correction.
As long as META trades above this level, the broader market structure remains bullish.
BTCUSD Tests Buyer Zone — Eyes Break Below $100KHello traders, here’s my current outlook on Bitcoin (BTCUSD). The market continues to trade within a broader bearish structure after breaking down from the previous rising channel. The price failed to hold above the $110,000–$111,000 Seller Zone, where multiple fake breakouts occurred, indicating strong bearish pressure and aggressive selling activity in that region. After the rejection from the Seller Zone, BTC shifted into a descending trend structure, forming lower highs along a clearly defined Resistance Trendline. Each corrective move to the upside has been capped by this trendline, confirming that sellers are maintaining control. Meanwhile, the Support Level around $100,200–$101,000 has acted as a key Buyer Zone, where price has repeatedly paused and reacted, suggesting that buyers are attempting to absorb selling pressure here. Currently, BTC is consolidating just above this Support Zone, but the overall momentum remains bearish. If the price fails to break above the descending Resistance Line, we could see a continuation of the downtrend, likely pushing toward a retest of the $100,200 Support Level. A confirmed breakdown below this level would expose the next downside support levels and reinforce the sellers’ dominance. However, if buyers manage to hold the price above $100,200 and force a breakout above the descending Resistance Line, a short-term corrective recovery could unfold toward the $103,000–$105,000 region. This area remains critical and is likely where sellers may look to re-enter the market based on previous reaction structure. For now, the market structure favors a bearish bias, with the trend down and sellers maintaining stronger control. I am watching for a reaction at the current support — if the level breaks, continuation lower becomes the primary expectation. Please share this idea with your friends and click Boost 🚀

Silver shortPlayed with Elliott tools. I think we get another wave down towards 20 week SMA.
AI commentary follows:
“Operation Silver Slide” 🛝
The plan is simple: wait for silver to puff its chest at $48, then gently remind it that gravity still exists. We’ll ride the wave down like surfers on a metallic tsunami — aiming for $42, where value investors wait with open arms and empty wallets. It’s not personal, just physics (and Elliott Wave theory). Remember: in markets, what goes up five waves must come down three. 🪙📉

Nifty delicately taken the Mother line support what next?Nifty took Mother line support on Friday closed in the negative 17 points at 25492. However it closed 174 above day's low that was 25318. This means 25318 become a major support now going forward. Mother line currently is at 25328. So this 10 point zone is a banger support for Nifty. If we get a closing below 25318 there will be further weakness which can take Nifty towards 24892, Father line 24651 another major support or even mid channel support near 24318. In case 25328 is held the resistances for Nifty going upwards will be high of Friday that is 25551, 25693, 25949, 26155 and finally channel top near 26494. If we reach the channel top it will be a new All Time high.
To know how a Parallel Channel or Mother Father lines and my Mother, Father small Child theory functions or how Fundamental analysis works and how to draw charts or use Techno-Funda analysis do read my book the Happy Candles Way To Wealth Creation rated 4.8/5 on Amazon.
Disclaimer: The above information is provided for educational purpose, analysis and paper trading only. Please don't treat this as a buy or sell recommendation for the stock or index. The Techno-Funda analysis is based on data that is more than 3 months old. Supports and Resistances are determined by historic past peaks and Valley in the chart. Many other indicators and patterns like EMA, RSI, MACD, Volumes, Fibonacci, parallel channel etc. use historic data which is 3 months or older cyclical points. There is no guarantee they will work in future as markets are highly volatile and swings in prices are also due to macro and micro factors based on actions taken by the company as well as region and global events. Equity investment is subject to risks. I or my clients or family members might have positions in the stocks that we mention in our educational posts. We will not be responsible for any Profit or loss that may occur due to any financial decision taken based on any data provided in this message. Do consult your investment advisor before taking any financial decisions. Stop losses should be an important part of any investment in equity.

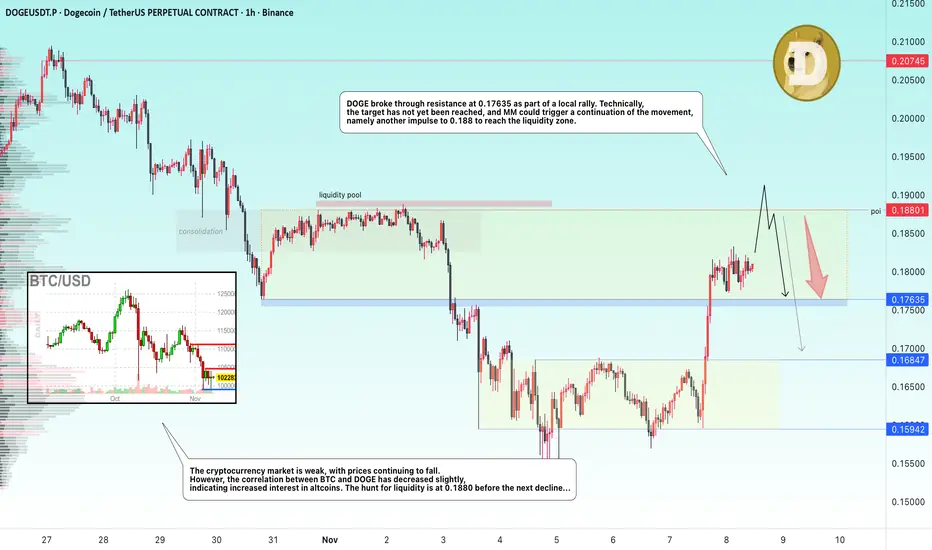
DOGE → The hunt for liquidity before the fallBINANCE:DOGEUSDT rose sharply on Friday. The reason is local news related to ETFs and Musk's tweet (it still works :) ). The growth potential may quickly exhaust itself...
The altcoin is strengthening, breaking resistance and consolidating between two important levels - 0.1763 and 0.188. The trend is bearish, the market is generally weak. I do not yet see any technical or fundamental potential for strong growth or a trend reversal.
In the current situation, DOGE may test the resistance zone of 0.188 due to the liquidity pool formed as part of local consolidation in early November. However, this liquidity pool may become a resistance to growth, which in turn may provoke a reversal and a fall.
Resistance levels: 0.188
Support levels: 0.1763
However, if the market does not allow the price to rise, it is worth watching the support level of 0.17635. Consolidation below this level will confirm the false breakout of the lower level and may trigger a decline.
Best regards, R. Linda!

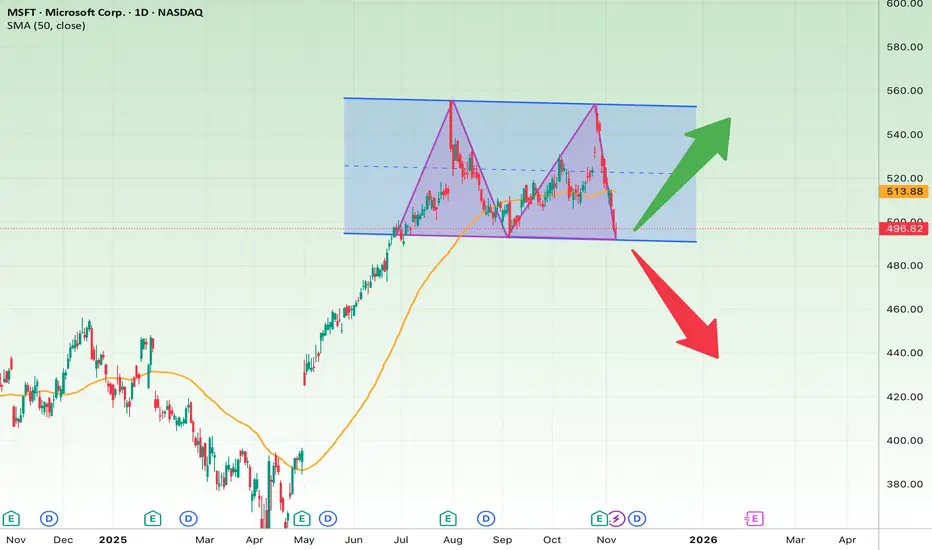
Microsoft on the Edge — Double Top or Beginning of a Rebound?The daily chart of Microsoft (MSFT) shows that the stock is moving within a horizontal range between approximately 495 and 540 dollars, with a potential bearish Double Top pattern forming. The price is currently testing a critical support area that could determine the next major move.
Structure and Trend Analysis
After a strong rally from early 2025, Microsoft entered a consolidation phase with sideways movement. Two clear peaks near 540 dollars indicate a possible Double Top pattern, which is often a signal of a trend reversal. The 50-day moving average, located around 488 dollars, has started to flatten, confirming the loss of short-term momentum. At the moment, the price is trading slightly above the key horizontal support at 495 dollars, which aligns with previous reaction lows.
Bullish Scenario
If Microsoft can hold above 495 dollars and bounce from this level, it will likely retest the upper boundary of the range near 540 dollars. Final confirmation comes if the price breaks above 540 with strong momentum. In this case, the short-term target would be between 525 and 540 dollars, and the mid-term target between 565 and 580 dollars. A reasonable stop loss for this setup would be a close below 490 dollars. A rebound from this area would indicate accumulation and the potential continuation of the long-term uptrend.
Bearish Scenario
If the price breaks below 495 dollars with increased selling volume, the Double Top pattern would be confirmed. In that case, the price could fall toward the 430 to 440 dollar range. The short-term target would be around 465 dollars, and the long-term target near 430 dollars, while the stop loss would be set above 510 dollars. A decisive close below the support zone would confirm a change in direction and could trigger a deeper correction.
Timeframe Outlook
In the short term, over the next one to three weeks, the stock may continue moving sideways between 495 and 520 dollars as traders wait for a breakout or breakdown signal. In the medium to long term, over the next two to four months, a breakout above 540 dollars could lead to a rally toward 580 dollars, while a breakdown below 495 dollars could open the path to 430 dollars, aligning with the Double Top pattern’s projected target.
Berkshire Hathaway is breaking out of channelBerkshire Hathaway NYSE:BRK.B is breaking out of its long descending channel on the daily timeframe.
After months of consolidation, price has finally pushed through the upper boundary near $495, signaling the start of potential upward momentum.
If this breakout holds, the next major target could be around the mid-range near $520 — setting up what could become a powerful trend reversal for one of the market’s strongest giants.

GOLD → The battle for the $4,000 zone. Are the bulls here?FX:XAUUSD is gradually recovering. The price is breaking through $4,000 and trying to stay above the key psychological level. Focus on 4,030–4,050...
Weak employment data, namely a sharp increase in layoffs in October, has heightened fears of an economic slowdown, a decline in government bond yields, and the ongoing correction of AI assets is fueling demand for safe havens.
The probability of a Fed rate cut in December has risen to 69%. The situation is stabilizing somewhat, there is no strong news today, and the market may try to maintain the current backdrop...
Gold retains its upside potential while macro risks remain. The $4000 level is currently acting as key support. Closing the week above this mark will open the way to test $4050.
Resistance levels: 4030 - 4050
Support levels: 4000, 3975, 3956
The dollar and gold are rising, and the inverse correlation is decreasing, indicating that bulls are still trying to keep the market from falling sharply. However, given the lack of drivers, strong news, and a clear fundamental backdrop, I would say that gold is not yet ready to break out of its current range. Consolidation above 4K could lead to a retest of 4030-4050, which in turn could trigger a pullback to local support.
Best regards, R. Linda!

Bitcoin at a Major Decision Zone!The daily chart shows Bitcoin trading within a well-defined ascending channel for several months and now testing its lower boundary around the $100,000–$105,000 zone — a crucial structural support that also aligns with the 50-day moving average (SMA50).
Bullish Scenario:
If Bitcoin holds above $100,000 and forms a bullish reversal candle, a rebound toward $120,000–$135,000 is likely. A confirmed breakout above $120,000 could trigger a new upward wave toward a fresh all-time high.
Bearish Scenario:
If the $100,000 support fails, the next downside targets are around $90,000 and $80,000. A confirmed breakdown below $80,000 would signal a shift to a medium-term bearish trend.
Summary :
The $100K zone represents the dividing line between trend continuation and a deeper correction. As long as Bitcoin stays above $90,000, the overall market structure remains bullish.

BNB Battles the Golden Support Zone!After a powerful rally to around $1,300, BNB has entered a correction phase and is now consolidating near the key $900–$950 support zone. This area is technically significant as it aligns with the 50-day moving average (SMA50) and the upper boundary of the long-term ascending channel, which now acts as support.
In the bullish scenario, if the price holds above $900 and forms a bullish reversal candle, a rebound toward $1,050–$1,200 is likely. A confirmed breakout above $1,200 could trigger the next leg higher toward $1,350–$1,400.
In the bearish scenario, a confirmed breakdown below $880–$900 would likely open the door for a deeper correction toward $750–$800, aligning with the midline of the ascending channel.
From a medium- to long-term perspective, as long as BNB stays above $750, the overall trend remains bullish.
Summary:
The $900–$950 zone acts as the dividing line between trend continuation and a medium-term correction for Binance Coin.

BTCUSD Short: Bearish Rejection Targeting $100.6K Support ZoneHello traders! Bitcoin (BTCUSD) continues to trade within a well-defined descending channel, reflecting sustained bearish pressure after the rejection from the $116,000 Supply Zone. The market previously experienced a Fibonacci Arc retracement followed by a strong sell-off, signaling exhaustion from buyers and the formation of a broader corrective structure.
Currently, we have seen multiple fake breakouts on both the upper and lower boundaries of the channel, suggesting that liquidity sweeps are actively influencing volatility. Notably, price recently tapped the major Demand Zone around $100,600, a level that has historically triggered strong reactions. The sharp wick and immediate recovery from this support indicate buyer accumulation and defense of the zone. A short-term pivot point has now formed near $103,500–$104,000, marking a key decision area. If buyers hold above the $100,600–$101,000 support, a corrective move toward the upper channel boundary becomes increasingly likely.
I expect Bitcoin to retest the $103,500–$105,000 Pivot Resistance Zone, which aligns with the mid-channel level and previous breakout point. If price shows rejection in this region — such as bearish candlestick patterns or weakening momentum — it would provide a favorable entry point for short positions. A break and hold below $100,600 would strengthen bearish momentum and may trigger a continuation toward $98,000. However, if the price breaks and closes above $105,200, the short setup becomes invalid, as this would signal a potential shift in structure and a move toward $110,000. Manage your risk!

Should we expect a deep pull back?with the paraller channel up perfectly alligned we see a pull back with perfect paraller channel regression touched resistance 2 times. will this third touch reverse for deeper pullback?

GOLD will rise in the coming weeks.GOLD has a stable week and should be making it's move back up in the next couple of weeks.

BTCUSD: Falling Wedge Reversal in Play Toward 106KHello everyone, here is my breakdown of the current Bitcoin setup.
Market Analysis
Bitcoin (BTCUSD) has recently shown signs of recovering bullish momentum after rebounding from the 100,600–101,000 Support Zone, which has acted as a key demand region during previous tests. The market experienced a fake breakout below the wedge support line, but buyers quickly stepped back in, pushing the price back inside the structure — a classic indication of seller exhaustion and accumulation interest.
Currently, BTC is trading inside a falling wedge pattern, which is typically considered a bullish reversal formation. The recent bounce from the lower boundary suggests that buyers are attempting to regain control, especially after the sharp decline from the 113,700 Resistance Zone. The price is now gradually approaching the mid-range of the wedge, signaling a potential continuation toward the upper resistance line.
My Scenario & Strategy
If Bitcoin holds above the 100,600–101,000 support, the bullish scenario remains valid. I expect the price to gradually move toward the 104,000–106,000 area as the next short-term target, aligned with the wedge resistance line. A breakout and confirmed hold above the wedge resistance would likely signal a trend reversal, opening the door for a larger continuation toward the 113,700 resistance zone, and possibly beyond.
However, if BTC loses the 100,600 support again and closes below the wedge, this would invalidate the bullish setup and could trigger a deeper move toward 98,000 before a new structure forms.
That's the setup I'm tracking. Thank you for your attention, and always manage your risk.

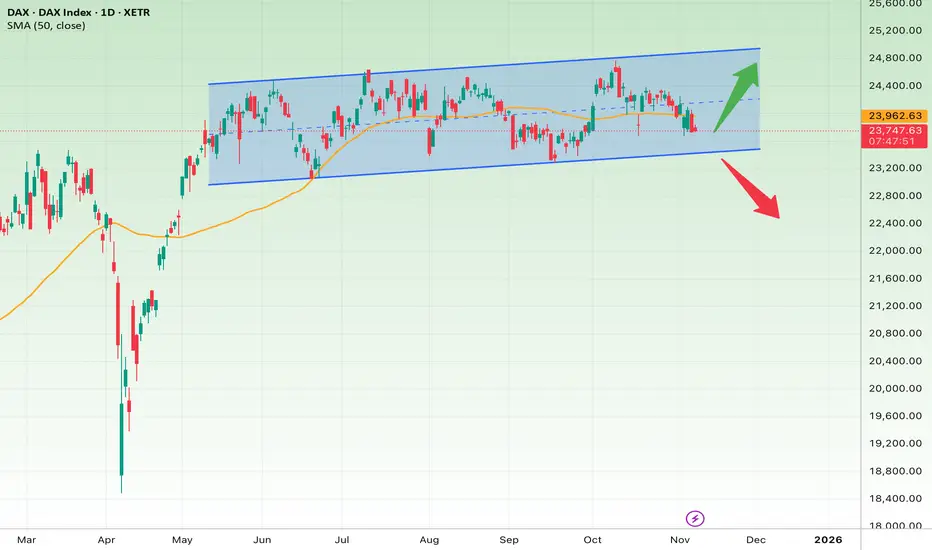
DAX at the Edge – Germany’s Market Faces a Big Decision!The German DAX Index has been trading within a gentle upward channel for several months and is now testing the lower boundary of that channel around the key support zone of 23,600–23,800. This level also aligns with the 50-day moving average (SMA50), which adds extra strength to the support.
In the short term, if the index holds above 23,700 and forms a bullish reversal candle, a rebound toward 24,500–24,800 (the top of the channel) is likely. The stop loss for this bullish setup would be a confirmed breakdown below 23,400.
However, if selling pressure continues and the price closes below 23,400, it could trigger a deeper correction toward 22,800–23,000, signaling a potential trend shift in the medium term.
From a long-term perspective, as long as the DAX remains above 23,000, the broader trend stays bullish, with next major upside targets around 25,000–25,500.
In short, the current area represents the dividing line between a continuation of the uptrend and the beginning of a medium-term correction in the German market.
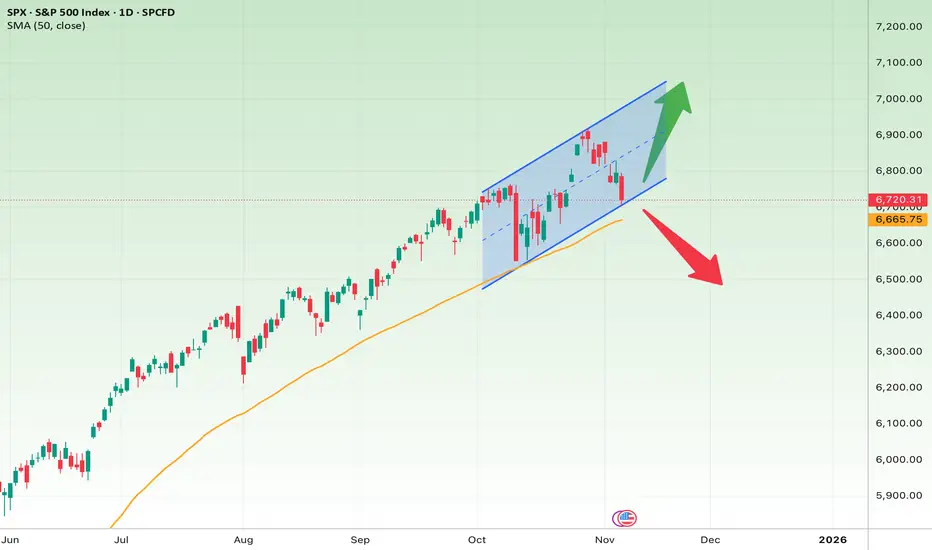
S&P 500 Index (SPX) — Daily Chart AnalysisThe S&P 500 is moving within a well-defined ascending channel on the daily timeframe. After touching the top of the channel, the index entered a short-term correction and is now testing the mid-channel area and the 50-day moving average (around 6,665) — both key support zones.
Short-Term Outlook (next few days to weeks)
If the index holds above 6,660–6,700 and starts to rebound, the next target would likely be the 6,950–7,000 resistance area near the top of the channel.
However, if 6,650 breaks and the price closes below it, a deeper pullback toward 6,450 or even 6,300 could follow.
• Bullish target: 6,950–7,000
• Bullish stop loss: Below 6,650
• Bearish target: 6,450–6,300
• Bearish stop loss: Above 6,800
Mid-Term Outlook (1–3 months)
The broader trend remains bullish, as the 50-day moving average still slopes upward. As long as the price stays above this line, the market structure remains positive.
If the upward channel holds, the next potential targets lie between 7,100 and 7,200.
But a confirmed breakdown below 6,650 could signal a shift in momentum toward a larger correction.
• Bullish mid-term target: 7,100–7,200
• Mid-term stop loss: Below 6,650
Summary :
The 6,660–6,700 range is the key zone to watch:
• Holding above it → continuation of the uptrend toward the channel’s upper boundary
• Breaking below it → possible decline toward the lower channel or deeper correction
In short, this area acts as the line between continuation and correction for the S&P 500.
Gold Forms Higher Low — Potential Upside Toward Resistance LineHello traders, here’s my current outlook on Gold (XAUUSD). Gold has recently transitioned out of a strong bearish phase, where the price moved inside a descending channel and found significant support near the $3,930–$3,950 Buyer Zone. This support zone has proven to be a key reaction level multiple times, with several fake breakouts followed by strong bullish recoveries — confirming the presence of active buyers. After breaking out of the descending channel, the price began forming a higher-low structure, aligning along the Support Line, suggesting that bullish momentum is gradually returning. However, the market remains capped by the Resistance Line, where several strong rejections occurred, indicating that sellers are still defending higher levels. At the moment, Gold is trading between the Buyer Zone and the $4,020–$4,140 Resistance Zone (Seller Zone). If buyers manage to hold support and form another bullish push from the current levels, we could see an upward move targeting the $4,020 area first, and if momentum continues — a potential retest of the key resistance at $4,140. For now, the structure shows accumulation above strong support, suggesting that buyers still have the advantage. Please share this idea with your friends and click Boost 🚀

SLPUSDT the major breakout soon will pump it UPTechnical Outlook: SLPUSDT
As observed, the price of SLPUSDT is currently trading within a defined descending channel, reflecting a clear bearish trend.
However, we are monitoring for a potential breakout above the channel's upper resistance. A decisive and volume-backed break of this resistance could invalidate the current bearish structure.
Such a breakout would likely signal a significant trend reversal, potentially initiating a strong bullish impulse with substantial upward momentum.
We will await confirmation with a daily close above the resistance before projecting specific price targets.
DISCLAIMER: ((trade based on your own decision))
<<press like👍 if you enjoy💚

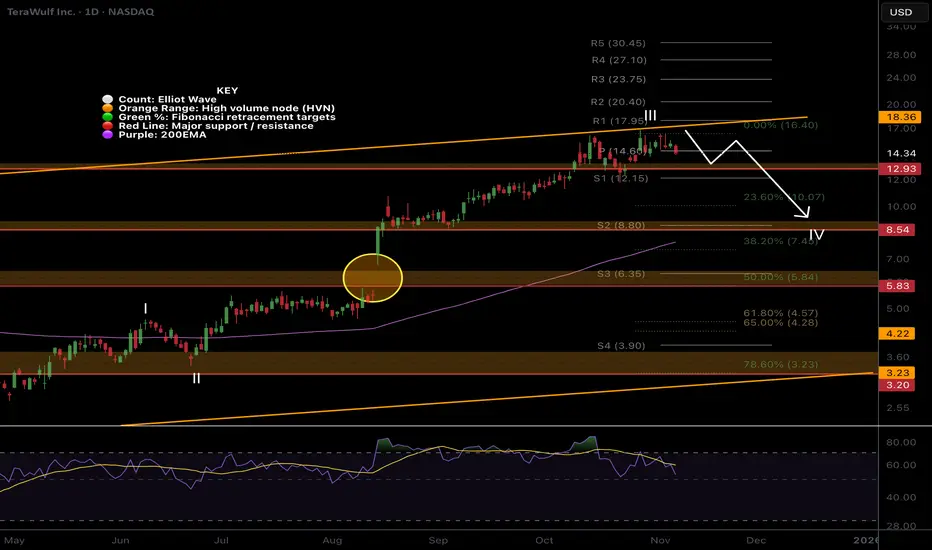
WULF pullback on the cards!Price is struggling at the trend-line boundary on bearish divergence suggesting wave III is complete and wave IV is soon underway.
Due to the size of the rally wave IV could be deep. The usual 0.382 target is down at $8 where it would meet the daily 200EMA.
Daily RSI has printed bearish divergence in overbought.
breaking out above the trend-line could be extremely bullish.
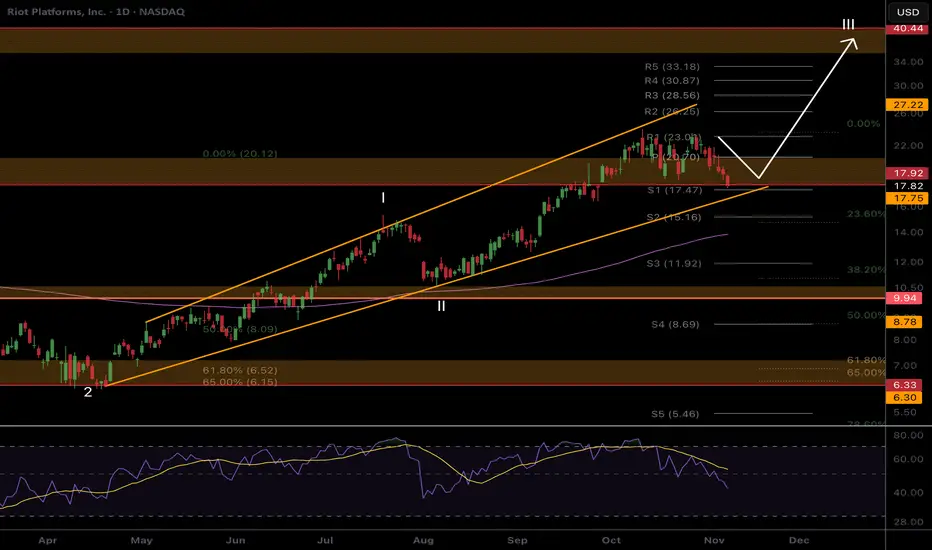
RIOT Respecting the boundariesPrice remains in its uptrend channel demonstrating shallow pullbacks as is characteristic of wave III.
Price is consolidating above support which could lead to a break down below but still within the boundaries of the channel. Daily 200EMA is ascending to meet price and support lines.
Daily RSI has printed unconfirmed bullish divergence at the EQ.
Continued upside has a $40 target at the next High Volume Node.