LINKUSDT → A trap? Grabbing liquidity before the fall...BINANCE:LINKUSDT is forming a correction after a bearish run. A false breakdown of support is triggering a correction before a possible continuation of the decline.
The coin is testing the support of the trading range within the downtrend. The reaction to the false breakdown of support is a pullback to the zone of interest. After a strong downward distribution, a correction to the break-even zone is forming. A false breakout of resistance at 17.45 could trigger a continuation of the decline due to a weak market and a liquidity pool formed above 17.450, which is likely to stop the pullback on the bearish trend.
Resistance levels: 17.450
Support levels: 16.53, 15.77
The downtrend may continue. A retest of resistance may end in a fall and an update of the local minimum, as well as reaching the zone of interest at 15.77.
Best regards, R. Linda!
Parallel Channel

Gold. Found temporary bottom. 2/Nov/25Xauus possible found its temporary bottom with price moving up to 4260 +/-

XAUUSD: Correction Phase Aiming Toward 3,900 SupportHello everyone, here is my breakdown of the current Gold setup.
Market Analysis
Gold (XAUUSD) has shifted from a strong bullish phase into a clear bearish structure after failing to sustain momentum above the 4,130 Resistance Zone. The market initially traded within an Upward Channel, forming a steady series of higher highs and higher lows until buyers lost strength near the top of the range. A breakout from the channel confirmed the end of the bullish impulse, followed by a range formation and multiple fake breakouts, indicating indecision and growing selling pressure. Eventually, the market broke below the range, retested the resistance area, and established a Downward Channel, showing that sellers have regained control.
Currently, Gold is moving within this descending structure, respecting both the upper and lower boundaries of the channel. The Resistance Zone around 4,130 has once again acted as a strong supply area, rejecting price and pushing it lower toward the Support Zone near 3,900.
My Scenario & Strategy
From my perspective, XAUUSD is likely to continue its short-term bearish correction toward the 3,900 support level, which aligns with the lower boundary of the channel. A successful test of this area could trigger a short-term reaction or even a potential reversal if buyers step in.
As long as price remains below the Resistance Zone (4,130) and within the Downward Channel, the bearish sentiment remains dominant. A confirmed breakdown below 3,900 could open the door for a deeper move toward the 3,850–3,820 zone. For now, I remain bearish in the short term, looking for short opportunities from the upper channel resistance with a primary target at 3,900.
That's the setup I'm tracking. Thank you for your attention, and always manage your risk.

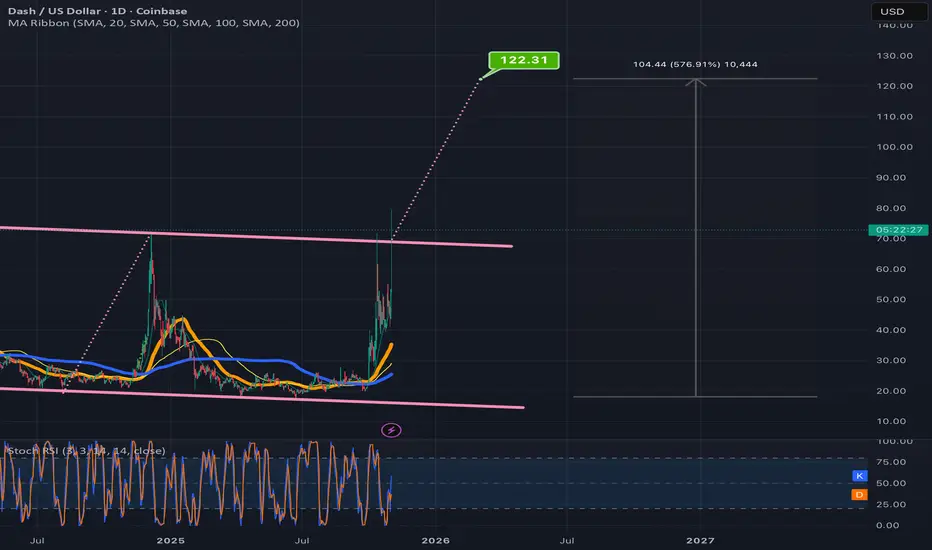
Dash trying to catch back up with ZCash hereUntil recently, Zcash and Dash tended to pump and dump in tandem with eachother, ever since ZCash’s recent big breakout though Dash has noticeably lagged behind. It was hard to say whether it was just delayed reaction on dash’s part or if a true decoupling between the two ahd occurred but it seemed like a least a safe gamble(not financiala dvice) to put a little chunk of money on dash in the interim in case it would do something similar to what Zec has been doing in the enar future. So that’s what I did and now dash is pumping and has gotten above the top trendline of this pink channel. If it validates the breakout at this breach point the measured move target is around $122. From the bottom around $18 thats over a 500% gain. Could always just keep going after that like Zcash has done also but that remains to be seen. First things first is just to validate the breakout of the channel which has not yet happened but a decent probability that it will. *not financial advice*
NZDUSD: Bearish Trend Continues! 🇺🇸🇳🇿
NZDUSD will most likely continue falling next week,
following a confirmed breakout of a support line of a bearish flag pattern
on a daily time frame.
I will expect a bearish continuation at least to 0.5685 level.
❤️Please, support my work with like, thank you!❤️
I am part of Trade Nation's Influencer program and receive a monthly fee for using their TradingView charts in my analysis.

GOLD → Consolidation. The fundamental backdrop is changing...FX:XAUUSD stabilizes after a week-long decline, failing to consolidate above $4050. The market is taking a pause before new impulses. Focus on 4030 and 3980...
Investors are closing positions before the end of the week and month, the reason being the uncertainty surrounding the deal with China and Powell's less dovish stance on policy: a 25 bp rate cut is already priced in. The probability of a December cut has fallen to 72.8% (from 91.1% a week ago). Powell emphasized that decisions depend on data, which is not available due to the shutdown.
The strong dollar (2-month highs) is putting pressure on gold. Weak data from China (PMI fell to 49.0) is reducing demand from the largest consumer.
The balance is tipping towards weak fundamentals...
Resistance levels: 4030, 4085
Support levels: 3982, 3955, 3915
Technically, bears are keeping the market below 4030 - strong resistance. If buyers enter the market (there are currently no fundamental reasons for this) and the bulls are able to break through 4030 and keep the price above this level, we will have a chance for growth. But under the current circumstances, I expect a correction to support before a possible rise.
Best regards, R. Linda!

BTC DominanceBitcoin Dominance gives up 1 year after each halving. You should accumulate altcoin as long as Bitcoin dominance is above 50%.

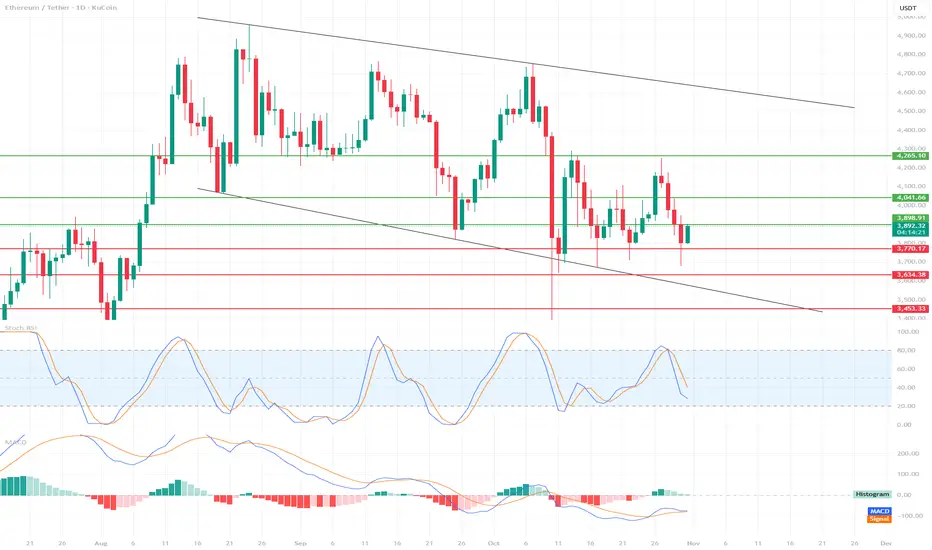
ETH Tests Support – Is This the Beginning of a Rebound?📉 Market Structure
We see a descending channel, bounded by two black trend lines.
Upper Boundary: ~$4,700
Lower Boundary: currently around $3,700, representing strong dynamic support.
The price is currently hovering slightly above the lower edge of the channel, suggesting a possible rebound, but the market remains in a medium-term downtrend.
🔍 Support and Resistance Levels
Support:
$3,770 → currently being tested, crucial in the short term.
$3,643 → next strong support from previous lows.
$3,453 → last line of defense against a steeper decline.
Resistance:
$3,889 → closest resistance, current local ceiling.
$4,041 → strong resistance resulting from prior consolidation.
USD 4.265 → a line that, if broken, could signal a change in the medium-term trend.
📊 Technical Indicators
Stochastic RSI
Located near the oversold zone (below 20), with a slight upward curve.
🔹 Signal: Potential upside move (bounce) in the short term if the %K and %D lines cross upward.
MACD
The MACD line is slightly below zero, but is starting to curve upward and may soon cross the signal line.
🔹 The histogram is starting to decline on the negative side – this is often an early bullish signal (possible change in momentum).
⚖️ Scenarios
🔹 Bullish
If ETH holds above USD 3,770 and the Stoch RSI confirms the rebound, a possible move towards:
3,889 → USD 4,041 → USD 4,265.
A break above USD 4,265 could open the way to USD 4,500+ (upper band of the channel).
🔻 Bearish
Loss of support at USD 3,770 → a signal of weakness.
Then the next downside targets:
USD 3,643, then USD 3,453.
If USD 3,453 breaks, possible tests of the lower band of the channel – even around USD 3,300.
🧭 Summary
Main trend: downward (descending channel).
Short-term bias: neutral-bullish (potential for a rebound from support).
Key level to watch: USD 3,770 – maintaining this level could trigger a rebound, loss = risk of a steeper decline.
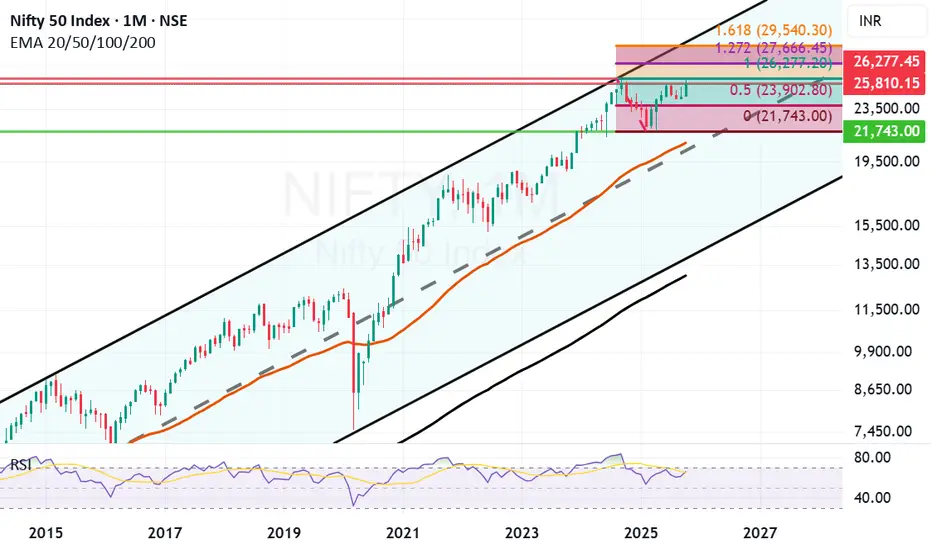
Negative closing today but it was a good monthly closing candle.Despite negative closing for last 2 days of the month it was an overall good monthly candle for Nifty. Previous highest Monthly closing for Nifty was 25810 in September 2024. This month we got a closing slightly below the same at 25722 in October 2025. Once we get a closing above previous all time high in the next month or 2 on in few months time the doors for Next Fibonacci level opens. The next Fibonacci resistance level after we get a closing above previous ATH of 26277 will be at 27666. Golden Fibonacci ratio target in few years time will be 29540.
Very strong Fibonacci support now remains at 23902. Next Fibonacci level support in case of a catastrophic event will be at 21743. Mother line of 50 Months EMA remains at 20853 which is very close to mid-channel support in case there are multiple global or regional situations creating instability.
As of now the shadow of the candle seems positive however there is a chance of little bottom testing for Nifty before we get a new all time high. Sectoral rotations and reshuffling of portfolios of HNIs, MFs and FIIs might also be on card depending on the trade deals and newly emerging tariff scenarios.
Selective stocks which have been giving good results year on year and Quarter on Quarter from Consumption, Defense, Auto, Infrastructure, Banking and Capital Goods sectors including the PSUs themes look good for long term investment currently. While previous superstars of IT, Pharma, Services and other few sectors which lead the previous rally can tend to remain laggard and sideways, specially if the trade deal agreement remain unresolved. If the trade deals with EU and US, specially US goes through even these sectors will fight back and tend to perform.
Overall it was a good month of recovery where Nifty made a comeback from the lows of 24605 to reach 26104 gaining almost 1499 points at one point. Yet it was little disappointing to close below 26K at 25722. Still the positive is that we gained 1117 points this month which is not a bad show at all. Hoping that we get a monthly closing above 26K or previous ATH soon so that doors for next phase of Bull rally can commence swiftly.
Disclaimer: The above information is provided for educational purpose, analysis and paper trading only. Please don't treat this as a buy or sell recommendation for the stock or index. The Techno-Funda analysis is based on data that is more than 3 months old. Supports and Resistances are determined by historic past peaks and Valley in the chart. Many other indicators and patterns like EMA, RSI, MACD, Volumes, Fibonacci, parallel channel etc. use historic data which is 3 months or older cyclical points. There is no guarantee they will work in future as markets are highly volatile and swings in prices are also due to macro and micro factors based on actions taken by the company as well as region and global events. Equity investment is subject to risks. I or my clients or family members might have positions in the stocks that we mention in our educational posts. We will not be responsible for any Profit or loss that may occur due to any financial decision taken based on any data provided in this message. Do consult your investment advisor before taking any financial decisions. Stop losses should be an important part of any investment in equity.
Nikkei 225 Wave Analysis – 31 October 2025
- Nikkei 225 broke round resistance 50000.00
- Likely to rise to resistance level 54000.00
Nikkei 225 index recently broke the resistance area between the round resistance 50000.00 (which stopped the previous impulse wave i in the middle of October) and the resistance trendline of the daily up channel from July.
The breakout of this resistance area accelerated the active impulse waves iii and 5, which belong to the impulse wave (3) from May.
Given the overriding daily uptrend, Nikkei 225 index can be expected to rise further toward the next resistance level 54000.00, target price for the completion of the active impulse waves 5 and (3).

BTCUSD Short: Targeting 108,000 Demand ZoneHello, traders! Bitcoin (BTCUSD) has recently transitioned from a prolonged bullish structure into a corrective phase after facing strong rejection from the 116,000 Supply Zone. The market previously traded inside a well-defined Ascending Channel, forming a steady sequence of higher highs and higher lows — a classic bullish formation.However, after testing the upper boundary of the channel and the Pivot Point, BTC failed to sustain bullish momentum. The breakout attempts above the supply zone turned out to be fake breakouts, showing exhaustion among buyers. Since then, the market has shifted its tone and started to form a descending structure, moving below the Supply Line that now acts as dynamic resistance.
Currently, the price is pushing lower from the mid-range of the channel toward the Demand Zone, located between 108,000 and 107,700. This area has previously served as a strong support base that triggered impulsive bullish reversals in the past.
In my opinion, BTC is likely to extend its bearish correction toward the 108,000–107,700 demand area. A successful test and strong reaction from this zone could mark a potential bullish reversal, confirming demand absorption and the end of the correction phase. However, if sellers maintain control and manage to break decisively below 107,700, the market may open the way for a deeper decline toward the 106,000 level. As long as the price remains below the Supply Line, short-term bearish pressure prevails. I’m currently bearish to neutral, looking for price action signals around the demand area to confirm whether a new upward impulse is about to begin. Manage your risk!

CHF/JPY: Confirmed Intraday Bullish SignalI spotted an additional instance aligning with my breakout trading strategy.
The 📈CHFJPY pair showed a decisive violation and close above a significant intraday horizontal resistance level.
Following this, the price retested the broken structure and subsequently breached the resistance line of a falling parallel channel on an hourly timeframe.
This indicates a strong buying interest.
We can now anticipate an upward movement, with a minimum target of 192.66.

GOLD (XAUUSD): Another Pullback Trade
Gold is testing a major daily resistance that we spotted earlier again today.
It looks like the price may retrace from that one more time.
A bearish breakout of a support line of a rising channel is my
intraday confirmation.
Goal - 3989
❤️Please, support my work with like, thank you!❤️
I am part of Trade Nation's Influencer program and receive a monthly fee for using their TradingView charts in my analysis.

Euro Finds Support — Correction Phase Targets 1.16340Hello traders! I’d like to share my view on the current EUR/USD market structure. After a strong bullish impulse within the ascending channel, the price faced rejection near the Resistance Level around 1.16600, where sellers stepped in, forming a clear turnaround structure. Following that, the pair entered a descending channel, confirming short-term bearish momentum. A breakout below the Resistance Level pushed the price back toward the Buyer Zone, located near the 1.16000 Support Level, where demand previously triggered a bullish correction. Currently, EUR/USD is trading inside a corrective structure just above support. The market has formed a potential reversal setup, suggesting a possible short-term recovery toward the TP1 target near 1.16340. However, as long as the price remains below the Seller Zone, bearish pressure is likely to persist, keeping the market in a consolidation phase. In my opinion, this movement represents a retracement within the broader range rather than the start of a new bullish trend. If the price successfully bounces from the Support Level and confirms higher lows, we may see renewed buying momentum. Otherwise, a breakdown below 1.16000 could open the way for deeper declines. This setup offers a clear short-term trading plan — bullish correction toward TP1, while monitoring reaction around the support area for a potential continuation or reversal signal. Please share this idea with your friends and click Boost 🚀

Gold Rebound: Bulls Target 4,130 ResistanceHello, traders, I want share with you my opinion about Gold. Gold has been trading within a broad technical structure, evolving from a strong bullish phase into a corrective descending channel. The previous uptrend was clearly defined by an ascending channel, which guided the price through multiple impulsive rallies and pullbacks. However, after forming a double-top pattern near the 4320 resistance level, buyers began to lose momentum, resulting in a sharp decline. Currently, the price is trading within a well-defined descending channel, where sellers have been maintaining short-term control. After a deep test of the Buyer Zone around 3920, the market has shown early signs of a potential rebound. The asset is now pulling back from this support area and is approaching the resistance line of the descending channel. In my opinion, this upward correction represents a short-term recovery within a larger bearish context. I expect that the price will rally towards the Resistance Level near 4130–4140, where strong selling pressure may reappear. This area is also aligned with the upper boundary of the descending channel, creating a strong confluence zone. A rejection from this resistance line would confirm the continuation of the bearish structure. The next potential move could be a rotation back down towards the Buyer Zone, or even a deeper retest of the Support Line around 3920. My take-profit (TP1) for the corrective rally is placed at 4108, targeting the upper range of the structure before the next potential reversal. Please share this idea with your friends and click Boost 🚀

USDJPY → Attempt to break through trend resistance FX:USDJPY breaks through the resistance of the bullish pattern and attempts to remain in the long zone. There is a possibility of price growth against the backdrop of the dollar's rise following Powell's speech.
The dollar is recovering after the Fed meeting, and against this backdrop, the Japanese yen is losing ground, breaking through resistance at 153.23. The currency pair is trying to capitalize on the chance for growth.
The Japanese yen is forming a breakout of the resistance of a bullish pattern: an ascending triangle + consolidation on a bullish trend.
If buyers keep the price above 153.23, the market will have a chance to grow to 154.7.
Resistance levels: 153.23, 154.7
Support levels: 151.85, 152.37
On D1, the currency pair is trying to overcome the resistance of a multi-month downward correction. Locally, on H1, there is a breakout of the bullish pattern structure, which indicates interest from buyers. The chances of growth from 153 will appear if the price consolidates above the specified level.
Best regards, R. Linda!

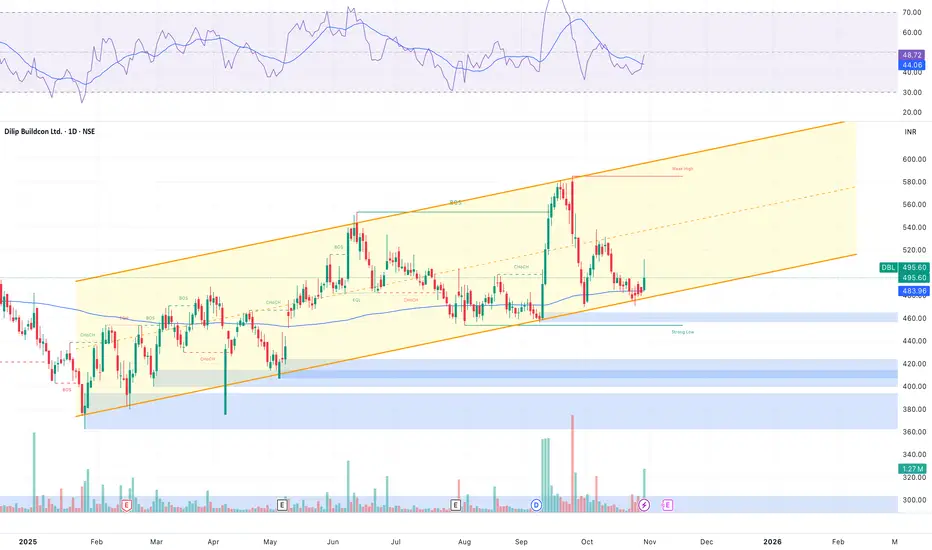
DILIP BUILDCON FOR FASTEST TRADETimeframe: 1D | CMP: ₹495.60 | Change: +2.68%
DBL is currently trading near the lower trendline of a well-defined ascending parallel channel, indicating a potential support zone around ₹480–₹490.
The price has respected this channel multiple times in the past, suggesting strong trendline reliability.
Technical Highlights:
🔶 Ascending Channel – The long-term bullish structure remains intact.
🔹 RSI: Recovering from the 40–45 zone, hinting at a possible reversal from oversold territory
🔹 Volume: Gradual accumulation seen near lower channel support.
Buy Zone: ₹485–₹495
Target 1: ₹545
Target 2: ₹595
Stop Loss: ₹470 (Daily Close Basis)
Bias: Short-term bullish, medium-term accumulation.
Disclaimer:
Not a buy/sell recommendation. I'm Holding @ 490
BTC/USD 1D Chart📉 Trend Structure
Bitcoin is currently in a medium-term downtrend, as evidenced by the descending channel (black trend lines).
Each bounce from the upper edge of the channel has ended in a decline, and recent tests of the lower boundary suggest that the market is respecting this channel as a primary structure.
⚙️ Key Technical Levels
Resistance (green lines):
$123,345 – strong resistance from the previous high and the channel breakout boundary.
$115,179 – local resistance that has been tested several times and rejected.
Support (red lines):
$107,482 – currently tested support level; breaking it could strengthen supply pressure.
$104,929 – next strong support level near the local lows from September.
USD 98,841 – critical support – lower channel zone, potential capitulation or rebound zone.
📊 Volume
Volume is increasing on the declines, suggesting that the current downward move is supported by seller activity.
No significant accumulation volume at the lows – the bulls have not yet taken control.
🔄 Stoch RSI Oscillator
The Stoch RSI is approaching the oversold zone (around 20), but has not yet reached it.
If the %K and %D lines extend below 20 and then cross upward, this will signal a potential technical rebound.
For now, momentum is negative (bearish).
🧭 Scenarios
🟥 Bearish Scenario (more likely at this point)
A breakout of the $106,000 level opens the way to $104,900 and then $98,800.
Continuing the downward movement within the downward channel could lead to the lower edge of the channel around $100,000 in November.
🟩 Bullish Scenario (Bounce)
Defending the $106,000 level and a positive signal from the Stoch RSI could lead to a bounce around $115,000.
Only a breakout of the upper edge of the channel (~117,000–118,000) with volume confirmation would signal a trend reversal.
⚠️ Summary
Trend: Downtrend (descending channel)
Momentum: Bearish
Key level to watch: USD 106,000
Potential rebound area: USD 104,900 – USD 98,800
Stoch RSI: Near oversold → possible short-term rebound

Momentum building but 2 tough resistances ahead before new ATH. Momentum is building in Nifty towards making a new All time high but there are 2 very important resistances to cross before Nifty can scale a new high.
One critical resistance will be 26104 which is the 1 year high. Today again Nifty came close to this level but receded thereafter after making a day high of 26097. If we are able to cross this level the previous ATH of 26277 will act as a ferocious resistance which will not be easy to cross on closing basis. If this will be crossed channel top seems to be near 26424. Trend top for medium term seems to be 26913.
Supports for Nifty at this juncture will be at 25984, 25845 (Mother line support of Hourly EMA), Mid-channel support seems to be near 25694. Father line strong support of hourly EMA seems to be near 25396 and channel bottom seems to be near 25232.
shadow of the candles is neutral but if we get a closing above 26104 it can become very positive.
As a Fresh rally dawns upon us it is mandatory to study and understand investing before you put your hard earned money on equity. I would recommend my book THE HAPPY CANDLES WAY TO WEALTH CREATION at this juncture so that you are able to make a conscious and strong financial decisions while investing in equity.
Disclaimer: The above information is provided for educational purpose, analysis and paper trading only. Please don't treat this as a buy or sell recommendation for the stock or index. The Techno-Funda analysis is based on data that is more than 3 months old. Supports and Resistances are determined by historic past peaks and Valley in the chart. Many other indicators and patterns like EMA, RSI, MACD, Volumes, Fibonacci, parallel channel etc. use historic data which is 3 months or older cyclical points. There is no guarantee they will work in future as markets are highly volatile and swings in prices are also due to macro and micro factors based on actions taken by the company as well as region and global events. Equity investment is subject to risks. I or my clients or family members might have positions in the stocks that we mention in our educational posts. We will not be responsible for any Profit or loss that may occur due to any financial decision taken based on any data provided in this message. Do consult your investment advisor before taking any financial decisions. Stop losses should be an important part of any investment in equity.

EURUSD Long: Buyers Targeting a Move Toward 1.1670 ResistanceHello traders! EURUSD has recently shown a structural shift after forming a strong rejection from the Demand Zone near 1.1560, which also acted as a key pivot area. This reaction marked the end of the previous bearish phase inside the Descending Channel, leading to the formation of a new Ascending Channel — indicating the potential start of a medium-term recovery.
After the price reached the Supply Line, a fake breakout occurred around 1.1670, followed by a brief pullback to retest the lower boundary of the channel. This move trapped early sellers, and the quick rebound suggests that buyers are still active and defending the structure.
At the moment, EURUSD is trading around 1.1640, aiming for another test of the 1.1670 resistance zone, which aligns with both the supply line and the upper boundary of the channel. A successful breakout above this area could confirm bullish continuation, targeting higher levels. However, a strong rejection from this resistance might trigger another short-term correction back toward 1.1600–1.1580, where demand could once again reappear. Overall, the structure remains bullish-to-neutral in the short term, with 1.1670 acting as the critical breakout level to watch. Manage your risk!

GOLD → Price stuck in range after Fed speech FX:XAUUSD continues to battle for the $4,000 zone. The fundamental backdrop has a hint of unpredictability following the Fed's statement. Technically, the range of 3,915-4,015 is developing
Key factors: US shutdown (4th week): Weighs on the economy and the dollar, supporting gold as a safe haven. However, the Fed toughened its tone yesterday: It cut rates by 25 basis points, but Powell ruled out guarantees for a cut in December. Trump and Xi meeting: Agreements reached on soybeans and rare earths, reducing demand for defensive assets.
Gold balances between shutdown risks and monetary policy tightening. Growth is only possible if macro statistics deteriorate or geopolitics escalate.
Resistance levels: 4015 - 4050
Support levels: 3980 - 3960 - 3915
Gold may continue its correction from the 4015 - 4050 zone to 3950 - 3900 if the bulls are unable to keep the price within the upper range. However, if the market continues to buy the metal (there are no fundamental reasons for this yet) and the price closes above 4015, there may be a chance for growth to 4050 - 4085.
Best regards, R. Linda!

200% print for SLERF token? - September 2025A straight forward setup this time. After seven months of trading inside a sideways consolidation area price action and RSI resistance breakouts print. The first resistance is 200% above, which is expected to print by the market top.
Worth getting out bed for? Sure.
But leave the PJs on, this market will send you back to sleep just as quick.
Ww
Disclaimer: This is not financial advice. I'm not a financial advisor. I am, however, an award-winning human being. So there's that.

Bitcoin Approaches Key Resistance — Bulls Eye 117K BreakoutHello traders, I want to share my view on Bitcoin (BTCUSD). The current market structure shows a gradual recovery phase following the previous breakdown from a large range near the 118,000 level. After a sharp decline and retest of the 106,400 support zone, the market found strong buying interest, forming a new ascending channel structure. This setup has been characterized by steady higher highs and higher lows, confirming the presence of short-term bullish momentum. At this stage, BTCUSD is approaching a key resistance level around 116,000, which aligns with both the upper boundary of the current channel and the prior horizontal resistance zone — a region that previously acted as a strong supply area. This confluence suggests that the market could face a short-term pause or pullback before attempting another bullish impulse. My primary scenario anticipates that if the price holds above the support line near 113,000–113,500, buyers may maintain control and push toward the 117,000 target (TP1) — the next logical resistance level and the top of the channel. However, a clear rejection from 116,000 without follow-through could open the door to a corrective pullback toward 110,500–111,000 for another demand test. In my opinion, the structure remains bullish in the short term, as long as the lower boundary of the ascending channel holds. Therefore, I continue to favor a long scenario with a TP at 117,000, expecting a potential breakout or test of the upper resistance. Please share this idea with your friends and click Boost 🚀
