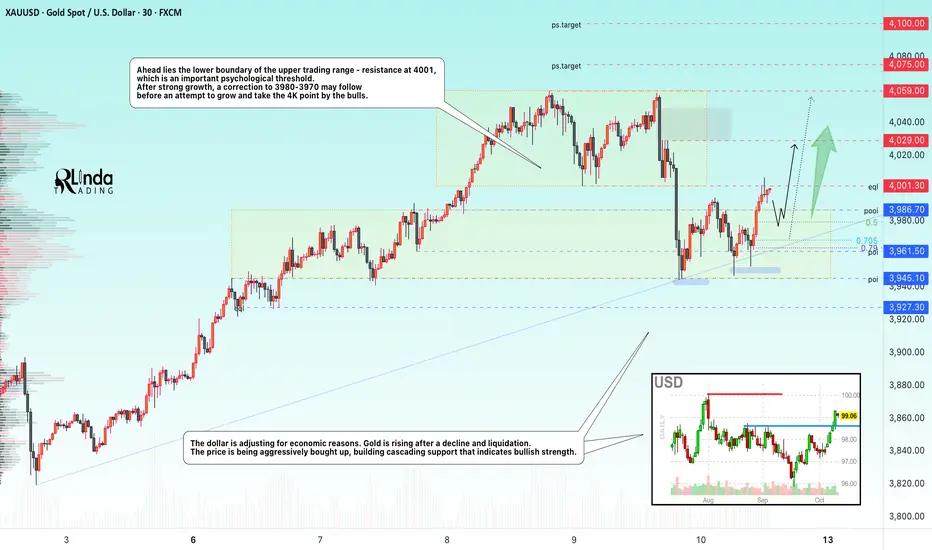
GOLD → Retest 4000. Pullback before a breakout and rise to 4100?FX:XAUUSD , after a sharp sell-off and testing of the 3950 support zone, is aiming to return to the $4000 level on Friday, preparing for its eighth consecutive week in positive territory.
The Senate adjourned for the weekend until Tuesday, postponing a decision on the shutdown. John Williams supported further rate cuts, Mary Daly confirmed her readiness for cuts, despite the fact that Powell did not say anything particularly interesting about policy on Thursday.
The upward trend in gold remains unchanged. The potential for growth to new highs remains, provided the shutdown continues and the Fed maintains its soft policy. The $4000 level remains a key psychological support.
Resistance levels: 4000, 4059, 4075
Support levels: 3986, 3980, 3968
The 4000 zone may prove to be strong resistance, so expect a battle (consolidation or trading range in this zone), during which the price may form a pullback to 3980-3970 before returning to 4K for a breakout attempt.
Best regards, R. Linda!
Parallel Channel
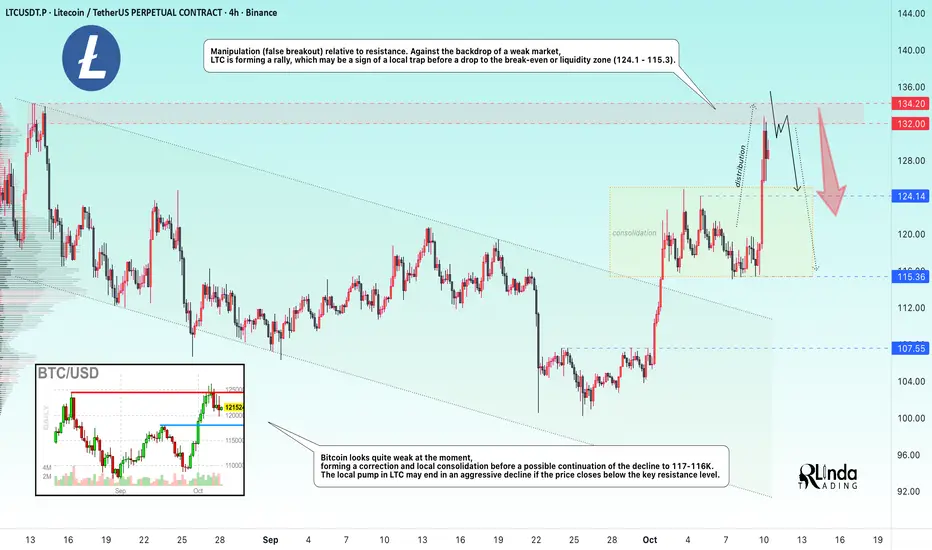
LTCUSDT → False breakout of resistance...BINANCE:LTCUSDT is forming a distribution pattern after local consolidation. The price is testing the resistance zone and forming a false breakout, but there is a but. The cryptocurrency market is in correction...
Bitcoin looks quite weak at the moment, forming a correction and local consolidation before a possible continuation of the decline to 117-116K. The local pump in LTC may end in an aggressive decline if the price closes below the key resistance level.
Manipulation (false breakout) relative to resistance. Against the backdrop of a weak market, LTC is forming a rally, which may be a sign of a local trap before a drop to the break-even or liquidity zone (124.1 - 115.3).
Resistance levels: 132.0, 134.2
Support levels: 124.14, 115.36
A false breakout of resistance, while the entire altcoin market is declining, looks like a hunt for liquidity before catching up with the main market. Accordingly, confirmation of a false breakout of the resistance zone could trigger a drop in LTC.
Sincerely, R. Linda!
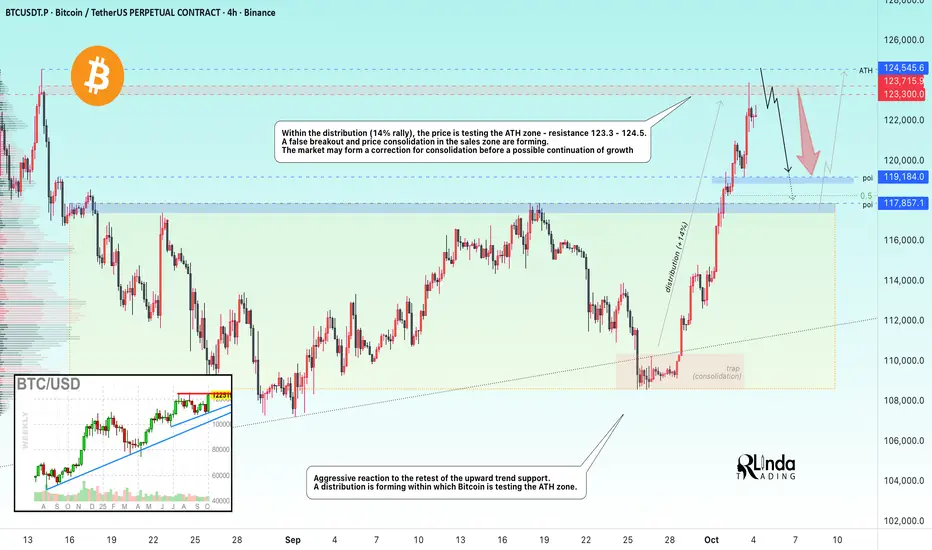
BITCOIN → False breakout of the all-time high zoneBINANCE:BTCUSDT is rising amid the US government shutdown and testing the all-time high zone and resistance at 123.3K - 123.7K. A false breakout has formed and the market is moving into local consolidation.
The price is reacting aggressively to the retest of the uptrend support. A rally is forming, and Bitcoin is testing the ATH zone. As part of the distribution (14% rally), the price reaches an important resistance zone, behind which lies a liquidity pool - 123.3K - 124.5K. However, the growth ends with a false breakout and subsequent price consolidation in the sales zone. To break through such a strong zone, the market needs significant consolidation, which is currently lacking, and the news that caused the price to grow so strongly has already partially exhausted its potential. Thus, the market may move into consolidation, correction to accumulate potential, or wait for the next bullish driver.
Resistance levels: 123.3K, 123.7K, 124.5K
Support levels: 119.2K, 117.8K
I do not rule out the possibility of a retest of 123.7 - 124.5, but technically, on Friday, the market began a sell-off (profit-taking), forming a sufficiently long shadow on the daily candlestick. In the medium term, I expect a correction to the local break-even and imbalance zone of 119K - 117K before another attempt at growth is made
Best regards, R. Linda!
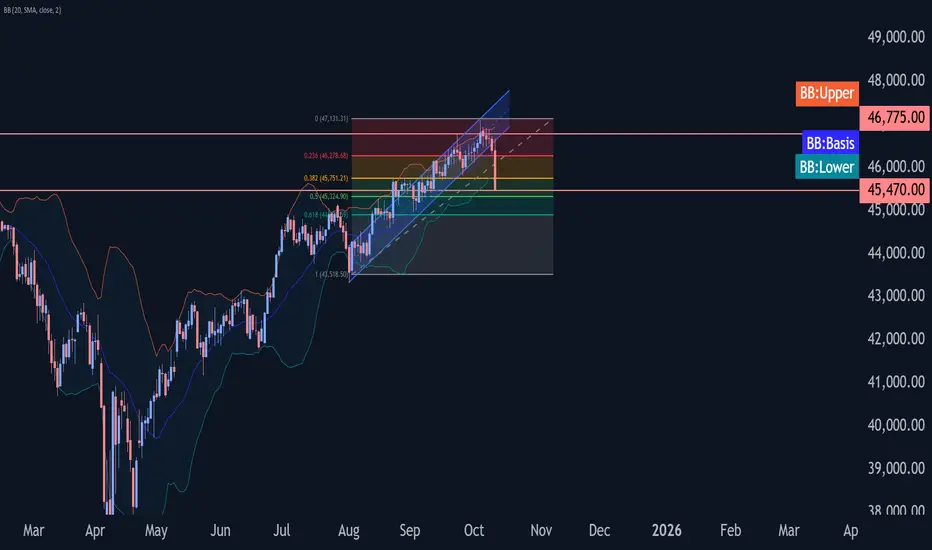
Dow Jones index Wave Analysis – 10 October 2025- Dow Jones index broke daily up channel from
- Likely to fall to support level 45470.00
Dow Jones index recently broke the daily up channel from end of July – which was preceded by the downward reversal from the key resistance level 46775.00 (former monthly high from last month).
The breakout of this up channel from accelerated the active short-term downward correction ii from the start of October from resistance level 46775.00.
Given the strength of the resistance level 46775.00 and the bearish divergence on the daily Stochastic indicator, Dow Jones index can be expected to fall to the next support level 45470.00 (target price for the completion of the active correction (ii)).
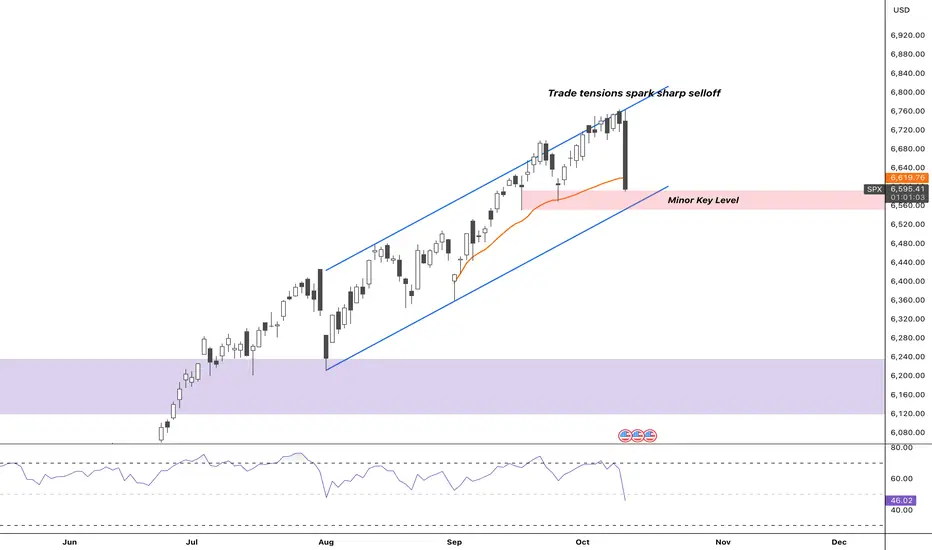
SPX Pulls Back Hard — Testing Channel Support After Trade ShockPost:
SPX saw a sharp reversal after Trump’s renewed tariff threats on China, sparking a broad risk-off move. The index broke sharply from the upper channel, tagging the 21-day EMA and now sitting right on a minor key level within the ascending channel.
Momentum clearly flipped short-term, but the question now is whether there’s enough downside energy to break through both this key level and the channel’s lower boundary — a move that would shift structure from controlled pullback to confirmed trend break.
Key Levels:
• 6,535–6,550: Minor key level + channel support
• 6,750–6,780: Prior rejection zone
• 6,200: Major support if channel breaks
Focus: Watch for confirmation — either buyers step in at channel support, or momentum extends into a deeper structural break.
Gold can Push Towards a New High of 4150Hello traders, I want share with you my opinion about Gold. The market for Gold has been defined by a strong and sustained bullish momentum, which began after the price broke out of a prolonged consolidation range with support from the 3380 buyer zone. This structural shift initiated a new uptrend, with the price action for XAU since being neatly contained within a well-defined upward channel. The asset has shown significant strength, breaking through multiple resistance levels, including the current support level at 3795, and continuing to make higher highs. Currently, the price is trading very close to the resistance line of this upward channel, consolidating after its most recent impulsive move. In my mind, this high-level consolidation is a sign of bullish strength, suggesting buyers are absorbing supply. I expect that the price will make a small corrective movement from these highs before the primary uptrend resumes. I think a successful, shallow pull-back will confirm the underlying momentum and set the stage for the next leg higher. Therefore, I have placed my TP at 4150, a target that aims for a new structural high at the upper boundary of the upward channel. Please share this idea with your friends and click Boost 🚀
Disclaimer: As part of ThinkMarkets’ Influencer Program, I am sponsored to share and publish their charts in my analysis.

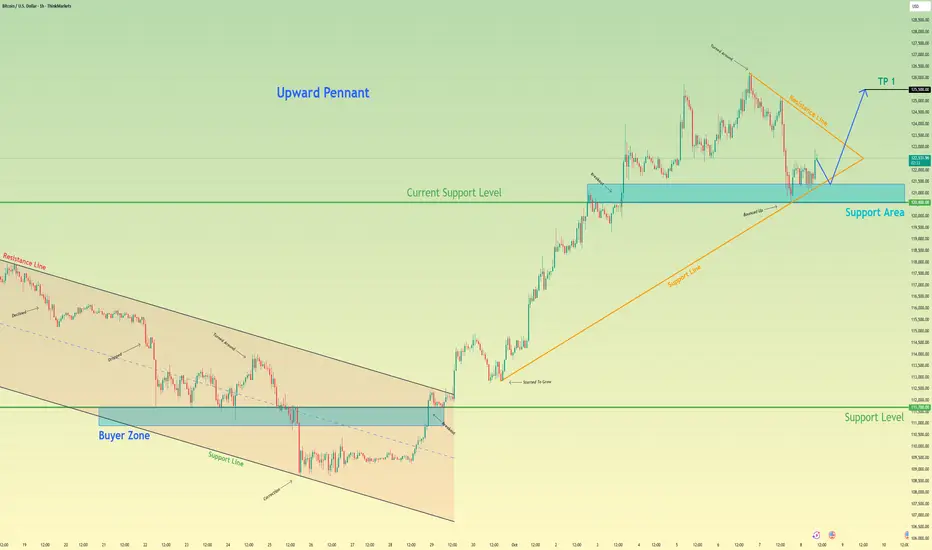
Bitcoin will Bounce From Pennant Support and Rally HigherHello traders, I want share with you my opinion about Bitcoin. The market structure for Bitcoin has recently undergone a major transition from bearish to bullish, following a decisive reversal from the 111700 support level. This shift triggered a breakout from the previous descending channel and gave rise to a new upward pennant pattern, a clear signal of strengthening bullish sentiment. After setting a new all-time high around 126000, BTC has entered a short-term corrective phase, retracing toward the 120600 area, which coincides with both the pennant’s ascending support line and a key horizontal support zone. To me, this pullback looks like a textbook healthy correction within an ongoing uptrend, allowing the market to consolidate before the next move higher. I anticipate that buyers will step in around this level, defending the support and initiating a strong rebound. If the price holds and bounces off the pennant’s support line, it could trigger a bullish breakout, resuming the upward momentum. Based on this outlook, my TP target remains set at 125500. Please share this idea with your friends and click Boost 🚀
Disclaimer: As part of ThinkMarkets’ Influencer Program, I am sponsored to share and publish their charts in my analysis.
XAUUSD: Upward Trend will ContinueHello everyone, here is my breakdown of the current Gold setup.
Market Analysis
Gold has been in a very strong and well-defined Upward Channel. The trend has shown significant strength, breaking through multiple key resistance levels, such as the Support level 2 at 3630 and Support 1 at 3890, on its way up to new highs.
Currently, after testing the resistance line of the channel, the price has entered a natural corrective phase. This pullback is guiding the price down towards the ascending support line, which has consistently acted as the floor and the main trend line for this entire uptrend.
My Scenario & Strategy
I'm looking for this correction to complete as the price tests the ascending support line of the channel. A confirmed and strong bounce from this dynamic support would be the key signal for me that the pullback is over and buyers are ready to resume the rally.
Therefore, the strategy is to watch for this bounce. A successful defense of the channel's support would validate the long scenario. The primary target for the next impulsive wave higher is 4125, which aligns with the upper resistance area of the Upward Channel.
That's the setup I'm tracking. Thank you for your attention, and always manage your risk.

GameStop and Fibonacci: It's About TimeThis is my first attempt at publishing a video on TradingView, so hopefully it works.
I wanted to put together something educational about fib channels and why I like to use them. They're not a silver bullet, but they do tell you a lot about where to expect support and resistance because the chart has a very good memory, and you can see this play out on pretty much any instrument, including cryptocurrencies.
I follow NYSE:GME closer than any other ticker, so this video is about my philosophy on the fib channels that I have been using on the GME chart and talking about on the Echo Chamber Podcast. Hopefully this adds a little more context to that discussion, how the flat price levels are not always the only thing that matters, but taking time-based trends into account can make a big difference in your analysis and understanding of price movement.
Happy to hear people's thoughts on my crayons 🖍️ which color should I eat next?
Since this is a bit of a longer video, here's an AI summary of the content with timestamps:
Introduction 00:00-01:05
I introduce the topic of explaining my TradingView chart, which has many colorful lines. I clarify that I didn't manually draw all the lines, but used Fibonacci channels that only require selecting 3 points.
Explaining Current Chart 01:05-04:33
I show my current GameStop chart, explaining various trend lines and Fibonacci channels. I demonstrate how to adjust the Fibonacci channel points to analyze different price movements.
Fresh Chart Walkthrough 04:33-11:57
Moving to a clean chart, I explain global chart items, including trend lines from major tops and bottoms. I discuss dividend-adjusted vs non-adjusted charts and explain the "Gandalf line" of support.
Fibonacci Channels Explanation 11:57-24:54
I provide a detailed explanation of how Fibonacci channels work, demonstrating how to draw them and interpret the resulting lines. I show how these channels can describe price action across long time periods.
Additional Examples 24:54-33:44
I show more examples of Fibonacci channels applied to GameStop's entire price history. I discuss how these channels can provide insight into potential future price movements and support/resistance levels.
Conclusion 33:44-34:40
I summarize my thoughts on GameStop's current price action in relation to the Fibonacci channels and support levels identified.
Some Quotes
"I find them mathematically interesting." 11:54 - Referring to trend-based Fibonacci tools.
"Math is your friend here. But you don't have to do the math, you just can use tools that will help you." 17:19
"Price is fractal in nature in that patterns are repeating and Fibonacci is everywhere." 17:19
"Things like history repeats itself. It's just a question of when, not if." 24:30
"The point I want to drive home here is that when we start to get a little bit more granular here, and this is why I have lots of crayons on my chart." 28:34
Key Tips/Concepts
Fibonacci channels can be powerful tools for technical analysis, providing insight into potential support and resistance levels.
These channels can sometimes describe price action across very long time periods, even when drawn based on recent price movements with thoughtfully selected endpoints.
The importance of considering price, time, and volume in technical analysis, as demonstrated by the "Gandalf line".
The value of using multiple timeframes and chart types (dividend-adjusted vs non-adjusted, trading hours only vs extended hours included) to gain a more complete picture of a stock's price history. (Editorial note: something I didn't cover in the video, but the difference between log scale and linear scale sometimes will make for an interesting story on trendlines and fib channels too. I prefer to keep my chart in log scale, but will toggle between log and linear occasionally to see if there's something interesting there in the lines already drawn.)
The concept of fractal nature in price movements and how patterns tend to repeat over time.

BTCUSD Long: Small Correction and Pump to new ATHHello, traders! The prior market structure for BTCUSD saw a powerful breakout from an ascending channel, which propelled the price to a new all-time high of 125600. Following this peak, the market has entered a new consolidation phase, forming a high-level range between the new ATH and the key support area around the 120400 level.
Currently, the price is in a corrective phase within this new range. After an initial drop from the highs and a minor bounce, the auction is heading back towards the major support zone located around the 120400 level for what I believe will be a decisive test of buyer strength.
My scenario for the development of events is a successful re-accumulation within this range. I believe the price will complete its correction down to the 120400 support zone. In my opinion, a confirmed bounce from this area will signal the end of the pullback and trigger the next impulsive wave higher, breaking the top of the range. The take-profit is therefore set at 125700, targeting a new ATH. Manage your risk!

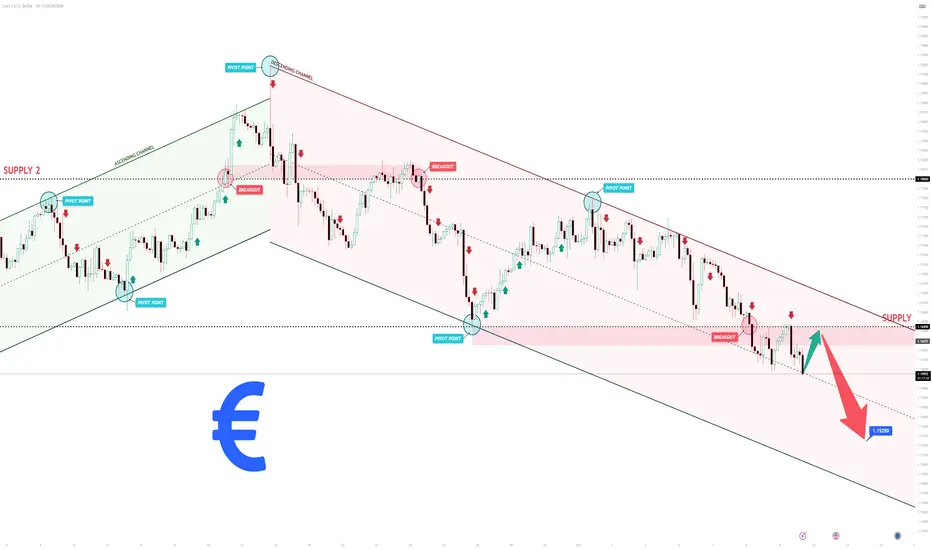
EURUSD Short: Trend Continuation to 1.1525 pointsHello, traders! The prior market structure for EURUSD has shifted to a bearish bias. This occurred after a failed breakout above the 1.1800 resistance level, which concluded a prior ascending channel. The subsequent reversal established the current descending channel, which has been guiding the price auction lower through a series of lower highs and lower lows.
Currently, the price action has confirmed its weakness by breaking below the key horizontal support at the 1.1645 level. After some consolidation below this level, the auction is now making a corrective pullback. This price action is setting up a classic retest of the broken support as new resistance, which is a critical point for the market.
My scenario for the development of events is a continuation of the downtrend. I believe this rally is a corrective retest that will fail upon reaching the 1.1645 resistance level. In my opinion, a confirmed rejection from this area will validate the bearish control and trigger the next impulsive move down. The take-profit is therefore set at 1.1525. Manage your risk.
BTC 1H Analysis - Key Triggers Ahead | Day 53☃️ Welcome to the cryptos winter , I hope you’ve started your day well.
❤️ I sincerely apologize to everyone in the channel — I’ve been down with a cold for several days. Now, let’s dive into the 1-hour Bitcoin analysis.
⏰ We’re analyzing BTC on the 1-Hour timeframe .
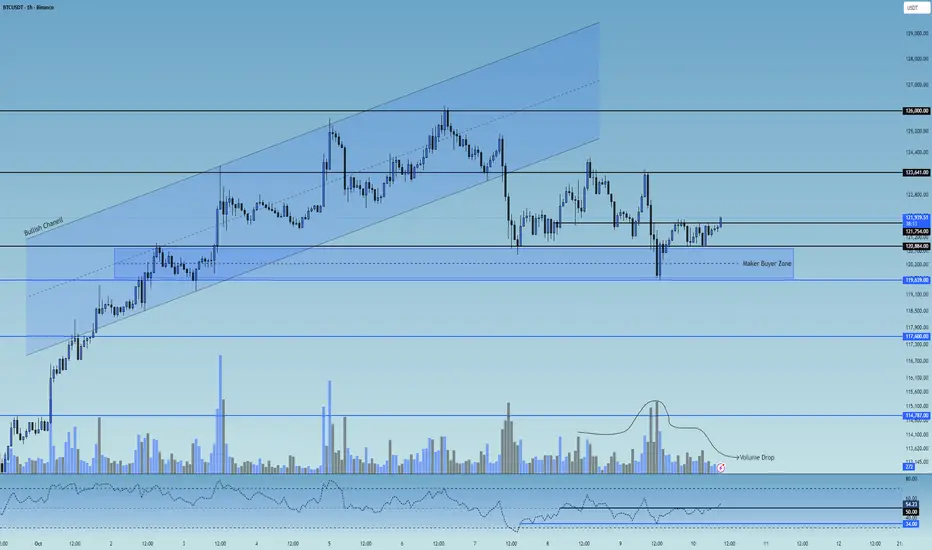
👀 In the 1-hour timeframe, after a strong bullish rally, Bitcoin broke below its ascending channel and moved toward the $121,000 support zone. From there, increased buying volume pushed the price upward, but it got rejected from the $123,600 resistance** and pulled back, creating a long trigger at that zone.
As it moved toward lower support levels, it formed a micro buyer zone between $119,640 and $120,884, where each time price enters this zone, Bitcoin experiences noticeable buying pressure.
🧮 Looking at the RSI oscillator, after ranging below the 50 level, it’s now trying to break above it. The 50 level has become a **strong static resistance, while there’s swing support near 34.
If the RSI breaks out of these marked zones, it could trigger stronger volatility and expand both **short and long trading opportunities.
🕯 The size and volume of recent candles on the 1-hour chart show range-bound movement, weak momentum, and market indecision, forming a **multi-timeframe trading range** where the top and bottom boundaries act as trigger zones.
The **micro buyer zone is where buyers aggressively defend price through market orders, preventing further downside — a reversal candle forming inside this zone is a strong example of that.
▶️ **Today’s economic news related to U.S. monetary policy can impact the market significantly. Since Bitcoin is currently in a small trading range, upcoming volatility spikes from the news could provide short-term setups.
↗️ Risky Long Scenario:
Look for a breakout above the marked $121,754 zone, accompanied by an engulfing candle, **indecision signal, SMA-7 confirmation, and increasing volume in the direction of the breakout — especially if the news comes out risk-on (positive for markets).
📉 Very Risky Short Scenario:
If price breaks below the micro buyer zone and loses the swing RSI support near 33, Bitcoin could enter a deeper correction.
However, note that a drop in Bitcoin’s price often increases its attractiveness compared to other assets, so avoid rushing into shorts.
❤️ Disclaimer : This analysis is purely based on my personal opinion and I only trade if the stated triggers are activated .
The LINK/USDT will probably go lower📉 Trend and Structure
The price is currently trading within a descending channel (yellow lines), which has been in place since late August.
The price attempted to break out of the channel at the top around $23.40, but buyers lacked strength – it was rejected at resistance and fell back below the downtrend line.
Currently, the price is just below the upper edge of the channel and below the 50/200 EMA, confirming that the medium-term trend remains downward.
🔹 Key Technical Levels
Support:
$21.40 – local support, which is currently being tested.
$20.80 – strong support from previous price reactions.
$19.68 – lower boundary of the channel, a very important level for bulls.
Resistance:
$22.20–$22.70 – zone of the 50/200 EMA and previous rejections.
USD 23.40 – the last local high and the point of the false breakout.
USD 24.90 and USD 25.50 – key breakout levels from the channel, paving the way to USD 27–28.
⚙️ Technical Indicators
MACD:
The MACD line has crossed the upside signal → sell signal.
The histogram has turned slightly negative, indicating a loss of upward momentum.
RSI (14):
Currently around 51, with a slight downward slope.
Neutral, but with a strong upside – a drop to around 40 is possible before the bulls attempt a rebound.
🧭 Scenarios
🔻 Bearish Scenario (more likely)
If the price remains below $22 and the channel is not broken, a further decline to $20.80 is possible, or even a test of the lower band of the channel at $19.70.
Confirmation will be a close of the 4-hour candle below $21.40.
🔺 Bullish Scenario (less likely at this time)
If the bulls reclaim $22.70–$23.00 and close the 4-hour candle above it, a breakout from the channel could occur.
The targets will then be $23.40, $24.90, and $25.50, respectively.
Increased volume and confirmation on the MACD (bullish cross) are required.

EURUSD 4H – Testing Strong Demand ZoneFX:EURUSD
Structure | Trend | Key Reaction Zones
Market remains in a downtrend channel, but price is now approaching a strong demand zone near 1.1570–1.1600.
The falling wedge structure suggests potential bullish reversal soon if liquidity sweeps the lows.
Mid-range resistance lies near 1.1658 and 1.1769.
Market Overview
EURUSD continues to respect its descending structure after rejection from the 1.1870 zone. However, buyers may soon step in as the pair nears a high-demand region, historically known for strong reversals. A clean reaction or double-bottom pattern could trigger a short-term bullish rally back toward mid-zone resistance.
Key Scenarios
✅ Bullish Case 🚀 → Rejection from 1.1570 zone → 🎯 Target 1.1658 → 🎯 Target 1.1769 → 🎯 Extended 1.1870
❌ Bearish Case 📉 → Break below 1.1570 → 🎯 Target 1.1500
Current Levels to Watch
Resistance 🔴: 1.1658 / 1.1769
Support 🟢: 1.1570 / 1.1500
⚠️ Disclaimer: This analysis is for educational purposes only. Not financial advice.

Gold Roadmap After Breaking $4,000 – What’s Next?Gold ( OANDA:XAUUSD ) continued its bullish momentum at the start of the week and even seems to have broken through the key psychological resistance at $4,000 .
Let me first point out that when an asset reaches a new All-Time High (ATH) , Technical analysis tends to become less reliable since there’s no historical price data above that level. However, we still do our best to analyze the market using the available tools .
Currently, Gold is moving near the upper lines of ascending channels and within the Potential Reversal Zone(PRZ) .
From an Elliott Wave Theory perspective , it appears that gold is completing Wave 3 , given the strong momentum it has shown.
That said, Gold likely needs a correction before continuing its uptrend. This pullback could first test the Support lines(First Target) , and in the next stage, possibly reach around $3,963(Second Target) .
Stop Loss(SL): $4,109
Please respect each other's ideas and express them politely if you agree or disagree.
Gold Analyze (XAUUSD), 1-hour time frame.
Be sure to follow the updated ideas.
Do not forget to put a Stop loss for your positions (For every position you want to open).
Please follow your strategy; this is just my idea, and I will gladly see your ideas in this post.
Please do not forget the ✅ ' like ' ✅ button 🙏😊 & Share it with your friends; thanks, and Trade safe.

GBPJPY | Testing Channel Resistance at 208GBP/JPY has rallied sharply amid yen weakness and lingering BoE hawkishness. With Japan signalling continued fiscal support and the BoJ cautious about tightening, yen softness has persisted — but the move now looks stretched into a key technical zone.
Price has tagged the upper bound of an ascending channel that has guided price action since mid-2024. The 208.00–208.50 area aligns with channel resistance and an RSI near overbought territory, suggesting potential exhaustion before trend continuation.
Scenarios:
Scenario A: If 208.00 holds as resistance → potential pullback toward 200.50–198.00 support zone within the channel.
Scenario B: If price closes above 208.50 → breakout confirmation could open the path toward 212.00+ extension highs.
Catalysts:
UK data cooling could reinforce expectations of BoE rate cuts in early 2026, weighing on GBP.
Japanese fiscal expansion has so far pressured JPY, but any BoJ jawboning or intervention hints could strengthen yen and trigger a corrective leg.
Global risk sentiment: a pullback in equities or broader risk-off tone typically benefits JPY, adding confluence for a pause here.

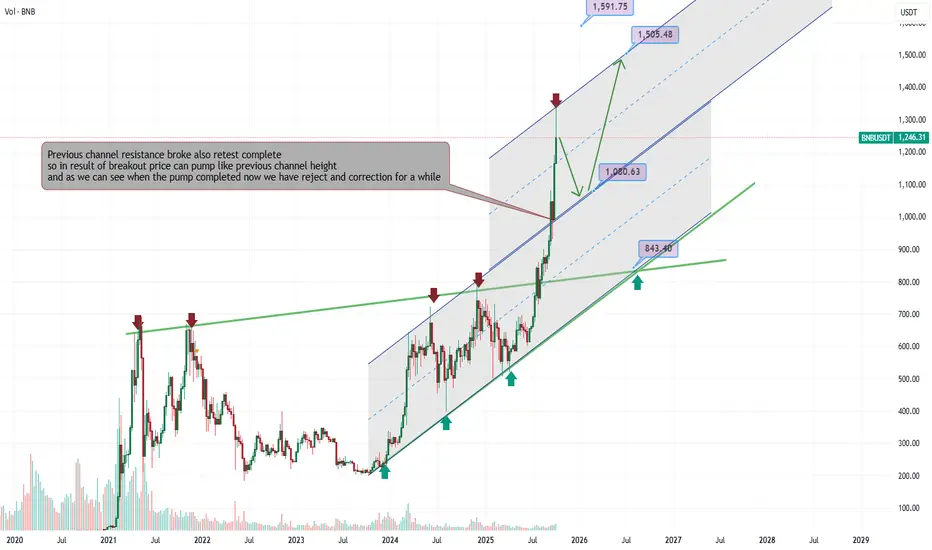
BNB hit the ATH and now can dump to 1000$Previous channel resistance broke also retest complete so in result of breakout price can pump like previous channel height and it hit ATH exactly at that point which we expect.
and as we can see when the pump completed now we have reject and correction for a while is ahead also major support and available one is near 1050$ and it would be previous channel resistance which can be now new channel support after a valid retest.
if the support hold we can expect ATH 1500$ else we can expect 850$.
DISCLAIMER: ((trade based on your own decision))
<<press like👍 if you enjoy💚
EUR/USD – Buyers Holding the Mid-Channel SupportHello guys!
EUR/USD is still moving inside a clean ascending channel on the 4H chart. Price just bounced off the 1.1690–1.1700 support zone, which also lines up with the channel’s midline; a pretty solid area for buyers to step in.
As long as this zone holds, the bias stays bullish. If momentum continues, I’m looking for a move toward the 1.1760–1.1780 area, which is the top of the channel.
If price slips back under 1.1680, then this idea gets invalidated, and we could see a deeper pullback toward 1.1620.
For now, structure is intact, buyers are defending key levels, and the path of least resistance is still up.
Disclaimer: As part of ThinkMarkets’ Influencer Program, I am sponsored to share and publish their charts in my analysis.

Nifty on the verge of a Trendline breakout. Nifty did a great job today by closing above a very important resistance of 25128. Now the major hurdle seems to be near the trendline which is near 25228. Once this range is crossed the next hurdles will be at 25306, 25431 and channel top near 25579. The supports for Nifty are at 25128. Mother line support near 25021 which is also a mid channel support. (Making this area a very strong support). Followed by 24965 (Father line support). If by chance father line support is broken we can see Nifty falling towards 24806 or even 24601 which is the channel bottom support. As of now the shadow of the candle seems to be positive (Green).
To know mover about Mother line, Father line, Mid channel support / resistance, Chanel top resistnace and channle bottom support, trend line support and resistance (To understand the role of Mother line and Father line) or to be able to draw resistances and supports based on historic peaks and valleys you can read my book THE HAPPY CANDLES WAY TO WEALTH CREATION. The book is available in Amazon in paperback or Kindle version and is rated 4.8/5. This book teaches you Techno-Funda investing. (Techno Funda investing means Knowing which are Fundamentally strong companies and investing / booking profits / staying invested in them based on Technical analysis). The book has some more unique features like rating a stock with the help of Happy Candles Number wherein you can give a stock marks out of 100 based on Techincal and Fundamental analysis you have learned by reading it. Thus you can know if the stock is currently investible or not based on the marks it scores out of 100. The book also covers various aspect of behavioural finance. Lot of people who have read the book consider it as a hand book to equity investing. Buy the book you will not be dissapointed as the book is reasonably priced. Search by the key words The Happy Candles Way to wealth creation and you will get it.
Disclaimer: The above information is provided for educational purpose, analysis and paper trading only. Please don't treat this as a buy or sell recommendation for the stock or index. The Techno-Funda analysis is based on data that is more than 3 months old. Supports and Resistances are determined by historic past peaks and Valley in the chart. Many other indicators and patterns like EMA, RSI, MACD, Volumes, Fibonacci, parallel channel etc. use historic data which is 3 months or older cyclical points. There is no guarantee they will work in future as markets are highly volatile and swings in prices are also due to macro and micro factors based on actions taken by the company as well as region and global events. Equity investment is subject to risks. I or my clients or family members might have positions in the stocks that we mention in our educational posts. We will not be responsible for any Profit or loss that may occur due to any financial decision taken based on any data provided in this message. Do consult your investment advisor before taking any financial decisions. Stop losses should be an important part of any investment in equity.

EURCAD – Waiting for the Perfect ConfluenceEURCAD remains overall bullish while trading inside a rising channel.
At the moment, price is approaching the intersection of the channel’s lower trendline and the horizontal structure zone.
That’s where I’ll be watching closely for trend-following long setups, ideally a rejection or reversal confirmation around that confluence area.
As long as this structure holds, the bulls remain in control, and we could see a continuation toward the upper bound of the channel.
⚠️ Disclaimer: This is not financial advice. Always do your own research and manage risk properly.
📚 Stick to your trading plan regarding entries, risk, and management.
Good luck! 🍀
All Strategies Are Good; If Managed Properly!
~Richard Nasr

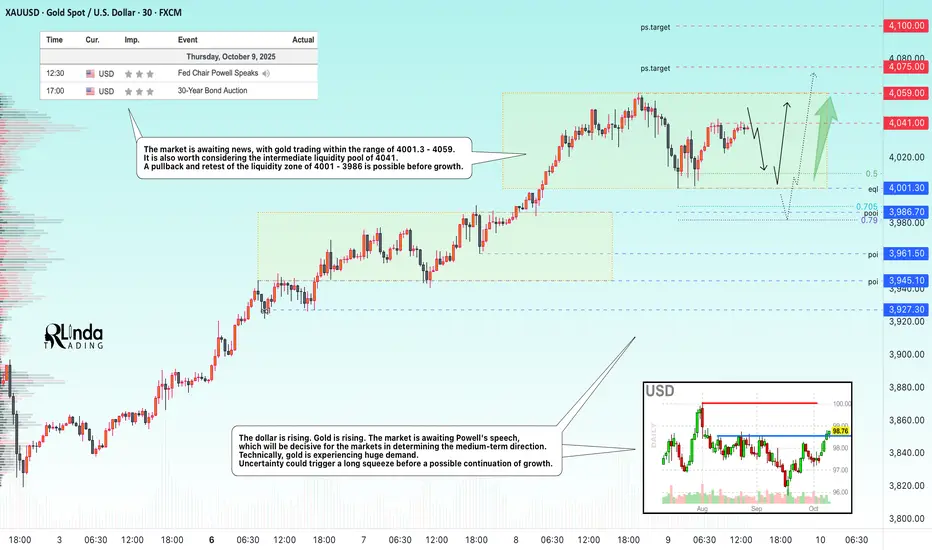
GOLD → The correction will provide a good opportunity for longFX:XAUUSD remains above the psychologically important level of $4,000, having corrected from a record high of $4,059. The market is awaiting Powell's speech, which could set the medium-term tone for the markets...
Key supporting factors: Uncertainty over the shutdown: The phased reopening plan has not yet been approved, which is keeping demand for safe-haven assets high.
Expectations of Fed easing: The probability of a rate cut in October is 100%, and in December is 80%, despite disagreements within the Fed.
As prices rise, the risks of a correction increase, especially against the backdrop of the Fed chair's speech.
Gold remains in a bullish trend. A correction to $4,000 looks like a healthy pause. Further dynamics depend on the Fed's tone and developments with the shutdown — a break below $4,000 is unlikely without new fundamental reasons.
Resistance levels: 4041, 4059, 4100
Support levels: 4001, 3986
Technically, gold has been rising without pullbacks for 35 days. The growth amounted to more than 22%. Accordingly, the market may form corrections, pullbacks, or consolidations within local timeframes. News may provoke such corrective maneuvers before the main movement. I consider the support levels of 4000 - 3986 - 3961 to be areas of interest. A retest or false breakdown could trigger a rebound and growth.
Best regards, R. Linda!
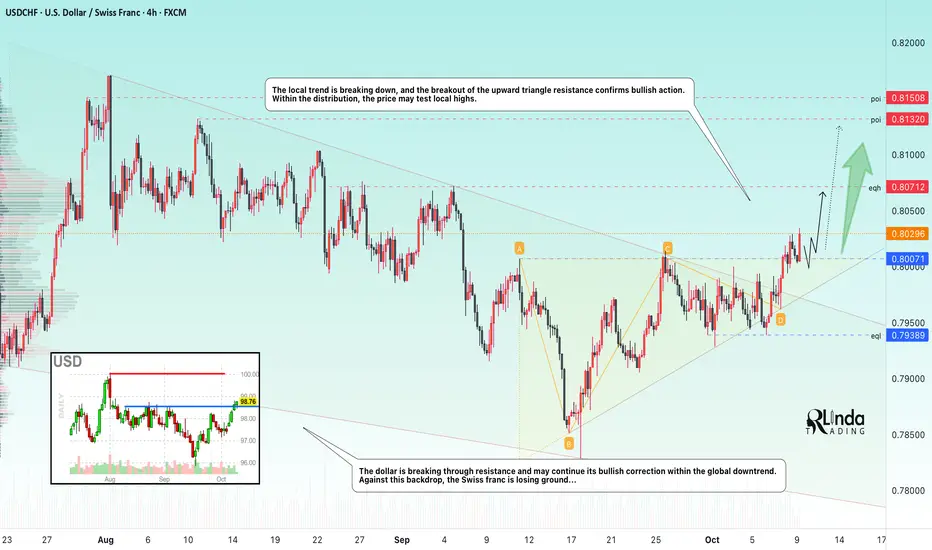
USDCHF → Change in local trend. Confirmation...FX:USDCHF confirms a change in the downtrend and is ready to move into a distribution phase amid growth in the dollar index.
The dollar is breaking through resistance and may continue its bullish correction within the global downtrend. Against this backdrop, the Swiss franc is losing ground...
The currency pair is forming a breakout of the local trend. The breakout of the resistance of the ascending triangle confirms bullish action. As part of the distribution, the price may test local highs.
Resistance levels: 0.8071, 0.8132
Support levels: 0.800
A consolidation of the price above 0.800 may form an intermediate bottom, which will provide support for the bulls before the next run.
Best regards, R. Linda!
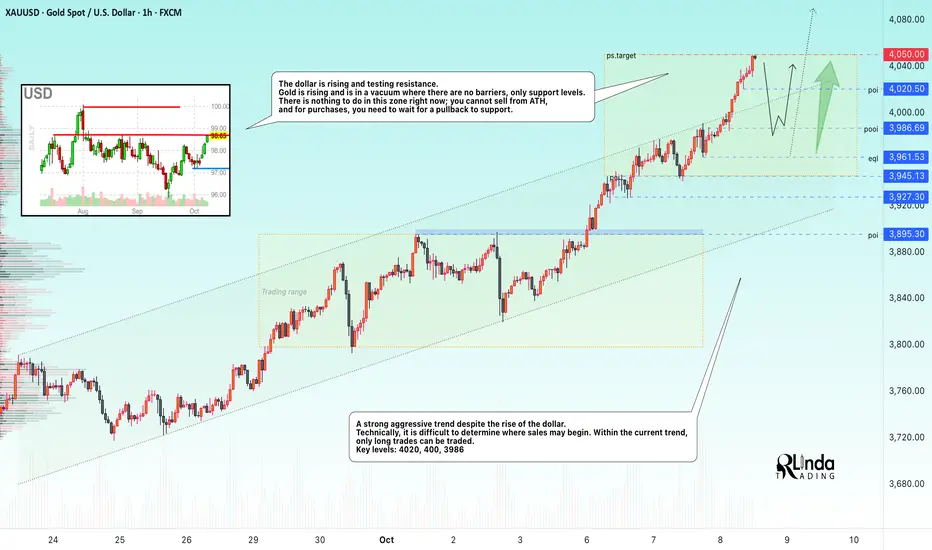
GOLD → Testing 4050 - 4100. Need a pullback to tradeFX:XAUUSD is hitting a new all-time high, testing $4,050, and looks set to reach $4,100. This record growth is linked to falling interest rates and economic risks, which are causing money to flow into hedge assets...
Key drivers: The White House may announce civil service cuts amid the shutdown, which increases uncertainty. The probability of interest rate cuts in October is 95%, supported by the delay in data publication due to the shutdown. Global central banks continue to build up reserves. However, as prices rise, so do the risks of correction. The USD is also receiving support as a safe haven, which may limit further growth in gold.
Resistance levels: 4050, 4075, 4100
Support levels: 4020, 400, 3986
Technically, we need to wait for a slowdown and correction to take a full breath before further movement. I consider the local liquidity zones of 4020 - 4000 - 3986, 3961 to be promising areas of interest. I do not rule out the possibility of sharp shocks in the market, so we need to be prepared...
Best regards, R. Linda!