Apple + The 3 Step Rocket Booster StrategyI know i said i would stop talking about
stocks but i thought about you..
Maybe you are still in the making it stage
Maybe you only have access to forex options
but remember if thats the case dont
trade above x4 margin
Especially if you are dealing with stock
options.
Its because of you i fought hard to
design the Rocket booster
strategy.
This is the strategy i started with
its beginner friendly and
very easy to understand
it has 3 steps. i think the reason it become
so popular is because its very simple
so here are the following 3 steps:
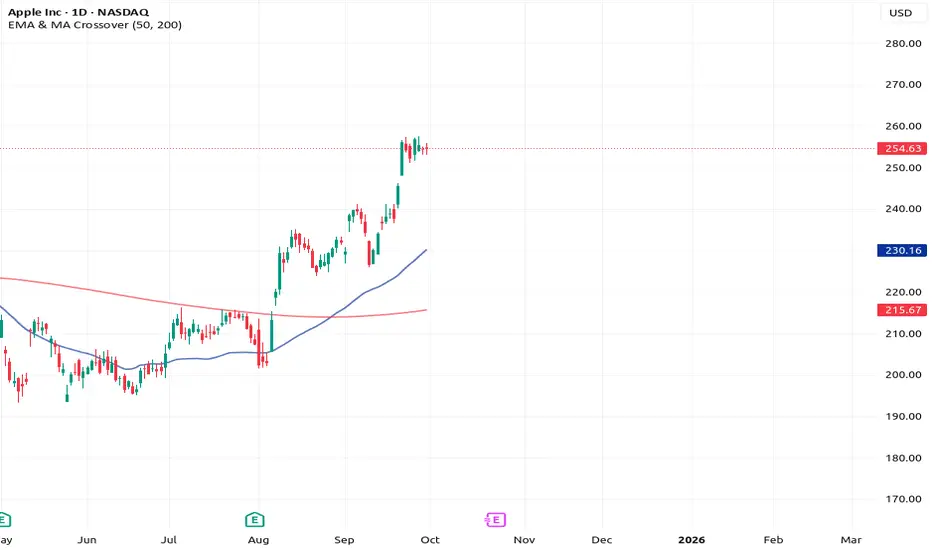
1-The price has to be above the 50 EMA
2-The price has to be above the 200 EMA
3-The price should gap up
The last step is very important for you
to understand because it filters out
the noise in the trading.
How?
Because it has to be trending upwards
on the week and the day to signal
a beginner friendly entry for you.
Look at NASDAQ:AAPL
you can clearly see that its gapped up.
Rocket boost this content to learn more.
Disclaimer: Trading is risky
please use a simulation trading account
before you trade with real money.
Parallel Channel
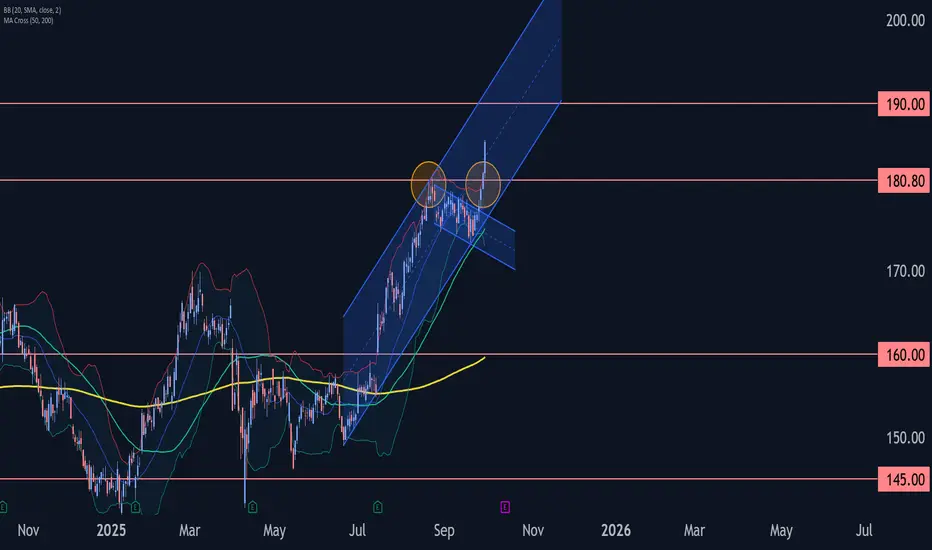
Johnson & Johnson Wave Analysis – 30 September 2025
- Johnson & Johnson broke key resistance level 180.00
- Likely to rise to resistance level 190.00
Johnson & Johnson recently broke sharply above the key resistance level 180.00 (which stopped the previous minor impulse wave 3 at the end of August).
The breakout of the resistance level 180.00 accelerated the active impulse wave 5 of the intermediate impulse wave (3) from April.
Given the predominant daily uptrend, Johnson & Johnson can be expected to rise to the next resistance level 190.00, target price for the completion of the active impulse wave 5.
Aberdeen Group Wave Analysis – 30 September 2025
- Aberdeen Group broke daily down channel
- Likely to rise to resistance level 200.00
Aberdeen Group continues to rise after breaking the resistance trendline of the daily down channel from August (which enclosed the previous medium-term ABC correction (2)).
The breakout of this down channel accelerated the active intermediate impulse wave (3) from the start of September.
Given the strong daily uptrend, Aberdeen Group can be expected to rise further to the next round resistance level 200.00, the breakout of which can lead to further gains toward 205.00.

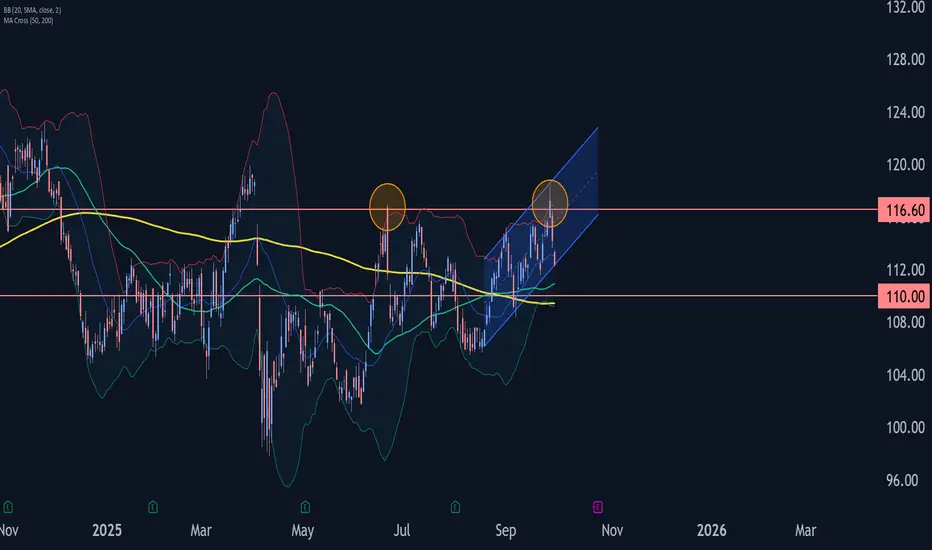
Exxon Wave Analysis – 30 September 2025- Exxon reversed from resistance area
- Likely to fall to support level 110.00
Exxon recently reversed from the resistance area between the strong resistance level 116.60 (former monthly high from June), upper daily Bollinger Band and the resistance trendline of the daily up channel from August.
The downward reversal from this resistance area stopped the (C)-wave of the previous long-term ABC correction 2 from April.
Given the strength of the resistance level 116.60, Exxon can be expected to fall to the next support level 110.00.
NZDUSD → Rebound from support. Focus on 0.5800FX:NZDUSD is undergoing a correction amid a rebound in the US dollar, testing trend support and forming a reversal pattern. The fall in the dollar may support price growth.
The dollar is correcting, which gives the forex market a chance. After retesting the support of the downtrend, the New Zealand dollar is forming a rebound. A reversal pattern and a breakout of resistance at 0.58 will return the price to the trading range, confirming a false breakdown of support and potentially triggering growth.
The global trend is neutral, and locally we have the boundaries of a downward channel. However, a false breakout of trend support could shift the angle of imbalance towards the buyer, allowing the price to rise.
Resistance levels: 0.580
Support levels: 0.5771, 0.575
A breakout of resistance at 0.58 and a close above this level would be a strong signal of readiness for growth. However, before that, the price may test support at 0.5771 (break-even zone).
Best regards, R. Linda!

GBPUSD → Will the bulls be able to maintain the bullish trend?FX:GBPUSD slows down in the 1.334 zone amid a sharp decline. The market is testing trend support against the backdrop of a bullish run in the DXY due to confusing data from Powell...
The dollar continues its countertrend correction and is approaching resistance as part of the rally. A fall in the DXY will resume the growth of currency pairs.
The pound sterling is currently testing trend support and the trading range. The focus is on the 1.334 - 1.337 zone. If the bulls keep the price above this range, it will confirm the false breakdown and may trigger growth within the bullish trend.
Powell has confused the market with his statements and further policy. We have been observing the market's reaction over the past few days...
Support levels: 1.334, 1.3315
Resistance levels: 1.337, 1.346
I do not rule out the possibility of a retest of 1.3315, but a return of the price to the range and consolidation of the price above the 1.334-1.337 zone will confirm the false breakdown and may give buyers hope that this, in turn, could lead to a recovery.
Best regards, R. Linda!

NZDJPY → Consolidation amid a downtrend. What next?FX:NZDJPY is ending its correction and returning to the downward trend. The price is consolidating for a possible continuation of the downward movement...
The price breaks the support of the upward channel (countertrend correction). The movement occurs in a “step” format, which generally indicates weak demand. Clear consolidation boundaries are forming on the chart. The global trend is downward, and the local trend has also resumed its downward movement. Focus on two zones: 86.5 - 86.96. Within the framework of trading strategies, a false breakout of resistance or a breakout of support can be considered with the aim of continuing the decline.
Resistance levels: 86.96, 87.16
Support levels: 86.5
As part of consolidation, MM may form a liquidity trap on the resistance side, and a false breakout may trigger a further decline. However, if the bears increase pressure, the formation of a pre-breakdown base relative to the 86.5 support may trigger a breakout and a continuation of the downward movement.
Best regards, R. Linda!

HUMAUSDT - shiny coin!3d chart showing a breakout of descending channel after 120days of consolidation ... retest is running
patience must be rewarded.
Best regards:
Ceciliones🎯

AUDUSD | RBA Holds but Strikes Hawkish Tone – 0.68 in Sight?
Macro Hook: The RBA kept rates steady but signaled concern over sticky inflation and a resilient jobs market, adding a hawkish tilt despite ongoing economic uncertainty.
Technical Lens: AUDUSD has been firm into the decision, with markets now reassessing downside easing bets. Near-term resilience keeps focus on higher levels, with 0.68 eyed as the key medium-term zone.
Scenarios:
If incoming inflation/jobs data stay firm → AUDUSD may extend toward 0.68.
If softer prints revive easing bets → pullbacks likely as market reprices cuts.
Catalysts: Watch upcoming Australian CPI and labor market data, plus Fed tone on USD side.
Takeaway: 0.68 remains the key decision point for AUDUSD in Q4.

manyuIt seems we are in an ascending channel with a possibility of a reversal and a new high from the channel bottom.

Gold can Bounce From Channel Support and Continue HigherHello traders, I want share with you my opinion about Gold. The market context for Gold has been firmly bullish since the price action reversed its prior downward channel, a move that established the current, well-defined upward channel. This structure has been methodically guiding the price of XAUUSD higher through a clear sequence of higher highs and higher lows, confirming that buyers are in control of the dominant trend. Currently, after recently testing the channel's upper resistance line, the asset is undergoing a healthy corrective phase. This pull-back is guiding the price towards a critical confluence of support, where the ascending support line of the channel meets the horizontal support zone around the 3625 current support level. In my mind, this correction is an opportunity to join the uptrend. I expect that the price will find support on the channel's lower boundary and initiate a new upward rebound. I think this move will carry the price to a new high within the channel. Therefore, I have placed my TP at 3930 points. Please share this idea with your friends and click Boost 🚀

XAU/USD - Bearish MomentumGold gave us a clean 3-Touch reversal pattern followed by a clean 1H retrace candle.
Expecting:
A lower time frame correction to confirm continuation.
Targeting 90% if price breaks impulsively to the downside.
Let price do the work, wait for the correction before entering short.

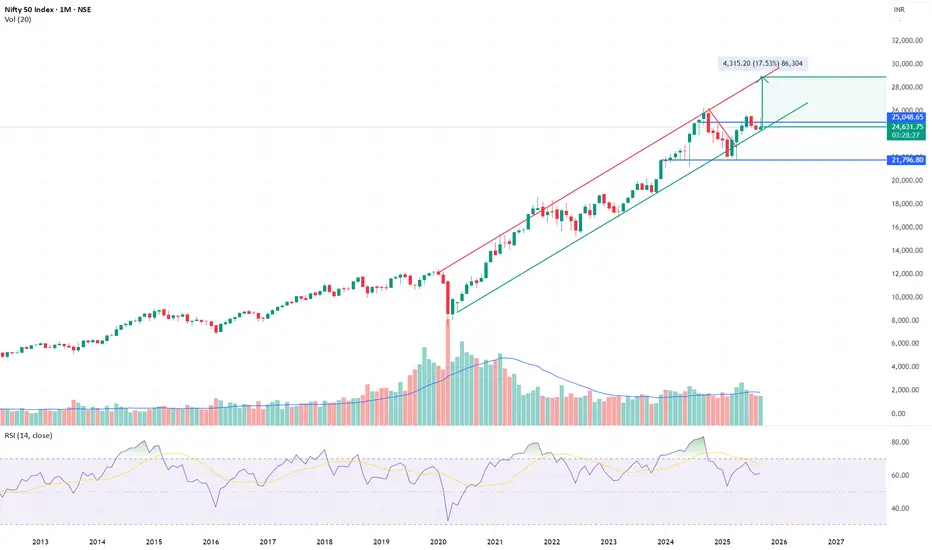
NIFTY 50 – Holding Lower Channel, Eyeing Continuation Above 26kNIFTY is respecting the lower boundary of its long-term upward channel near 24.5–24.6k. This zone remains the key support for the secular uptrend.
Support: 24,000–24,200 must hold to preserve structure.
Trigger: A sustained break above 26,000 would mark continuation of the bull leg, with targets at 28,500–29,000.
Risk: Losing 24k opens room for a deeper slide toward the 21,800 channel base.
Macro Context: Domestic earnings growth remains constructive, but global liquidity, crude oil, and US yields will dictate the timing of the next leg.
Verdict: NIFTY is at the lower channel inflection, not the top. As long as 24k holds, the setup remains bullish, with 26k as the breakout trigger for continuation.
For educational purposes only. This is not investment advice.
Will BTC come out of the downward channel?• In the chart you can see how we are close to the upper limit of the downward channel. This is a key signal - if the breaking persists, it may mean a change in the trend.
• We have several support levels from below (marked with red lines):
• 112,238 USD
• USD 108,981
• USD 107,040
• From the top you can see resistance (green lines):
• 115,266 USD (local resistance - the course is just approaching)
• 117 395 USD
• 119 404 USD
⸻
🔹 Medium walking (SMA/EMA)
• You can see EMA Cross 50/200 (yellow label) - a classic signal "Golden Cross" / "Death Cross". It seems that the average is raised recently, which the market often interprets as a signal of a potential change of trend.
• SMA #1 and #2 (red and green lines) - the course tries to stay above the average, which is positive.
• SMA #5 (blue line below) shows long -term support ~ 107k USD.
⸻
🔹 MacD (below)
• The histogram shows reversal - red posts decrease, and the lines (blue and orange) are approaching each other → possible buy signal.
• If the signal line is intersected up, this will be confirmed by the growth moment.
⸻
🔹 RSI (Relative Strength Index)
• RSI is currently around 40-50 →, i.e. a neutral level (neither purchase nor selling).
• It slightly reflects from below, which suggests that there may still be space for further growth before we enter the purchase zone (> 70).
⸻
📌 Summary
• Short -term (1-7 days): it looks like BTC is trying to stand out from the downward trend. If it pierces 115,266 USD and persists above, subsequent goals are 117 395 USD and 119 404 USD.
• Medium -term (weeks): support levels 112K - 108K are key. A decrease below 107k would negate a bull scenario.
• Technical signals: MacD and RSI give the first signs of reflection. The course balances on the border of breaking the trend.
👉 It looks at the beginning of a potential growth movement, but it will be crucial whether BTC will stay above 115K.

Stacking logarithmic (log) channels - Secret tool in crypto Ep 3Stacking Logarithmic Channels - Bitcoin's Hidden Fractal Structure | Signal & Structure Episode 3
In this third episode of Signal and Structure, we explore a powerful but little-known technique: stacking logarithmic channels to identify critical support and resistance levels in exponentially growing assets like Bitcoin.
Core Technique Revealed:
The Logarithmic Channel Stacking Method
Start with a base channel on log scale (demonstrated from November 2011)
Copy and stack identical channels above/below the original
The midline of one channel becomes the boundary of adjacent channels
Creates a fractal structure that respects Bitcoin's exponential growth pattern
Key Principles:
Always use logarithmic scale for crypto channels
Midlines are as important as channel boundaries
Multiple touches validate channel placement
Channels maintain proportional relationships when stacked
Practical Demonstrations:
Historical Validation Points
November 2013: Top of first channel ($1,200)
December 2017: Top of second stacked channel ($19,000)
November 2021: Bottom of third stacked channel ($69,000)
March 2023: Bottom of fourth stacked channel ($15,500)
Current Market Analysis:
Bitcoin dancing around the midline of the current channel
Lower boundary support around $90-92K (aligning with CME gap)
Technical ceiling projections discussed with appropriate caveats
Channel Construction Details:
Monthly channels: Black, thickness 4, 30% opacity
Weekly channels: Maroon/brown, thickness 3
Always include midlines for additional confluence
Adjust opacity to prevent chart clutter
Advanced Insights:
Why log scale channels reveal patterns invisible on linear scale
How to validate channels using midline touches
The relationship between channel midlines and new channel boundaries
Dealing with ambiguous channel placement (multiple valid options)
Time-Saving Tips:
Use TradingView's copy/paste to maintain exact channel angles
Set consistent color coding for different timeframes
Keep channels semi-transparent for better visibility
This technique works because logarithmic scale represents percentage moves consistently - a 100% move always appears the same height regardless of price level. This creates natural harmonic levels that price tends to respect over long timeframes.
While specific price projections should be taken as possibilities rather than certainties, the method itself provides a robust framework for understanding Bitcoin's price structure across its entire history. The convergence of these channel levels with other technical factors (like CME gaps) adds additional weight to these zones.
Remember: Channels are guides, not guarantees. Use them for context and confluence, not as standalone trading signals.

Silver Wave Analysis – 29 September 2025
- Silver broke resistance area
- Likely to rise to resistance level 48.00
Silver recently broke the resistance area between the resistance level 45.00 (previous upward target set for Silver) and the resistance trendlines of the 2 up channels from August and April.
The breakout of this resistance area accelerated the active impulse wave 5 of the intermediate impulse wave (3) from July.
Given the strong daily uptrend, Silver can be expected to rise to the next resistance level 48.00 (target price for the completion of the active impulse wave 5).

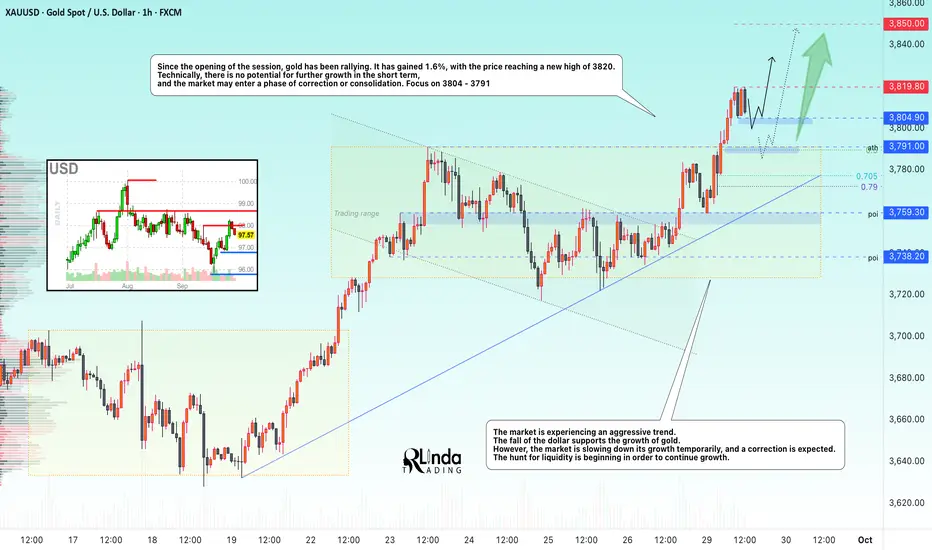
GOLD → Correction / consolidation before growth FX:XAUUSD has been rallying since the opening of the session, which we anticipated in yesterday's analysis. It has gained 1.6%, with the price reaching a new high of 3820. Technically, there is no potential for further growth in the short term, and the market may enter a phase of correction or consolidation.
Key supporting factors : Risk of a US government shutdown. Pressure on the USD is intensifying due to fiscal uncertainty. Unconfirmed reports of negotiations between Trump and Netanyahu on Gaza are not yet distracting attention from the risks.
The further dynamics of the metal this week will depend on US labour market data. This week will see JOLTS vacancies, ADP, PMI indices and the key NFP report on Friday. If they confirm the strength of the economy, expectations of a Fed rate cut (currently ~40 bps by the end of the year) may diminish, strengthening the dollar.
Resistance levels: 3819, 3825
Support levels: 3804, 3791, 3777
The market is experiencing an aggressive trend. The fall of the dollar supports the growth of gold. However, the price of the metal is slowing down temporarily, and a correction is expected. The hunt for liquidity is beginning in order to continue growth. Technically, the focus is on 3804 - 3791. A false breakdown of support could resume the bull run.
Best regards, R. Linda!
DXY (U.S. Dollar Index) – Bearish MomentumPrice is giving us signs of Bearish Momentum while respecting the larger descending channel structure, having recently tapped the upper trend line with a strong rejection.
Expecting:
A lower time frame correction to confirm continuation.
Targeting 90% if price breaks impulsively to the downside.
If price taps into our area of interest, we might expect a potential bullish reversal, depending on price action and correction quality.
Let price do the work, wait for the correction before entering short.

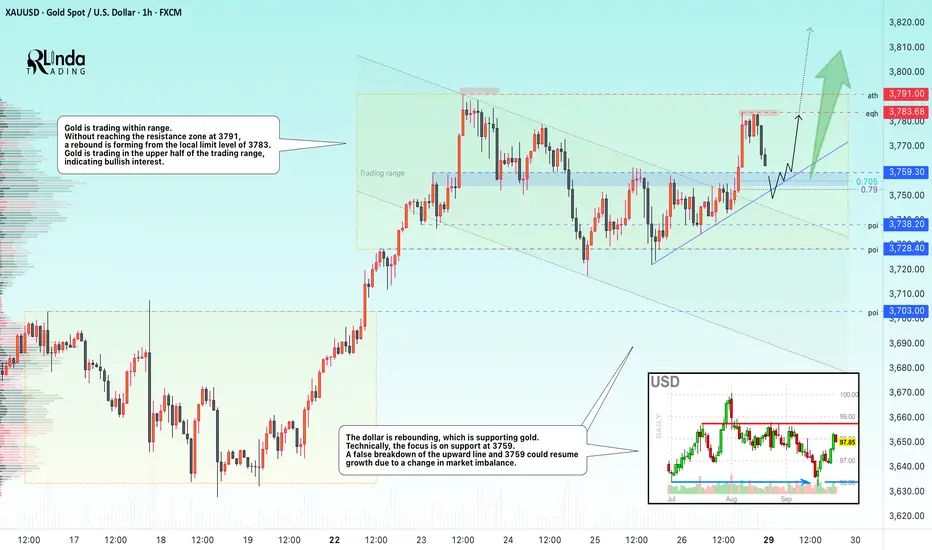
GOLD → The hunt for liquidity ahead of growth FX:XAUUSD . Technical analysis for the new trading session. On Friday, the local correction ended and there was a strong bullish impulse, which was sold off by the end of the session. What to expect next?
Gold is trading in the upper half of the current trading range of 3728-3791. The US session initiated the end of the technical correction, which ended with a breakout of the consolidation resistance at 3755. A momentum of 300 pips was formed, and the price hit the local limit resistance zone of 3783, from which the market began to sell off. However, the current correction of the bullish momentum is not so scary in the current perspective, as MM is forming a retest of the zone of interest to capture liquidity in order to continue the bullish trend. Thus, a false breakdown of the support zone 3759 - 3755 or the ascending line may shift the momentum towards the bulls, which in turn may lead to growth to 3783 - 3791.
Resistance levels: 3783, 3791, 3800, 3810
Support levels: 3759, 3755, 3743
If, during the retest of the support zone, the bulls keep the price above the blue zone at 3759, this will be a positive sign confirming the bullish structure, which could lead to a price recovery and a retest of the ATH.
Best regards, R. Linda!
EURUSD: Price May Continue To Fall Inside WedgeHello everyone, here is my breakdown of the current Euro setup.
Market Analysis
From a broader perspective, the price of EURUSD has shifted into a bearish phase after a prior Upward Channel failed and broke down. This reversal led to the formation of the current Downward Wedge, a pattern that has been guiding the price lower through a series of lower highs and lower lows.
Currently, the price is at a critical decision point. After bouncing from the lower part of the wedge, it has rallied correctly and is now directly testing the descending resistance line of the formation. This is a key area where sellers have repeatedly shown strength in the past.
My Scenario & Strategy
My scenario is based on the expectation that this Downward Wedge is a continuation pattern and the dominant downtrend will resume. I'm looking for the price to be rejected from the wedge's resistance line. A confirmed failure to break higher would be the key signal that the next impulsive move down is about to begin.
Therefore, the strategy is to watch for this rejection. A confirmed reversal would validate the short scenario. The primary target for this move is the 1.1615 Support, which aligns with the major Support zone.
That's the setup I'm tracking. Thank you for your attention, and always manage your risk.

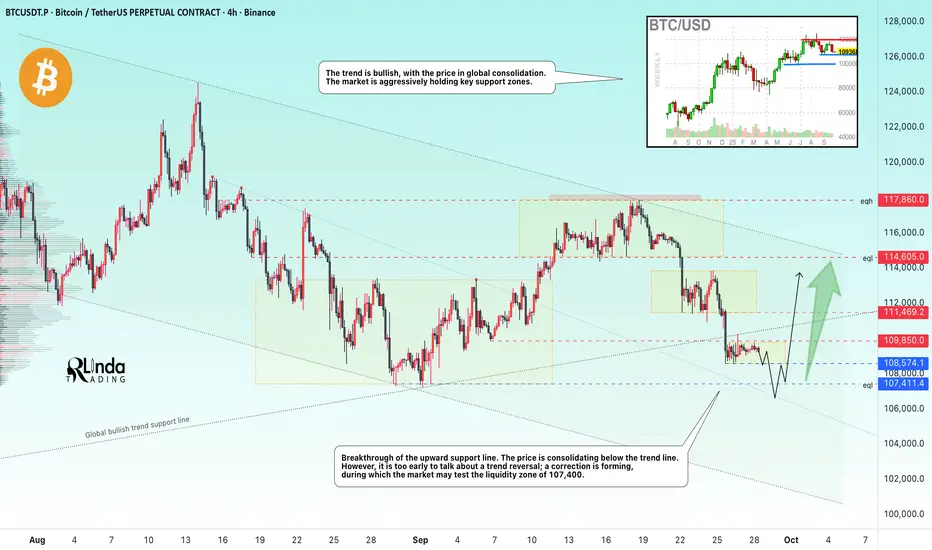
BITCOIN → Stagnation. A brief overview of the current situation.BINANCE:BTCUSDT.P is consolidating after breaking through the trend line support. Despite the positive fundamental background and bullish trend, the market is forming a countertrend correction.
The decline in interest rates in the US has had a negative impact on the cryptocurrency market. Can this be called manipulation? Most likely, yes. But the cryptocurrency market needs a constant driver to keep it alive; calm or neutral conditions lead to corrections and retests of intermediate lows...
As for Bitcoin, I have identified several key areas: the boundaries of the current consolidation at 109,850 and 108,575. Accordingly, a breakout and close above or below one of these boundaries could trigger a move in the corresponding direction. But within the local trend, we can expect a decline to the intermediate bottom of 107,400, from which an attempt at growth could form. In addition, an important zone is the conglomerate of resistance at 110K and the ascending support line. If the price can form an upward momentum and close above the trend support, the market may react positively.
Resistance levels: 109,850 - 110K, 111,500
Support levels: 108,500, 107,400
After breaking through the trend support, there is no momentum and the price is consolidating. This suggests that the market does not believe this premise and a battle for the area is forming. If the bulls can hold their ground and bring the price back within the boundaries of the uptrend, then it may be worth looking for a buying opportunity. Otherwise, it is worth waiting for a retest of the intermediate bottom at 107,400 before looking for an opportunity to open long positions.
Best regards, R. Linda!
XAUUSD Long: Bullish Momentum ContinuesHello, traders! The prior price auction for XAUUSD was dominated by a wide consolidation range, from which the price broke out with significant bullish momentum. This breakout from the demand zone 2 established the current uptrend, which has since taken the form of a well-defined ascending channel, confirming that the market initiative is with the buyers.
Currently, the price action continues to be guided by this ascending channel. After a successful breakout above the demand level, the price has reached the upper portion of the channel and is now in a corrective phase. This pullback is a normal part of a healthy uptrend and is bringing the price back towards an area of potential support.
My scenario for the development of events is a continuation of the uptrend after this correction. I believe the price will find support, possibly after a brief dip, and then resume its rally within the channel. In my opinion, the underlying bullish momentum is strong enough to push for a new structural high. The take-profit is therefore set at 3785, targeting the upper resistance area of the channel. Manage your risk.

XAUUSD Long: Bullish Momentum to ContinueHello, traders! The price auction for XAUUSD has been in a strong bullish phase, confirmed by the establishment of a well-defined ascending channel. This uptrend was initiated after a breakout from lower levels and has shown significant strength by pushing through multiple prior resistance areas, including the 3470 DEMAND 2 and 3675 DEMAND levels, turning them into new support.
Currently, the price action is continuing its ascent within the upper portion of this ascending channel, indicating that the bullish initiative remains firmly in control. The market is in a clear expansion phase, with very little sign of significant selling pressure, suggesting that any pullbacks are likely to be minor and short-lived.
My scenario for the development of events is a direct continuation of the current bullish momentum. I believe that the price will only make a shallow correction from the current levels before the next impulsive wave higher begins. In my opinion, the underlying trend is strong enough to carry the price to a new high within the channel. The take-profit is therefore set at 3835 points, targeting the upper resistance line of the channel. Manage your risk.
