?BTC Intraday LongsTechnical analysis using ICT concepts.
A rally below the 12 am NY opening price to raid sell stops below previous day's Asian & London session.
CISD from a Bullish orderblock formed on Thursday NY am session.
Looking for Buy stops resting above Friday's highs.
* Note A 4hour BISI is below the reference range that could still be revisited.
Pdarrays

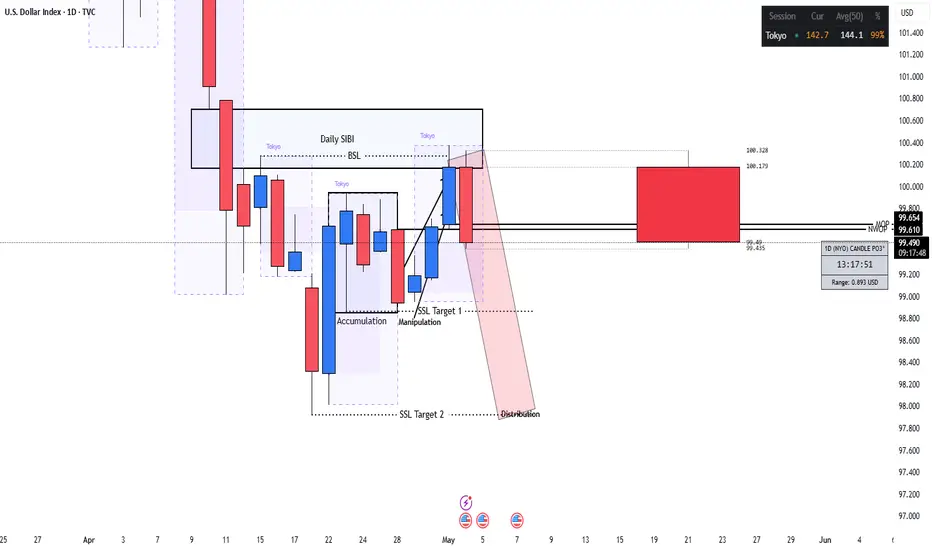
Bearish forecast for DXYWith regards my previous forecast, we have a strong reaction from Weekly and daily premium arrays.
On the weekly TF, we have IOFED of the SIBI and BSL above previous 2 weeks' highs was taken.
Tf: time frame
IOFED: Institutional Order Flow Express Entry Drill
SIBI: Sellside Imbalance, Buyside Inefficiency.
BSL: Buy side liquidity

What Is a PD Array in ICT, and How Can You Use It in Trading?What Is a PD Array in ICT, and How Can You Use It in Trading?
The PD array, or Premium and Discount array, is a key concept within the Inner Circle Trader methodology, designed to help traders map market movements and identify high-probability zones. By breaking down price behaviour into premium and discount levels, along with tools like order blocks and fair value gaps, the PD array provides a structured framework for analysis. This article explores its components, applications, and how traders can integrate it into their strategies.
What Is a PD Array?
An ICT PD array, short for Premium and Discount array, is a concept developed by Michael J. Huddleston, the mind behind the Inner Circle Trader (ICT) methodology. At its core, the PD array is a framework used to organise price levels and zones on a chart where significant institutional activity is likely to occur. These zones highlight areas of interest such as potential support or resistance, points where liquidity resides, or regions that might attract price movement.
The PD array divides the market into two primary zones: premium and discount. These zones help traders gauge whether the price is above or below its equilibrium, often calculated using the 50% level of a significant price range. In practical terms, prices in the premium zone are typically considered attractive in a downtrend and unattractive in an uptrend, while prices in the discount zone are more attractive in an uptrend and less attractive in a downtrend.
Beyond premium and discount zones, PD arrays include specific elements like order blocks, which are regions linked to institutional buying or selling, and fair value gaps (FVGs), which are imbalances or gaps in price that the market often seeks to revisit. Together, these elements create a structured roadmap for traders to interpret price behaviour.
Unlike a static indicator, an ICT PD array is dynamic and requires traders to interpret price movements in real time, considering the broader market context. It’s not a quick fix but a methodical approach to understanding how price delivers across different levels, offering a clearer view of where high-probability reactions could occur. The PD array is often combined with other ICT concepts, like market structure shifts or SMT divergence, to sharpen analysis and focus on precise market opportunities.
Premium and Discount Zones of a PD Array
The foundation of a PD array starts with defining the premium and discount zones. This is typically done by identifying a significant price swing—either a low to a high or vice versa—and applying a Fibonacci retracement. The 50% level of this range serves as the equilibrium point, dividing the chart into two zones:
- Premium zone: Price levels above 50%, often considered less attractive in an uptrend and more attractive in a downtrend.
- Discount zone: Price levels below 50%, seen as more attractive in an uptrend and less attractive in a downtrend.
This equilibrium acts as a baseline, helping traders assess whether the price is likely to reverse, consolidate, or continue based on its position relative to the 50% mark.
Tools Within the PD Array
The PD array doesn’t rely on a fixed set of tools. Instead, it offers a collection of components traders can use to refine their analysis. While the choice of tools can vary, they’re often ranked in a loose hierarchy, known as a PD array matrix, based on their importance within the ICT methodology. Let’s break down how this structure works.
Order Blocks
Order blocks are areas where institutional traders placed large buy or sell orders, often leading to significant price moves. On a chart, they appear as the last bullish or bearish candle before a sharp reversal. Order blocks are highly prioritised within the PD array because they indicate zones of potential support or resistance.
Fair Value Gaps (FVGs)
FVGs are gaps between price levels that form when the market moves too quickly to fill orders evenly. These imbalances create "unfinished business" in the market, and price often revisits these areas to restore balance. They are especially useful for spotting potential reversals or continuation points.
Breaker Blocks
Breaker blocks form when order blocks fail. When supply or demand zones are unable to hold and the market structure shifts, breaker blocks emerge, highlighting key levels to monitor.
Mitigation Blocks
Mitigation blocks are related to breaker blocks but form after a market structure shift, where the price makes a lower high (in an uptrend) or a higher low (in a downtrend). They function the same as breaker blocks, but the key difference is in the failure of a new high/low before the trend reverses.
Liquidity Voids
Liquidity voids are areas on the chart where there’s little to no trading activity, often following sharp price movements. These large FVGs are often revisited by price as the market seeks to rebalance liquidity, making them significant for identifying future price movements.
Rejection Blocks
ICT rejection blocks are similar in concept to order blocks but consist of the wicks present on a given timeframe where an order block could be drawn. They are essentially a refined version of an order block where the price may reverse.
Old Lows or Highs
Old lows or highs represent liquidity pools where traders place stop orders. These levels are magnets for the price, as the market often seeks to trigger these stops before reversing. Identifying these points helps traders anticipate where the price might gravitate.
Using ICT PD Arrays for Trading
Let’s consider how to use the PD array of the ICT methodology.
Evaluating Trend Structure
Before anything else, traders typically assess the broader trend by analysing highs and lows. The goal is to identify the current structure and wait for the market to form a new significant high or low that aligns with the existing trend. For instance, in an uptrend, a trader might wait for a new higher high to form, followed by a retracement.
Once the new high or low is established, traders often draw a Fibonacci retracement tool between the previous low and the recent swing high (or vice versa for a downtrend). This creates a clear division of the price range into premium and discount zones, providing the foundation of the PD array.
Retracement into the PD Array
As the price retraces within the range, traders watch for it to reach the premium zone in a downtrend or the discount zone in an uptrend. This positioning is essential—it signals that the price has reached an area where the risk-reward profile may be more favourable.
Finding Specific Setups
Within these zones, traders use the tools of the PD array to refine their approach. For instance, an FVG might act as a key level, particularly if it sits just ahead of an order block. Alternatively, a breaker block might signal a potential reversal if the price aligns with the broader trend structure. By combining these elements, traders can narrow their focus to setups that align with both the PD array and the underlying market conditions.
The Limitations of ICT PD Arrays
While ICT PD arrays offer a structured framework for analysing price behaviour, they’re not without their challenges. Traders relying on this methodology should be aware of its limitations to avoid potential pitfalls. Here are some key considerations:
- Subjectivity in Marking Zones: Identifying premium and discount zones, as well as order blocks or other components, can vary between traders. This subjectivity means that no two analyses are identical, which may lead to inconsistent outcomes.
- Experience Required: Effectively using PD arrays demands a solid understanding of market structure, liquidity concepts, and the ICT methodology. It can feel overwhelming for beginners without adequate practice.
- Higher Timeframe Dependence: While PD arrays are valuable, they’re more popular on higher timeframes. Traders focusing solely on smaller timeframes might encounter more false signals.
- Dynamic Nature: Markets evolve quickly, and PD arrays require traders to adapt in real time. This dynamic quality can be a challenge for those who struggle with decision-making under pressure.
- Overfitting Risk: With so many tools available within the ICT framework, it’s easy to overanalyse or misinterpret signals, leading to analysis paralysis.
The Bottom Line
ICT PD arrays offer traders a structured framework to analyse market movements and identify key price zones, helping them refine their strategies. By combining these arrays with other tools and techniques, traders can gain deeper insights into institutional activity.
FAQ
What Is the ICT PD Array?
The ICT PD array meaning refers to a Premium and Discount array, a trading concept developed within the Inner Circle Trader (ICT) methodology. It organises price levels and zones into premium and discount areas, helping traders analyse where the price is likely to react and reverse and place entry and exit points. The framework includes tools like order blocks, fair value gaps, and liquidity voids to identify potential areas of institutional interest.
What Is a Premium Array in Forex?
A premium array in forex refers to the portion of a price range above its equilibrium level, typically the 50% mark of a significant swing high and low. Traders consider this zone less attractive for buying, as it’s closer to overvaluation, and often watch for potential selling opportunities.
What Is a Discount Array in Forex?
A discount array is the zone below the equilibrium level of a price range. It represents a potentially more favourable area for potential buying opportunities, as prices are considered undervalued relative to the swing high and low.
This article represents the opinion of the Companies operating under the FXOpen brand only. It is not to be construed as an offer, solicitation, or recommendation with respect to products and services provided by the Companies operating under the FXOpen brand, nor is it to be considered financial advice.

NIFTY MONTHLY EXPIRYPrice Framework : Expansion Phase
Price Delivery : ERL to IRL
Multi Time Frame Analysis
Higher Time Frame - D1
Lower Time Frame - H1
Entry Time Frame - M5
PD Arrays
HTF - Bearish Order Block
LTF - Bearish Rejection Block

#PDA/USDT#PDA
The price is moving in a descending channel on the 12-hour frame and is sticking to it very well and is expected to break it upwards
We have a bounce from a major support area in green at 0.0400
We have an uptrend on the RSI indicator that was broken upwards which supports the rise
We have a trend to stabilize above the 100 moving average which supports the rise
Entry price 0.0506
First target 0.0700
Second target 0.0864
Third target 0.1050

BTCUSDAfter doing top-down analysis i'm looking for FUSIONMARKETS:BTCUSD to start heading back to the upside. The price has hit the monthly FVG and 50% consequent encroachment and showed me divergence as well so my bias is bullish.

This Completing Transformed My Trading (RESPECT & DISRESPECT)The idea of RESPECT and DISRESPECT completely transformed my ability to effectively read price action and trade profitably.
ICT teaches about Premium/Discount (PD) Arrays. There is a lot of bickering and debate as to which of these PD Arrays are better.
I'm here to build a case for the idea that they are all equally effective, and are just reference points on a chart to build a trade idea around.
To me, it boils down to: Which levels are being RESPECTED or DISRESPECTED?
That's it for me, that's what made it all click. That is what helped me stop worrying about every little level on the chart.
Once you have a high time frame (HTF) narrative and draw on liquidity (DOL), you know which PD arrays you want to see respected and disrespected. Coming up with your HTF Narrative is also based around what levels are being RESPECTED or DISRESPECTED.
I hope this video can give you an a-ha moment like it did for me.

EURUSD sellLooking for a potential sell today for EURUSD after all the high impact news coming from Euro later today. Would like to see price head up into a premium array for a sell if it reacts from the FVG marked.

UC PREDICTIONLiquidity grab on the weekly that caused a ChOCH on the daily followed by a break of structure then it retested that bos but stopped at this ict breaker block that I have highlighted. Expecting price to short down to the weekly swing 78% fib level.. maybe finish next week. Let me know your thoughts.

BTC/USD 28372.00 SSL TAKEN LONG IDEA 1:5 RR INTRADAY TRADEHELLO EVERYONE
HOPE EVERYONE IS DOING GOOD HAVING A GREAT WEEKEND.
HERE'S A LOOK AT POSSIBLE SCENARIOS THAT COULD PLAY OUT TODAY ON BITCOIN .
BTC /USD BUILD LQ DURING ASIAN SESSION SAW A SWEEP OF THAT LIQUIDITY LOOKING FOR A SWEEP OF THE BUY SIDE LIQUIDITY.
* Fridays highs TAKEN looking to target buy side liquidity on the on BITCOIN .
* just like yesterday waiting for entries LONG with the ICT 2022 entry model.
* Targeting the Asian BUY SIDE LQ.
-This would be an ICT JUDAS SWING SET UP
* Overall target will be the SWEEP OF THE HIGH.
* + RSI DIVEGENCE CONFLUENCE
lets see how it goes.
IF THIS IDEA ASSISTS IN ANY OR IF YOU LIKE THIS ONE
SMASH THAT LIKE BUTTON & LEAVE A COMMENT.
ALWAYS APPRECIATED
____________________________________________________________________________________________________________________
* Kindly follow your entry rules on entries & stops. |* Some of The idea's may be predictive yet are not financial advice or signals. | *Trading plans can change at anytime reactive to the market. | * Many stars must align with the plan before executing the trade, kindly follow your rules & RISK MANAGEMENT.
_____________________________________________________________________________________________________________________
| * ENTRY & SL -KINDLY FOLLOW YOUR RULES | * RISK-MANAGEMENT | *PERIOD - INTRA DAY SESSIONS TRADE

EURUSD POTENTIAL SELLPrice has potential to move lower upon the retest of the fresh supply zone formed after price reversed from a HTF supply. Wait for LTF confirmation to confirm the move.

ICT NWOG H/L/M(CE) New Week Open Gap ICT Concepts
NWOG: New Week Opening Gap Difference between Friday's Close Price & Sunday's Open Price.
C.E.- Consequent Encroachment or "middle point" of any Gap or Inefficiency.

EU Short Bias Jan 2023At the end of this year we saw price re-accumulate buyers on the yearly time frame. Coming into the new year I expect price to retrace into the monthly fair value gap and raid sell-side liquidity before displacing higher for the year.

EUR/USD ShortEU showing signs of exhaustion could mean shorts before the move up
After the MSS we could be seeing a retracement back into that zone which is below the 50% (purple line) and below that we have supply and FVG on LTFs

JPY INDEX LONG IDEAPrice is currently at a discount and approaching a 1H bullish orderblock. I would like to see those Equal Lows taken and for the Bullish orderblock to be traded into, before an expansion to the upside. The Low resistance liquidity would be my first initial target.
Once price has filled my order, I would shout pairs XXX/JPY pairs after some displacement.

Identifying the weekly range Right now I will be anticipating the high of the week being formed on Monday or Tuesday, with the ES trading lower toward the end of the week. Weekly objective of 3800. The market could show otherwise. Not trying to predict. Just trying to anticipate what the market will do at this point, given the range it has been trading in the past couple weeks.

AUDCADDaily Setup
AUDCAD Has Shown Willingness To Go Lower
In The WEEKLY Timeframe It Took Out The Buy Stops And Traded in The WEEKLY Bearish Orderblock (0.95183 - 0.94507)
DAILY -Timeframe Price Formed A Bearish Divergence (07 Mar - 05 April 2022)
The Bearish Divergence Shows Price Making Higher Highs Whilst Oscillator Is Making A Higher High - Lower Higher
That Kind Of Divergence Also Shows Price Has Taken Out Old Highs , In This Case PMH
/THE REST OF THE ANALYSIS SHOWS PREMIUM - DISCOUNT ARRAYS
In The 12 Hour Timeframe Price Has Formed A Trendline Phantom Which Will Be Taken Out In Order For Price To Trade To The Bearish Breaker Block
In The 8 Hour Timeframe Price Clearly Shows A Classic AMD Reversal
DISCLAIMER :
Before using this Tradingview account setups, please make sure that you note the following important information:
Do Your Own Research ( DYOR )
Our content is intended to be used and must be used for information and education purposes only.
It is very important to do your own analysis before making any investment based on your own personal circumstances.
You should take independent financial advice from a professional in connection with, or independently research and verify,
any information that you find on our Website and wish to rely upon, whether for the purpose of making an investment decision or otherwise.
No Investment Advice
Our Tradingview account is a financial data and news portal, discussion forum and content aggregator.
Circle Forex Institution is not a broker/dealer, we are not an investment advisor,
we have no access to non-public information about publicly traded companies,
and this is not a place for the giving or receiving of financial advice, advice concerning investment decisions or tax or legal advice.
We are not regulated by the Financial Services Authority.
We are an educational forum for analysing, learning & discussing general and generic information related to stocks, investments and strategies.
No content on the site constitutes - or should be understood as constituting - a recommendation to enter in any securities transactions or to engage in any of the investment strategies presented in our site content.
We do not provide personalised recommendations or views as to whether a stock or investment approach is suited to the financial needs of a specific individual.

CADCHFClassic AMD Trade With Multi-Confluence
We Have A ACCUMULATION ( A) BOX
We Had Price Selling A Bit Forming Our MANIPULATION ( M)
Whilst Forming A MANIPULATION, It Filled The Small Liquidity Void
Filled In The Bullish Order Block
Formed Divergence
PD Arrays Checklist
Old Low ✔️
Imbalance ✔️
Bullish Orderblock ✔️
Breaker Block ✔️
Mitigation Block (In Progress)
Type Of Trade
Reversal AMD Trade
Discount PD Arrays Active
Divergence Reversal
Fake H&S Pattern
Trendline Phantom
My Expectation
Price To Start The Distribute Upwards
Price To Mitigate On The Order Block
Price To Fill The Small Liquidity Void And Retrace Downwards
Price To Take Out Lows And See Bearish PD Arrays Active

Gold Will Push 1900price will swing down to open into the order block on the 4 hour and set up to go long

USDJPY OSOKMonthly Bearish
price seems to respect every -OB
Weekly in retracement to the -OB mth
Which is in premium array
Equal highs to be raided
Creation of BMS
Looking for a BMS to the weekly -OB mth
RTO on lower tf and sell

DXY Bullish from daily OBDXY broke the equal lows in discount, didn't really get to the next PD array so I'm waiting for a small bearish move to start the week
If dxy respect the daily Orderblock price might spike to the 98.82 area

