BTCUSD – 30M | Bullish Continuation Expected BITSTAMP:BTCUSD
Structure | Trend | Key Reaction Zones
Market recently tapped into strong demand zone (120,400–120,800) after a clean supply rejection.
Clear liquidity grab above highs followed by a deep correction to retest demand base — structure still bullish overall.
Market Overview
BTC has completed its corrective phase and is now reacting strongly from the demand box, suggesting potential continuation towards 123,000–125,000 if buyers sustain momentum. Price respecting the structure beautifully — accumulation signs visible again.
Key Scenarios
✅ Bullish Case 🚀 →
🎯 Target 1: 123,400
🎯 Target 2: 124,800
🎯 Target 3: 125,700 (supply zone retest)
❌ Bearish Case 📉 →
Invalidation below 120,000 (strong demand break).
Current Levels to Watch
Support 🟢: 120,400–120,800
Resistance 🔴: 123,400 / 125,700
⚠️ Disclaimer: This analysis is for educational purposes only. Not financial advice.
Pennant

GBPUSD – 30M | Testing Support Zone, Bullish Bounce ExpectedFX:GBPUSD
Market Overview
GBPUSD is consolidating within a tight structure after a strong sell-off.
The pair is currently testing a major support base where buyers previously defended aggressively.
If price maintains above this zone, we may see a bullish recovery leg toward mid and upper ranges.
Key Scenarios
✅ Bullish Case 🚀 →
🎯 Target 1: 1.3451 (mid-range)
🎯 Target 2: 1.3485 (rejection zone retest)
🎯 Target 3: 1.3510 (extended liquidity reach)
❌ Bearish Case 📉 →
Invalidation below 1.3390 (if support fails to hold).
Current Levels to Watch
Resistance 🔴: 1.3451 / 1.3485
Support 🟢: 1.3400 / 1.3410
⚠️ Disclaimer: This analysis is for educational purposes only. Not financial advice.

Bullish pennantOn the 1hour timeframe we have a bullish pennant pattern wich is good for the sunday rally tomorrow.

TRXUSD Winding up for the main leg?There is a STF pattern winding up with the funnel on 61.8%.
VBP is supporting the pattern.
Funnel is small, RRR is large (with log scale target), this is not a high probability trade, but PV is good.
High slung, not a low RL2 - reminds me of the 2020 DOGE trade with the disproportionately small second and third impulses, but perfect on 61.8. Wish I believed in that trade as it made target.
Pattern view

EURUSD Long: Awaiting Bullish Breakout from PennantHello, traders! The price auction for EURUSD has been in a corrective phase, which has taken the form of a large downward pennant. This bullish reversal pattern has been defined by a series of complex lower highs and lower lows, with the price consolidating between the descending supply line and the demand line near the 1.1715 demand level.
Currently, the auction is at a critical inflection point, trading at the apex of this pennant where the supply and demand lines converge. The price has found support near the 1.1715 demand zone, and after a complex series of moves, is now challenging the immediate overhead resistance. This compression of volatility indicates a significant breakout is imminent.
My scenario for the development of events is a bullish resolution of this downward pennant. I expect the price to make an impulsive move and break out above the descending supply line. In my opinion, this breakout will have enough momentum to carry the price up to the major horizontal supply zone. The take-profit is therefore set at the 1.1815 supply level. Manage your risk!

Euro will potentially Fall to 1.1680 After a Fake RallyHello traders, I want share with you my opinion about Euro. The market dynamic for the Euro has shifted from bullish to corrective after the price broke down from a prior upward channel. This structural change has led to the formation of a large downward pennant, a consolidation pattern that has been guiding the price of EURUSD lower. The market is currently trading near the resistance line of this pennant, with volatility compressing as it approaches the apex, signaling that a significant move is imminent. In my mind, an immediate breakout from this pennant could be a deceptive move designed to trap buyers. I expect that the price may initially break out to the upside and rally towards the major 1.1800-1.1780 seller zone. I think this rally will fail upon testing this significant area of historical resistance, creating a 'bull trap'. A confirmed and strong rejection from this seller zone would validate the overarching bearish scenario and likely trigger a sharp reversal to the downside. Therefore, I have placed my TP at the 1.1680 level, representing a logical objective for the decline that would follow such a failed breakout. Please share this idea with your friends and click Boost 🚀
Disclaimer: As part of ThinkMarkets’ Influencer Program, I am sponsored to share and publish their charts in my analysis.

ZEC wedgie ideaA wedgie is the act of forcibly pulling someone's crypto up their buttocks. It can be a form of bullying a victim or a prank among friends. There are various types of wedgies, such as an "atomic wedgie," where the crypto is pulled over the victim's head, or a "hanging wedgie," where the person is suspended by their crypto coin.

What Makes Technical Analysis The #1 Skill To HaveFinding this Forex pair CAPITALCOM:EURMXN
was very hard
you see Forex trading is very sensitive
Because you are dealing with governments
and central banks.
I still remember the time i was
learning about forex trading
and then the late president
of united states blocked the ICE feed
which is needed to screen
the forex markets
this is why if you go into forex
trading you need to understand
that this is really real.
So what is happening here?
Basically its the trade of currency bonds ,
The government borrows money
from the central bank in order
to develop the economy.
What the government does with this
money is up to the current government
in power.But this system
will never die.
Because printing money also known
as currency bonds is very very addictive
to the political powers. People love
governments that provide jobs.
I once talked to a local politician and she told
me that unless i have plan to involve a large number
of people the"funds" wont be released.
These funds are government currency bonds.
this is why forex trading is so powerful.
The moment you understand technical analysis
Its like you can see the future.
On this chart am using the surpport
plus the stochastic crossover
look at the chart and see the crossover
Rocket boost this content to learn more.
Disclaimer: Trading is risky please learn risk management
and profit taking strategies.Also feel free to use a simulation
trading account.

BTCUSD Another Bullish Continuation PatternAnother bull flag has formed. Meaning another bullish impulse is loading.
Every time you see one of these, do not hesitate. Ride the trend.

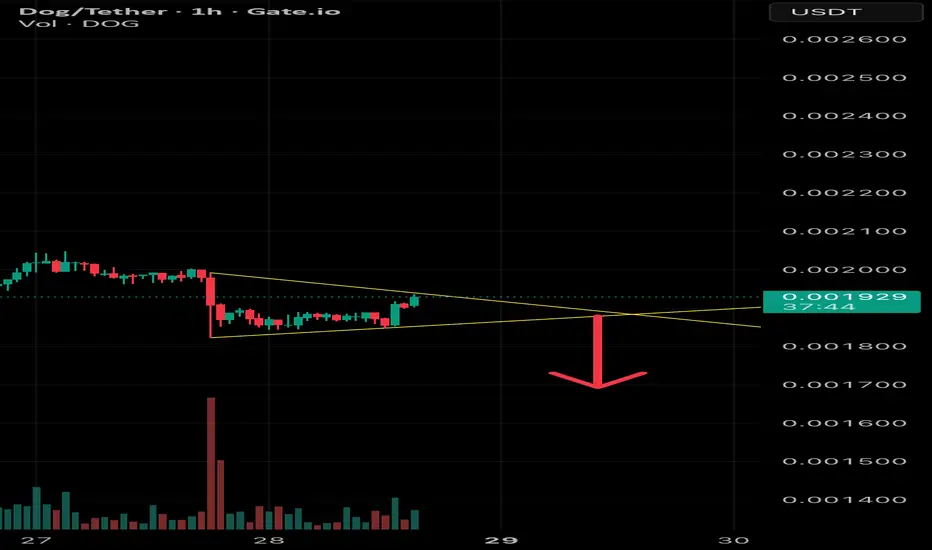
Bear pennant trade setup for $DOGAMEX:DOG trade setup Bear pennant
Entry at breakout (wait for retest most fakeouts fail here)
Look for increased volume.
Target $0.0017 (take partial profits on its way down)
Price above $0.002 (flagpole) makes the trade invalid.
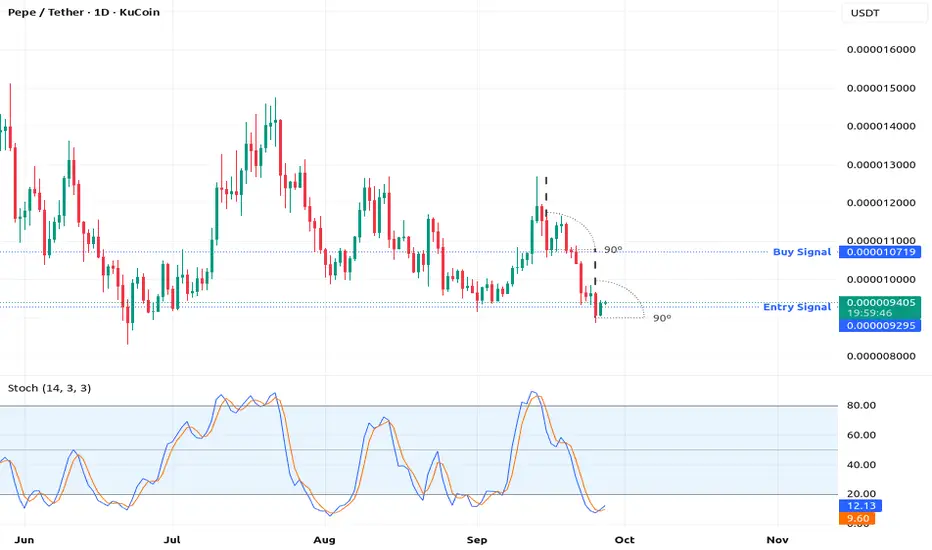
How To Use the #1 Entry SignalAm trying to understand
how to best love my family.
Its not been easy as i learn how to trade.
This skill is kind of invisible.
So its very difficult if you come
from a poor back ground to
explain the financial markets.
The truth is the financial markets
have been around
since the beginning of civilisation
And back in the day they used
different technology to calculate
the financial markets.
In today's world you are at an advantage
because you understand computers.
Now look at this chart look at the 90 degree
angles.
Look at the stochastic
Robert kiyosaki says its like
landing a crashing helicopter.
You first have to turn off the engine
Let the helicopter nose dive.
Then you pull the front of
the crashing helicopter.
Meanwhile as you nose dive you
are throwing away every thing that makes
the helicopter heavy,
As you are about to reach the surface...
pull up let the helicopter slide on
its bottom
Its called "Crash Landing"
This story i got from Robert Kiyosaki
Is the best way i could explain to
you trading psychology
of buying in a reversal trading system.
Look again at the stochastic
the blue line has crossed above the
orange line this is your entry signal
this is the time to enter this trade.
Rocket boost this content for you to learn more.
Disclaimer: Trading is risky please learn
risk management
and profit taking strategies.
Also feel free to use a
simulation trading account.
The #1 Bearish Chart PatternThere is something so powerful;
about technical analysis
that's very hard to put together
but once you do piece them together
you will begin to see the power of it
Tracking the price for
these alt coins
has been the best hing
i have ever witnessed.
Seeing the pennant bearish
price pattern
Has been something
i didn't think i would
see
This stuff is starting to get
more and more clear the more
i study about it.
Studying about the reversal pattern
is like reverse psychology
It gives you
the advantage in the market
Because?
Because everyone wants
a bullish signal when
the market is bullish
every one wants a bearish signal
when the market is bearish.
No one wants a correction.
No one wants the reversal.
Think about it how many
times have you seen a sucker
and you know deep down in your heart
that sucker
wont make it
Now imagine a sucker
that makes it in life.
That what this reversal pattern
is all about my man
this is what separates you
from the crowd
because you have hope that one
day that loser guy
you see will make it
think of the buy signal as
the potential you see in that loser
guy friend of yours
You have seen the potential but
no one around
you has..you have seen
it using the buy signal
now you see a big potential
he finally tells you he has made it
because you saw the potential in him
a long time ago and now
he is thanking you for seeing
this potential in him
and vows to help you
with hand outs if you will
ever need one.
That's what this correction is all about
Notice the angles
there all 90 degrees
this chart pattern is
called the pennant bearish pattern
i got it form Steve Nison's book
on Japanese candlestick patterns.
Thats where i first saw
this pattern.
Patterns are important .
If you want to learn more check
out the resources below.
Rocket boost this content to learn more.
Disclaimer:Trading is risky please learn risk
management and profit
taking strategies.Also
feel free to use a simulation trading account
before you trade with real money.
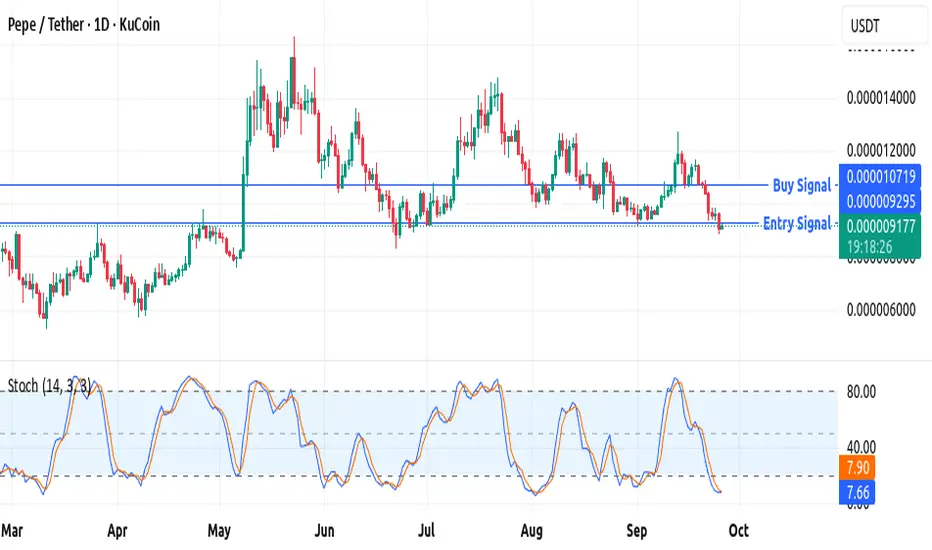
The #1 Entry SignalHello sorry for being quiet.
Am gong to tell you the reason.
These past days have
been crazy as am learning
about business taxes.
Also i remember this one lady
that for some reason used to tell me
everything that's wrong with me.
But never at one point
complimented my efforts.
Am talking to you my
sister.
Sometimes all you need to do is
give a man a compliment
for him to know that you
are really interested in him.
Going for a man that has money
is not always
the answer my dear sister.
Listen i have a good sister
thats married.
She always compliments
my business dreams
she always congratulates me when
i do something that am proud
of myself in doing
This sister of mine is so confident
in herself that her husband
is confident in her.
This means he trusts her so much
And he knows i love her as a sister.
To the point that i tell her to
always submit to him.
Do you see what am saying?
Imagine the weight that carries.
To where me as her brother
is encouraging my sister
to submit to her husband...
Thats the support that you will
need if you want a good man, my
sister the answer is simple
be good as well and
read books on relationship
and marriage that support
you especially
if that's what you desire.
What if your marriage doesn't
work out ?
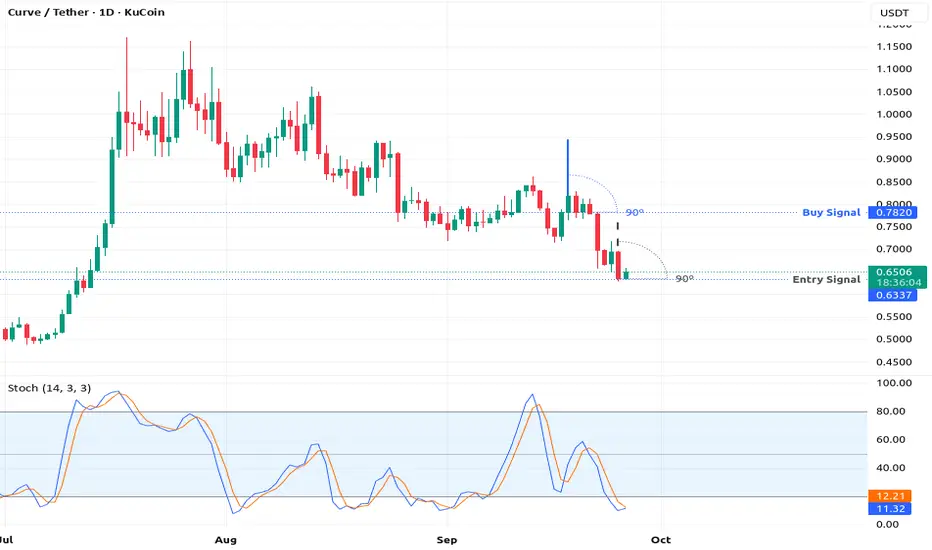
This chart has a buy signal
but its like a failed marriage.
So it crashed.
We are looking for a "CORRECTION"
That correction is your entry signal.
In order to see the correction we use the
stochastic indicator
What happens is the lines
crossover below the
the 20 level line.
Look at the chart to see
clearly
what am talking to you about.
This correction is the relationship
getting fixed,
This correction is me as your brother
dear sister telling you
to submit to your husband
Study the stochastic indicator
Also please rocket boost
this content to learn more.
Disclaimer:Trading is risky please use
a simulation trading account
and learn risk management and
profit taking strategies.
The "Gravestone Doji" Is The #1 Chart PatternA long time ago i was talking to a friend
of mine over the phone.
He lives in Australia now.His father
had a high paying job.
Because of that his father
used his resources to help
his first born child
immigrate to a first world country.
This strategy is very common in the
upper middle class
all around the world.
People with high paying jobs use their
resources to immigrate to first world
nations to gain wealth
So if you re open minded and dont
mind changing your culture
immigration can be a good fit
for you
Anyway over the phone he
reminded me
about how much i always
wanted to watch star wars
the movie.
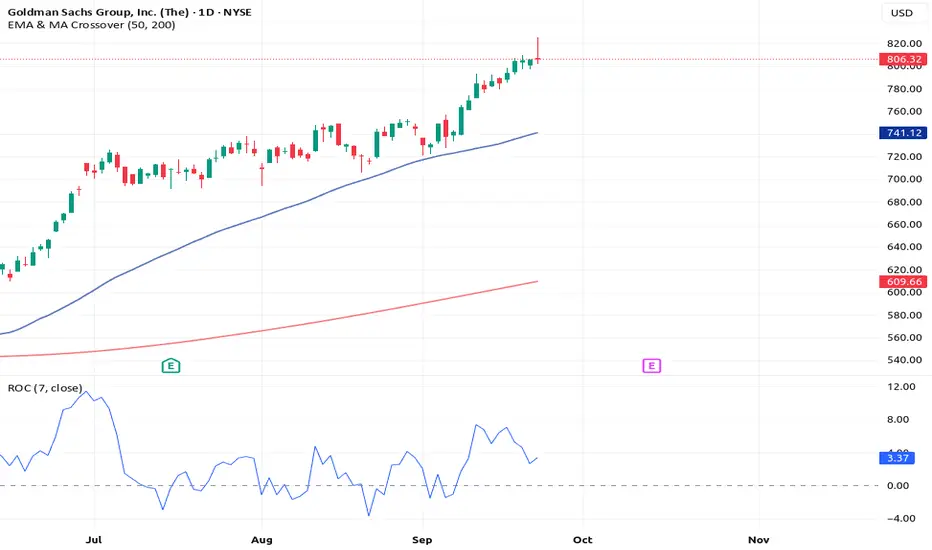
Look at the chart NYSE:GS
We call that the gravestone doji.
Its a reversal pattern.
Based on the price pattern
called "FOMO"
The fear of missing out.
Now notice when you look
at the rate change.The price
shows you like a double top and then
"wam" it crashes?
In the momentum world
or money supply
world the market has crashed..
Even though the price action is
on a new high.
Do you see the reversal?
Price represents demand
while rate of change represents supply.
When you have a low
supply for example
as you can see on the rate of change.
But you also have high demand
represented by price.
You get an increase in price.
This doji type reminds me of
the red light sword of Darth Vader.
Rocket boost this content to learn more.
Disclaimer: Trading is risky please use a simulation
trading account and learn risk management
and profit taking strategies.
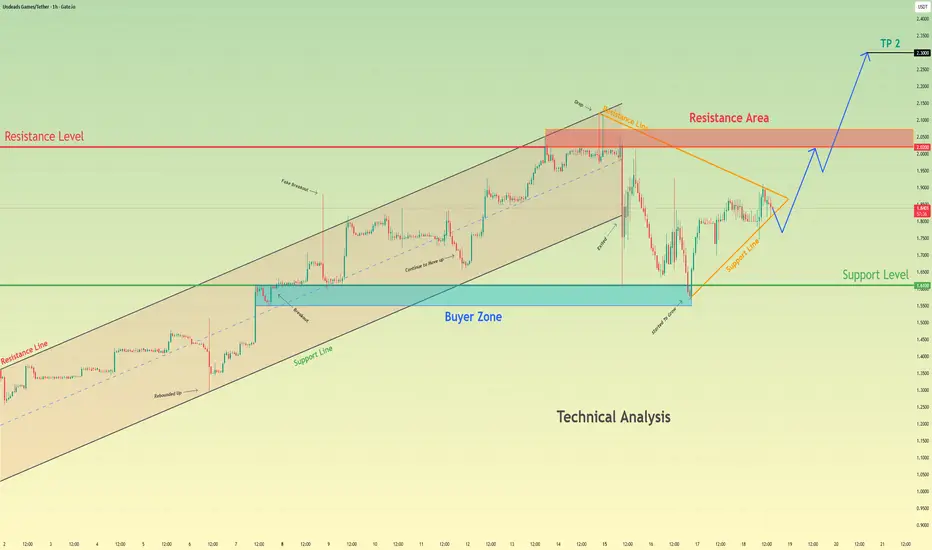
Undeads Games may Be Preparing for its Next Major Move UpHello traders, I want share with you my opinion about Undeads Games. The market for Undeads Games has transitioned from a strong impulsive uptrend into a prolonged corrective phase, setting the stage for its next potential major move. After a rally within an upward channel peaked near the 2.0200 Resistance Level, the price entered a lengthy consolidation, forming a large pennant pattern. This correction guided the price of UDSUSDT back down to the key 1.6100 buyer zone, where it found significant support. Currently, the asset is at a critical inflection point, with the price coiling tightly at the apex of this pennant, signaling that a high-volatility breakout is imminent. The primary working hypothesis is a long scenario, which anticipates a bullish resolution to this consolidation. The expectation is that the price will break out from the top of the pennant and rally towards the major Resistance zone at 2.0200, which serves as TP 1. Following the achievement of this first target, a healthy correction or retest of the broken resistance is anticipated. A successful hold of this level as new support would then provide the foundation for the next impulsive wave higher, with a secondary objective set at TP 2 at the 2.3000 level. Please share this idea with your friends and click Boost 🚀
ETH ANALYSIS🔴 #ETH Analysis : ❓❓
🔮There is a formation of "Bullish Pennant Pattern" in #ETH in 4HR time frame. We can expect around $4850 bullish move if the price break the pattern.📈
⚡️What to do ?
👀Keep an eye on #ETH price action. We can trade according to the chart and make some profits. ⚡️⚡️
#ETH #Cryptocurrency #Breakout #DYOR

Gold - Bullish Pennant and retest of M15 DemandIt looks like we might be getting another push to the upside. A false breakout to the downside of a bullish pennant and a retest of an M15 TF demand zone look like solid bullish confirmations.

The Bullish and Bearish Cases For ETH/USDOverview:
This idea contains both bullish and bearish cases for ETH/USD.
Bullish Case:
ETH/USD has formed a bullish pennant since April 8th. A strong break above the pennant's upper line indicates further upward momentum. The probability of success for a bullish pennant is roughly 54%.
Bullish Case Warning:
Although the bullish pennant is formed, there is a chance the price breaks below its bottom line, which would invalidate it. The bullish pennant is also accompanied by bearish RSI divergence, making a break of the bottom line more likely.
Bearish Case
Since December 17th, 2024, ETH/USD has formed a bearish butterfly harmonic pattern. The probability of success for a harmonic butterfly is roughly 75%. In addition to the butterfly, ETH/USD has short-term bearish divergence, further supporting point D as a turning point downward.
If the butterfly plays out, I would expect an initial drop to the 0.618 Fibonacci around $2750.
Bearish Case Warning
Given that there is a bullish pennant on the short term, I would wait until it is invalidated before taking a short position.

OKLO at critical trend lineOKLO is currently pushing against the red trend line to complete this bullish pennant. Since the RSI is making lower lows while the price is making higher highs, it is signaling bullish divergence
September 17th FOMC meeting could see this go both ways, with a 25 point rate cut leading to disappointment, or a 50 point cut taking us all the way to euphoria. Nobody knows, but with this one I'm keeping a tight stop loss
Important info: The red trend line is the master trend line across most of the chart, it is consistent with multiple AI stocks as they all approach this critical moment. Anything above the red trend line signals the euphoria stage in my S & P 500 chart
Nvidia has lead the charge by breaking their red trend line. Perhaps we'll see smaller stocks follow in it's wake

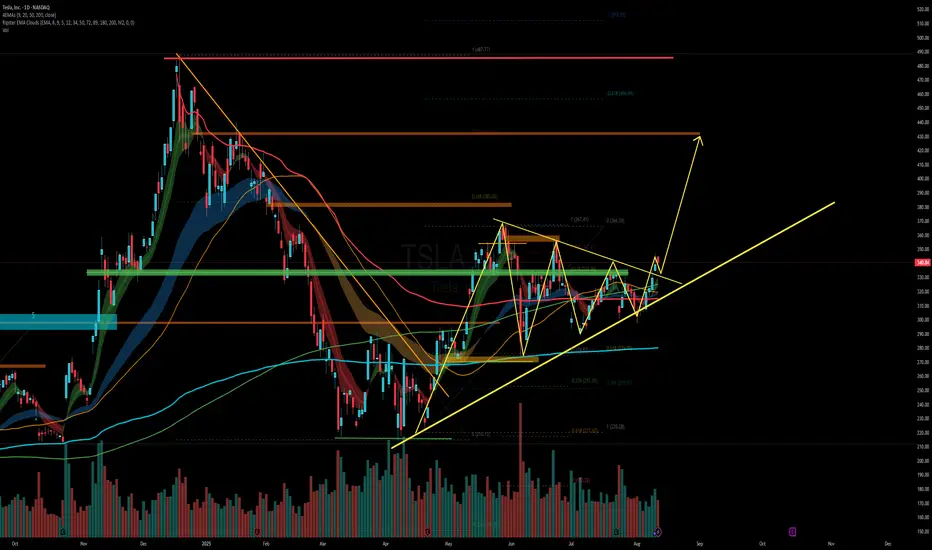
TSLA - is it the time for Fireworks ?TSLA - huge base, many breakout failures due to news.
Let's see if this time it sustains this bullish move.
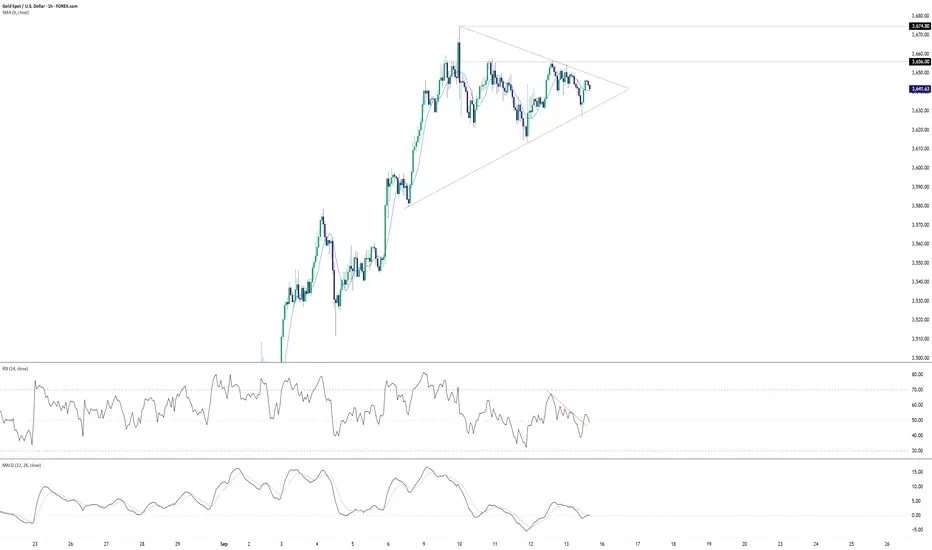
Gold breakout risk builds with pennant patternGold is coiling within a bull pennant pattern on the hourly, pointing to the potential for a topside break and eventual retest of the record high at $3674.80.
Should we close above pennant resistance, longs could be established on the break with a stop beneath for protection. $3656 looms as an initial target, given the price tagged it on no fewer than 11 occasions over the past week but only closed above it once—when the record high was set. If the price can successfully push above $3660 and hold there, it may encourage additional bulls to join in the move targeting $3674.80.
An alternative setup would be to wait for a potential break and close above $3660 before initiating longs, allowing for a stop to be placed beneath for protection while targeting the record highs.
Momentum indicators are providing an inconclusive message on directional risks with RSI (14) and MACD sitting in neutral territory. More emphasis should therefore be placed on price action for guidance rather than adopting a specific bias.
Good luck!
DS
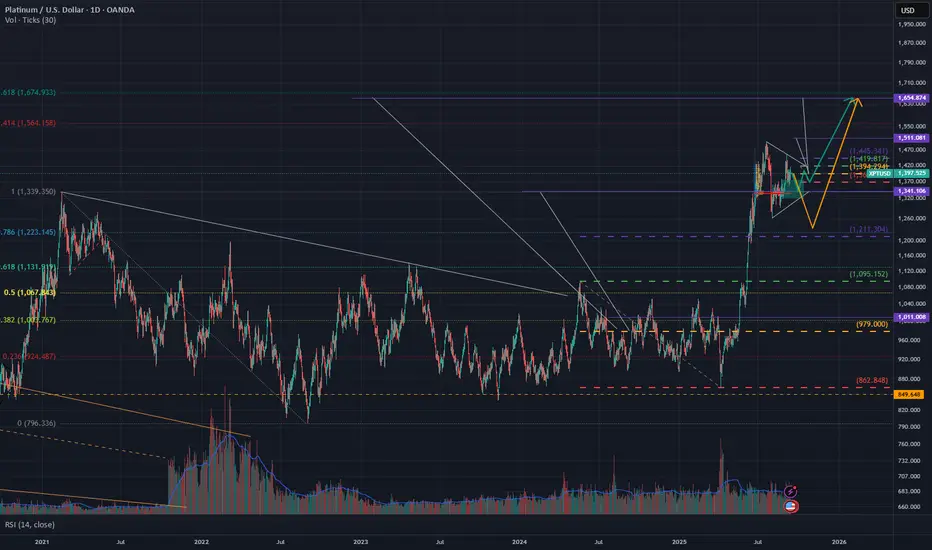
XPTUSD 1D HVF forming - cont. of the triggered macro patternPlatinum has triggered a macro HVF out of a FW. It is too early to know, but it seems like we're winding up on T2 for a continuation to the final target of 1620.
Plan:
1. Accumulate a small position at RL2 (box shown) - less than 1% risk.
2. Wait for the STF HVF to complete and enter at JIT to complete to the T3 of the larget pattern for a healthy RRR.
3. Set a reminder to see if we see a reversal that makes this a new RH2 for the larger pattern for which the FW was the first impulse. This may become a decade pattern - it seems more likely that we overperform on this pattern as the central bank printing machines do their thing
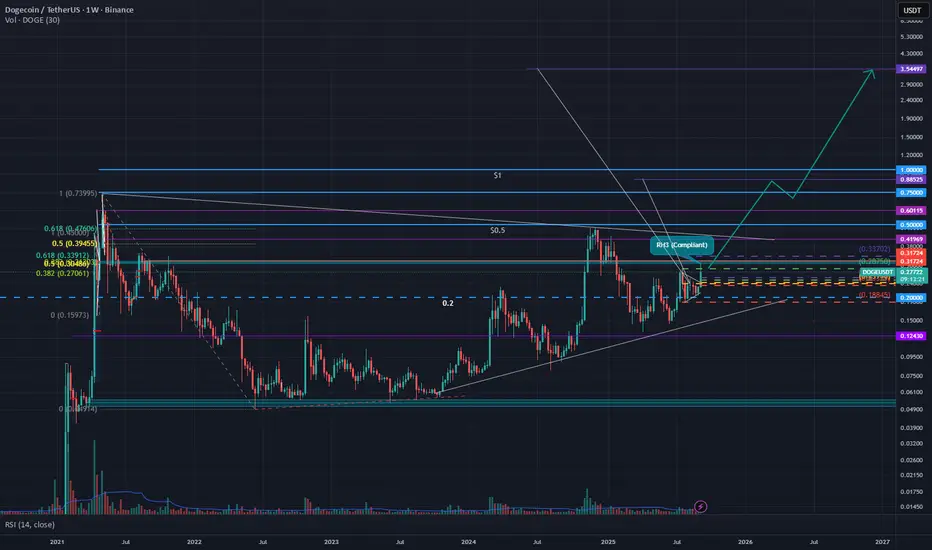
DOGE 1W RH3 valid, target $3.5DOGE made RH3 this week. We're expecting a few weeks of correction before triggering to the target of R3.5.
Notes
- We've already broken with momentum part a previous pullback level - the "funneling" may already be over.
- There was a STF HVF which can constitute a primer if the above point is the correct draw.
PLAN:
- Keep the full position from the primer until at least T2 before reducing 50% or less. If we get stopped out, its ok, we did size appropriately.
2 Points:
1. If you don't take profits, you won't have any profits.
2. Let the winners run.