Monthly TLT Historic Oversold Reading NASDAQ:TLT
TLT, the long bond ETF is approaching a historic oversold monthly reading due to the coming rate hikes.
The Fed would like us to believe that they will raise rates 6 more times this year, which would of course destroy bond prices.
It's not going to happen....
The Fed has raised rates once thus far, by just 25 bps and the market is already down 15-20% from the highs.
The US National Debt has ballooned above $30 Trillion, and every 100 bps adds 300 Billion in ANNUAL debt service expense.
Those who time the interest rate peak, will be handsomely rewarded by going long bonds as the Fed is forced to stick their foot in their mouth and admit that the US economy is hostage to it's debt and dependent on low rates to sustain growth and keep the markets afloat.
The interest rate threshold that causes a major systemic event gets lower and lower as the US is more and more indebted.
twitter.com
I believe that a combination of an intense market sell off and/or peaking rates somewhere around 150 - 175 bps will mark the bottom in bonds.
I own no TLT at the moment; however, I will start scaling into a position over the next few months depending on the market reaction as we progress through the coming gauntlet of FOMC meetings (May/June/July)
A test of the lower bound of the Modified Schiff Pitchfork will be my signal to go long.
I'll update this idea with any TLT moves I make.
Pitchforks

ADA, Bull and Bear Way.So if ADA gets a retrace here soon I would be watching for this to set up. This is an ideal area I will be looking. A break below .47 would be a bit sus and would reconsider things but the actual invalidation to to this, the bullish set up is noted on the chart. If helpful please boost and follow. Cheers!

BTC 4H Analysis (July - Early August)After expectations were confirmed from the FOMC meeting on July 27 and some positive words were heard from the Fed, the price of BTC reacted with considerable bullish volume. Price has reacted again and surpassed the diagonal resistance created from the June and July major highs. Will BTC reach new highs in early August?
The current rising channel momentum has increased significantly from its confirmed reversal on July 26th. We are able to draw a new pitchfork to expect the next major reversal or a new high. Combining Andrew's pitchfork, channel momentum, and trend-based Fibonacci time, we might be able to see a reversal around 26100, on August 2, as BTC continues its slowly bullish uptrend.
Keep in mind that there may also be some bullish news for the cryptocurrency market in August, prior to and after the anticipated Ethereum merge.
"The Merge represents the joining of the existing execution layer of Ethereum (the Mainnet we use today) with its new proof-of-stake consensus layer, the Beacon Chain. It eliminates the need for energy-intensive mining and instead secures the network using staked ETH. A truly exciting step in realizing the Ethereum vision – more scalability, security, and sustainability." ( ethereum.org )
Below is an old private price prediction of mine for ETH for some reference on momentum.
We can also consider the current state of the US economy and how that might be significant. Global commodities are declining, US interest rates are expected to continue rising for the rest of 2022 to hedge inflation, the tech sector has generally been reporting strong earnings, and unemployment remains low.
Absolute confirmation regarding the US recession status still remains inconclusive in my opinion. Very slow growth into 2023 is what I expect.
Feel free to share your thoughts and opinions so we can compare the bulls and bears for a more accurate short-term expectation!

how far will price go? helping you determine when price has gone far enough one way or another. when is a good place to buy or sell? lets see how the price can reveal to us where the buyers and sellers are so we dont step in front of a freight train.

BTC/USDT 4H LongEntry: 20883.6
TP: 22989.2
SL: 20187.8
Long Trade Idea:
BTC has reached a point reflecting a reaction from a minor support zone, upwards channel momentum, and major pitchfork momentum. These zones may suggest a bullish reversal to occur making a temporary new high towards 23400. The RSI indicator is not showing any divergence which may suggest that the major downwards trend will continue. That further increases my thoughts for 23400 providing major temporary resistance, a decent opportunity to take profits before. That 23400 zone is also in line with the middle upwards channel as well as the major pitchfork momentum resistance.
Let's see how this plays out.
Disclaimer: I have not put a large degree of thought into this trade idea. This is purely for general practice and seeing if anyone has any thoughts that they would like to voice.

CL - Crude LowerNYMEX:CL1!
It looks like Crude is heading to the $75-$80 area.
There are plenty of Macro forces underway that should push the price lower.
Macro
- Strong Dollar
- Rising Interest Rates
- Slowing Economies
- Government Intervention (Fist Bumps)
On the Technical Side:
- Price finally broke under the green major pitchfork's median line
- Weekly 9/20 MAs crossing bearish or Weekly Ichimoku Cloud: Impending conversion line / base line bearish cross
- Weekly MACD / RSI heading lower
- Weekly DMI, Bearish -DI cross
However, the daily chart/indicators do not look as bleak in the near term.
For this reason, I'm thinking that Crude might see some short lived upside before continuing lower.
Taking the Pitchfork set-up into consideration, I'm thinking there are two potential scenarios that will play out.
Two Scenarios
1 - Price retests the green fork's median line, before dropping. (Sky Blue Path)
OR
2 - Price heads higher to the U-MLH of the purple fork into Ichimoku resistance areas (base line or cloud) before continuing lower. (Yellow Path)
I'll be watching this chart closely, looking for a short entry. I'll update this idea when I get short.

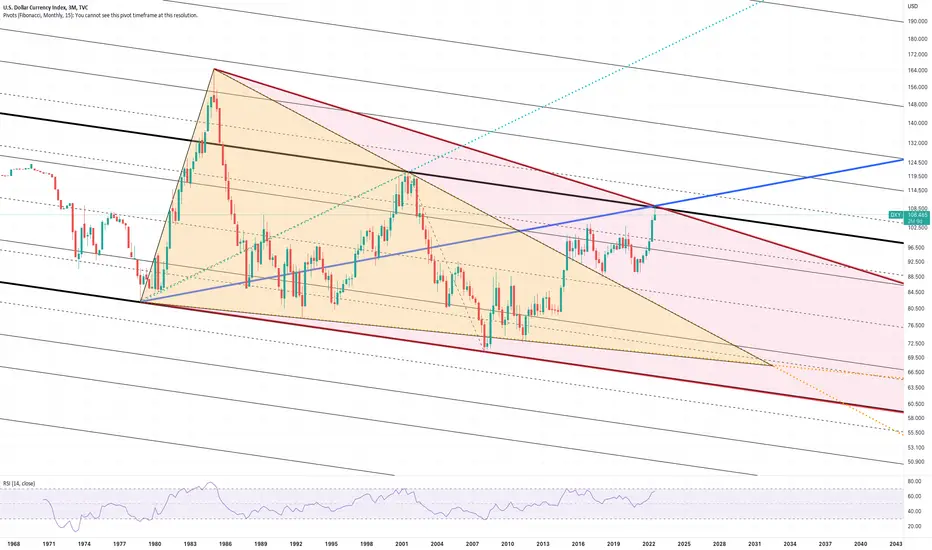
DXY DIXIE US DOLLAR INDEX DOUBLE WOLFE WAVE 3 MONTHLYA Wolfe Wave is a chart pattern composed of five wave patterns in price that imply an underlying equilibrium price. Investors who use this system time their trades based upon the resistance and support lines indicated by the pattern.
Spread BTP-BUNDSpread BTP-BUND and the Median Line.
The inevitable( and bad) financial consequences of the political crisis in Italy.
The Center Line - natural first target of the pattern is above 300 right now.

3 spot potential support1- The trendline from 2015 and 2020 lows (Blue dashed in the chart) is offering a good support zone to check.
2- The SMA 50 support zone.
3- This is also the test zone of the 50% upper inside of the red Median Line per 1.2.3.
Update of

SPY Forks Bear Market Rally Top 430-435AMEX:SPY
SPY Forks
Price finally broke out of the major descending fork that has held price since April.
Trigger line + minor fork showing a potential top around 430-435 in mid-August.
Confluence with the 200MA and .618 fib.
Let's see what happens.

Quick BTC 15min Short Position 💣⌚️BINANCE:BTCUSDT
COINBASE:BTCUSD
A quick position for short term traders
If the bullish candles remain weak. We can enter a short trade from this moment until the pullback of the price.
The optimal stop-loss is above 22887
TP 22217
If you are satisfied with the analysis, please follow us and share a with others.
CrazyS.

BABA - AccumulationChart request for @RocketFuel20,
BABA has a chart where a pitchfork is useful and can see how the trend accelerated to the downside into SC Selling Climax - falling through the lower warning lines.
It also hit the 1:1 fib at the low.
Since then BABA looks corrective but it may go on rallies once it gets above AR resistance.
Bullish divergence coming in on RSI.
Not advice.

DXY TEST LOG Test of the Center Line for DXY.
We been tracking this pattern since:
Potential trend exhaustion on watch.

Bitcoin dynamic levels IIIThis is only to update this
and this
Support zone on watch here - orange arrow.

US Oil Daily 🛢️💥TVC:USOIL
It seemed that if the oil price were stabilized above 101$ and did not respond negatively to the downtrend line, the price would rise to 118$ and the specified range.
The optimal stop for the Long position is below 100$.
Our previous analysis worked correctly.
If you are satisfied with the analysis, please follow us and share a with others.
CrazyS.

Doge moving northIn case of a strong move up we will check the 0.985 price zone (Red dotted horizontal trendline in the chart) . That should be a strong Resistance zone.
0.10 psychological level of course.
This chart is an update due to the recent nice move up. Update of:
Again: NO price predictions here but maybe U can use the levels in this chart to track the future price fluctuations.
Hope you enjoy!
