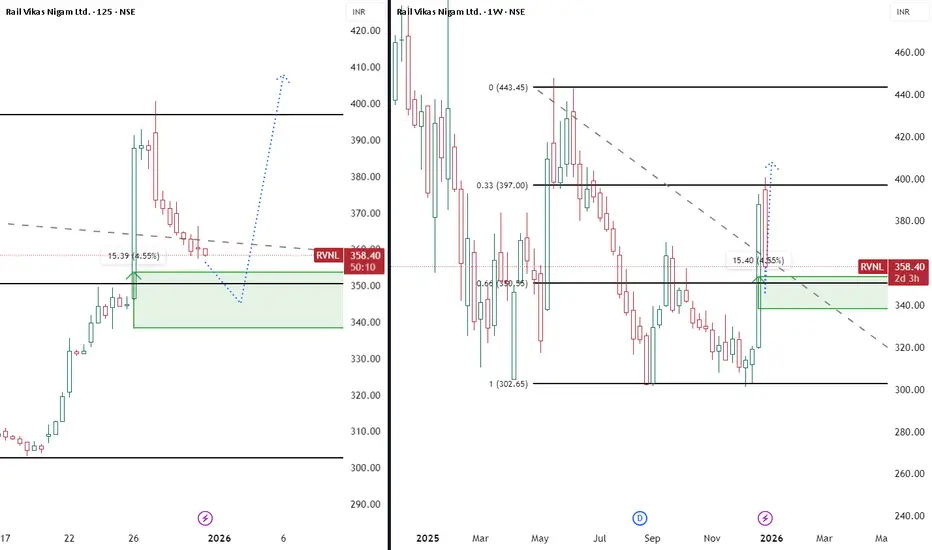
RVNL Long setupLogic: RVNL has started uptrend, followed by a demand zone on the daily.
The zone lines around 50% of the previous week bullish candle which may be considered a good retracement level.
The demand zone zone formed may act as a netter retracement level and a long opportunity.
A equivalent better demand zone lies on 25 min time frame right above the daily which can act as a turning point of prices.
Keep strict Stop loss and target of 1: 3
Pivot Points
ICT Trader - Top Down Analysis on ETH!Guys this is the first time I’ve fully broken down exactly how I trade crypto using the ICT strategy step by step, top down.
In this video, I take you through my entire charting process, starting from the monthly timeframe all the way down to the 1 hour, explaining how I build conviction, define bias, and execute trades using the ICT concepts.
I also explain why I’m bullish, even while most people are bearish and why I’m completely fine going against the crowd when the charts support it.
You’ll see:
-Top Down analysis from Monthly to 1HR
-How I read the charts and use liquidity to decide my bias
-HTF Bias vs LTF bias
-How we can make money regardless if we are bearish of bullish!
If you want to understand how ICT concepts are actually applied in real market conditions, this video will change how you look at charts.
I am launching my website soon which where I will essentially give you the full education of ICT from beginners to advanced in FOREX and CRYPTO. So hit the follow button and I will keep you all updated.
⚠️ Disclaimer:
I am not a financial advisor. The content shared on this channel is for educational and informational purposes only and should not be considered financial advice.
Trading and investing in cryptocurrency involve high risk — you could lose some, or all, of your money. Always do your own research and make sure you understand the risks before making any financial decisions.

Bitcoin Setups: Smart Entry for Buy and Sell Positions (3H)Bitcoin Market Analysis: How Market Makers Banks and Governments Manipulate Price and Capture Liquidity
Market makers large financial institutions and even government entities often influence Bitcoin’s price movements to serve their own trading strategies. Their goal is to manipulate the market in a way that allows them to fill their own orders efficiently and enter positions at more favorable prices. Understanding this behavior is crucial for retail traders who want to avoid being caught on the wrong side of these movements.
As we have observed Bitcoin has been consolidating for over a month moving sideways within a specific range. During this period it repeatedly hits buyers’ and sellers’ stop orders creating temporary spikes or drops before continuing its range bound movement. These price actions are often small and controlled but they are deliberate. The key question we need to ask is why is this happening The answer lies in thinking like market makers rather than retail traders.
In this low volatility phase the main focus should be on identifying where liquidity resides. Market makers target areas where stop orders are clustered these are points where they can collect liquidity to fuel their next large move. On lower timeframes we’ve identified a critical stop zone between 90,154 and 91,600 dollars. This range represents a high probability area to look for sell short setups as market makers often attempt to trigger these stops to gather liquidity.
Why is it unlikely for price to break significantly above this zone at this moment On higher timeframes the long stops have not yet been triggered meaning sufficient liquidity has not been collected. Banks and institutional players are still filling their orders. Until this accumulation process is complete strong bullish moves are less likely.
Entering positions should always be strategic and aligned with proper risk to reward management. On our chart we’ve marked a setup that respects this principle. It is positioned where sellers’ stops are likely to be triggered allowing us to enter in alignment with market makers and institutional flows. This approach increases the probability of a successful trade while minimizing unnecessary risk.
Equally important is integrating trader psychology into your analysis. Technical analysis alone is rarely enough. The majority of trading success approximately 70 to 80 percent comes from understanding market psychology not just price patterns. Recognizing how other traders are likely to react to stops liquidity pools and market maker movements is essential to staying ahead in the market.
In summary successful trading in Bitcoin requires a combination of technical awareness liquidity analysis and psychological insight. Always think like the market makers anticipate where liquidity is concentrated and enter trades with calculated risk to reward setups. By doing so you can align yourself with the larger players instead of constantly reacting to their manipulations.
If the price does not reach the red zone and our sell position is not triggered, and then it reaches the green zone without hitting our sell zone, we will no longer enter the sell position. In this case, we will look for a buy/long in the green zone
We have two entry points for the position, allowing you to enter the sell position using DCA. There are also two targets; after hitting the first target, take some profit and move your stop to break even.
If you have a coin or altcoin you want analyzed, first hit the like button and then comment its name so I can review it for you.
This is not a trade setup, as it has no precise stop-loss, stop, or target. I do not publish my trade setups here.

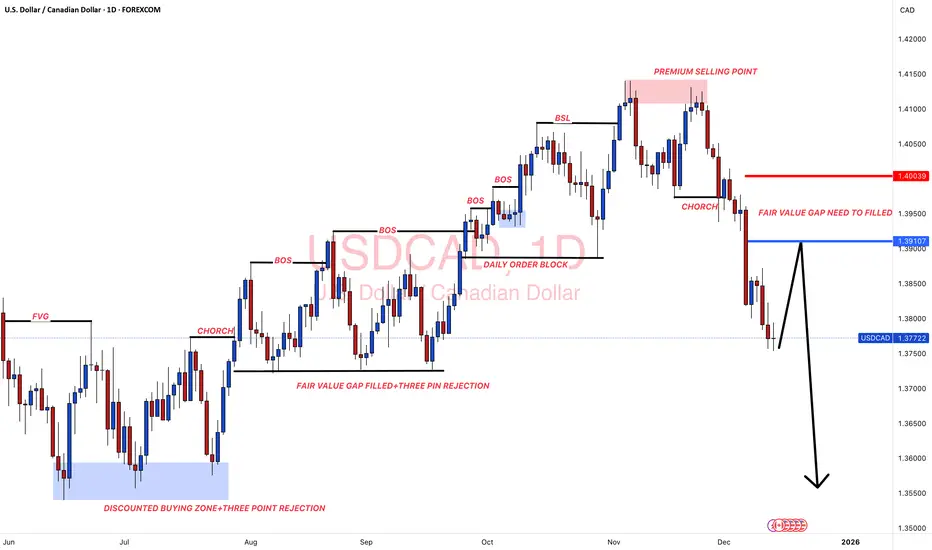
#USDCAD: A Perfect Selling Zone For The Week 15/12/2025Dear Traders,
Overview On USDCAD📈
🔺Price has left a great area of selling zone which need to be filled; we already have given an entry point and an exit point for you to identify the selling zone easily. USD is likely to show some minor bullish behaviour which will push the price of USDCAD to our point of interest.
🔺There is only one swing selling target that we currently have, this is not a long term trade instead or intraday trade.
Entry and Stop Loss Planning📊
🔺You must use your own knowledge to establish trading plan successfully, entry at the area as described in the chart only if it matches your bias.
🔺Use 'Red Line' as a exit point or as a stop loss also trade with accurate lot size based on your account.
🔺Take Profit Set at the 'Black Arrow' Ends.
Support and Encouragement ❤️🏆
If you like our idea then please like and comment which will encourage us to post such more ideas. Also share your views in the comment sections.
Tean Setupsfx_
Nifty Analysis EOD – December 30, 2025 – Tuesday🟢 Nifty Analysis EOD – December 30, 2025 – Tuesday 🔴
Yearly Expiry: Volatile Indecision at 26K.
🗞 Nifty Summary
The Nifty started the session flat but immediately took a sharp 78-point dive south to mark the day low at 25,878. A sudden and aggressive recovery saw the index rise 98 points from the lows to test the CPR range, but it failed to sustain.
The subsequent sell-off dragged the price back to the day’s low, where Nifty formed a textbook Double Bottom (DB) pattern. The breakout of this pattern successfully carried the index back to the IBH.
In a volatile conclusion to the Monthly and Yearly expiry, the last 5-minute candle aggressively breached the IBH and the previous Day High, allowing Nifty to close at 25,970.55, almost at the high of the day and nearly unchanged from the PDC.
The resulting Daily Candle is a Doji, suggesting that the market is currently in a base-building phase near significant support levels.
🛡 5 Min Intraday Chart with Levels
🛡 Intraday Walk
Today was defined by the “two-way business” typical of a major expiry.
The initial plunge was met with fierce buying, creating a high-volatility environment. The formation of the Double Bottom at 25,878 was the technical highlight, providing a solid floor for the bulls.
The most interesting action occurred in the final minutes, where a massive spike cleared the IBH, signaling that institutional players may be positioning for a recovery in the new year.
If today’s low holds, it could very well be the foundation for the next short-term bullish trend.
📉 Daily Time Frame Chart with Intraday Levels
🕯 Daily Candle Breakdown
Open: 25,940.90
High: 25,976.75
Low: 25,878.00
Close: 25,938.85
Change: −3.25 (−0.01%)
🏗️ Structure Breakdown
Type: Indecision candle (Doji).
Range (High–Low): ≈ 99 points — moderate intraday movement with high churn.
Body: ≈ 2 points — essentially no directional commitment between open and close.
Upper Wick: ≈ 36 points — rejection near the 25,977 resistance.
Lower Wick: ≈ 61 points — strong defense by buyers at the 25,878 level.
📚 Interpretation
The Doji formation following a period of bearish pressure is a classic signal of exhaustion among sellers. The long lower wick is particularly significant, as it shows that every attempt to push the market below 25,900 was met with aggressive buying.
This balance suggests that the market has found a temporary equilibrium, and the next directional move will depend on whether the index can reclaim the 26,000 psychological mark.
🕯 Candle Type
Doji / Long-Lower-Wick Indecision Candle — Signals a potential pause in the bearish trend; follow-through in the next session is critical for direction.
🛡 5 Min Intraday Chart
⚔️ Gladiator Strategy Update
ATR: 167.20
IB Range: 78.15 → Medium
Market Structure: Balanced
Trade Highlights:
10:21 Long Trade : SL Hit
13:28 Long Trade : Target Hit (1:2.18) (TrendLine + DB Pattern)
Trade Summary: An active day for the strategy. While the initial long attempt was caught in the morning’s volatile chop, the second trade was perfectly timed. By identifying the Double Bottom pattern and the trendline breakout at 13:28, the system captured a clean move back to the IBH, ending the session profitably.
🧱 Support & Resistance Levels
Resistance Zones:
26030
26070
26104 (Major Ceiling)
Support Zones:
25890
25860 ~ 25840 (Immediate Support)
25800
🧠 Final Thoughts
“The 26,000 barrier is the final test for the bulls.”
The yearly expiry has left us with a clear “Line in the Sand” at 25,878.
If Nifty can open above 26,000 and sustain that level tomorrow, we should expect a continuation of today’s late-session bullish sentiment.
However, the 25,890 ~ 25,875 zone must hold the fort; any breach here would invite a deeper test of the 25,800 territory.
✏️ Disclaimer
This is just my personal viewpoint. Always consult your financial advisor before taking any action.

YFI Buy/Long Setup (4H)Considering that we have a 3D at the bottom and the price has formed a bullish CH, on the pullback to the previous wave’s cheap zone, we can look for buy/long positions.
We have two entry points enter these points using DCA.
The targets are also marked on the chart.
Do not enter the position without capital management and stop setting
Comment if you have any questions
thank you


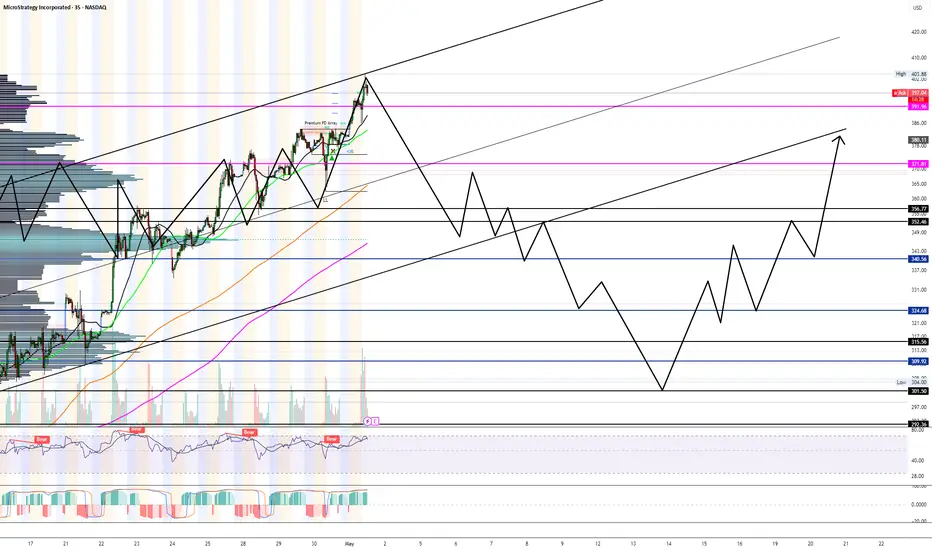
I think were due for bad earnings reaction for once.As seen in the chart, we are at the top of the range with highly over extended price movement and hitting the largest target number at $400 which has been sought after for months.
I think a snap down to $360-$350 is inevitable.
If we do pop up to $420+ then its a blow off top unless market reacts positively to government involvement to crypto.
WOO Buy/Long Setups (4H)The order blocks at the top of the chart have been consumed, and most sellers have lost a large portion of their orders.
Price has completed a strong CH and is currently trading around a key level. There is also a liquidity pool visible above the chart near the Swing High (SW H).
All of these signs indicate that if a pullback occurs, price could move back toward higher levels.
The targets are marked on the chart, but the main target is the red supply zone.
For risk control, a pullback is needed to enter at a more favorable price, since the invalidation level must be placed properly to avoid losses if price drops.
If a pullback occurs, we will enter a buy/long position.
For risk management, please don't forget stop loss and capital management
When we reach the first target, save some profit and then change the stop to entry
Comment if you have any questions
Thank You

CRYPTO VOLATILITY INCOMING!Over the last 6 weeks, price has been in a clear consolidation phase and historically, long periods of consolidation are followed by expansion and large moves.
From an ICT perspective, this phase often precedes manipulation, where price moves in the opposite direction of what most participants expect. My current bias is that we may see further downside first before the larger move to the upside however, it’s important to stay open-minded and adapt if that manipulation never comes.
In this video, I break down:
-Where price currently sits within the consolidation range
-The levels I’m watching for shorts and longs on Bitcoin
-How I’m positioning and managing risk if price moves lower
-The strategy I’m using as we approach potential expansion
This isn’t about predicting one outcome it’s about understanding market structure, liquidity, and probability, and staying patient while the market reveals its hand.
⚠️ Disclaimer:
I am not a financial advisor. The content shared on this channel is for educational and informational purposes only and should not be considered financial advice.
Trading and investing in cryptocurrency involve high risk — you could lose some, or all, of your money. Always do your own research and make sure you understand the risks before making any financial decisions.

us30 short idea us30 could fall drastically if this happens we have nice area of interest and losts os ssl

SAND BuyLong Signal (4H)The market maker collected buy orders with a large bearish candle. This was a liquidity grab, as the origin of that bearish move was quickly mitigated.
After taking the low, price quickly reversed to the upside and formed a bullish CH.
We have two entry points and should enter the position using DCA.
There are two targets marked on the chart that we are waiting to be hit.
If you would like us to analyze a coin or altcoin for you, first like this post, then comment the name of your altcoin below.

GBPUSD - Bullish ContinuationHTF structure remains bullish with price respecting higher-timeframe flow. The market continues to hold strength, and the overall narrative hasn’t changed — buyers remain in control.
Two positions are currently active, both aligned with the prevailing structure. I’m now simply waiting for continuation delivery as price works through its next phase. No rush, no forcing entries — just letting the market unfold as intended.
Structure is respected, bias remains intact, and momentum favors continuation.
Patience is key.
Tracking is the edge.
Let’s go. 🔥

AUDCAD - Bullish BiasHTF (4H) remains within a bullish range, consolidating near highs with strong volume support favoring continuation.
On the 30M, the OB has been mitigated from the marked zone, and we’re seeing LTF reaction off that area.
LTF (5M): still tracking alignment — waiting for a clean sweep into the OB before executing. Once that happens, I’ll look for confirmation to enter.
Patience is key.
Tracking is the edge.
Let’s go. 🔥

USDCAD - Bullish BiasHTF (4H) structure remains bullish. I’ve mapped it from the Daily to get a broader perspective — liquidity has been taken, leading price into a strong OB after the trap was set.
On the 30M, I’m watching for a midterm market structure shift. Once that confirms, I’ll define the internal OB and prepare for execution.
LTF (5M): after midterm alignment, I’ll wait for price to mitigate the zone, then look for a clear MSS and pullback into demand to take buy entries.
Until then, patience is key.
Tracking is the edge.
Let’s get it. 🔥

USDCHF - Bullish BiasHTF (4H) structure remains bullish, printing the same tape as last week — nothing has changed. Bulls remain in control as price was driven into a strong internal structure OB after taking out major IDM.
On the 30M, price has mitigated the OB with strong reaction off the wick, showing respect for the zone and confirming participation through volume.
LTF (5M): market structure shifts are forming, but after the initial sweep, probability isn’t fully aligned yet. I’m watching for deeper discounted territory and cleaner alignment across timeframes before engaging. All prior OBs have been mitigated — now it’s about patience and confirmation.
Until everything syncs up, I’m waiting.
Patience is key.
Tracking is the edge.
Let’s go. 🔥

Bank Nifty Weekly Outlook (29th Dec 2025 – 2nd Jan 2026)The Nifty Bank Index ended the previous week at 59,011.35, registering a marginal decline of –0.10%. The index is currently hovering around a critical price action zone, suggesting a decisive move could unfold in the coming week.
🔹 Key Levels for the Upcoming Week
📌 Price Action Pivot Zone (59,011 area)
This zone represents the immediate weekly decision point.
Sustaining above this region could attract fresh buying interest, while failure to hold may invite selling pressure.
🔻 Support Levels
Support 1: 58,555
Support 2: 58,224
Support 3: 57,893
🔺 Resistance Levels
Resistance 1: 59,402
Resistance 2: 59,777
Resistance 3: 60,144
📈 Market Outlook
✅ Bullish Scenario
If Bank Nifty sustains above the 59,011 pivot zone, the index may attempt an upward move toward Resistance 1 at 59,402.
A decisive breakout above this level could open the gates for 59,777, and further strength may push the index toward 60,144 in the coming weeks.
❌ Bearish Scenario
If the index fails to hold above 59,011 and slips below this zone, short-term weakness could drag prices toward Support 1 at 58,555.
Further breakdown may test 58,224 and 57,893. A weekly close below 57,893 would indicate a deeper corrective phase ahead.
Disclaimer: aliceblueonline.com

Nifty 50 Weekly Outlook ( 29th Dec 2025 – 2nd Jan 2026)The Nifty 50 Index ended the previous week near 26,042, showing consolidation after a strong upward move. The index is currently hovering around a critical price action pivot, which will decide the next directional move.
🔹 Key Levels for the Upcoming Week
📌 Price Action Pivot Zone (26,008 – 26,058)
This blue-shaded zone is the most important decision area for the market.
Sustaining above 26,058 can keep the bullish momentum intact.
Rejection or failure to hold below 26,008 may invite short-term selling pressure.
🔻 Support Levels
Support 1 (S1): 25,902
Support 2 (S2): 25,788
Support 3 (S3): 25,680
These levels may act as buy-on-dips zones if the broader trend remains positive.
🔺 Resistance Levels
Resistance 1 (R1): 26,141
Resistance 2 (R2): 26,240
Resistance 3 (R3): 26,320
These zones are likely to witness profit booking or supply pressure on upward moves.
📈 Market Outlook
✅ Bullish Scenario
If Nifty holds above the Price Action Pivot Zone (26,008–26,058), the index may attempt a move toward:
R1: 26,141
A sustained breakout above R1 can push Nifty toward R2 (26,240) and R3 (26,320).
❌ Bearish Scenario
If the index breaks and sustains below 26,008, short-term weakness may emerge, dragging Nifty toward:
S1: 25,902
Further breakdown may extend the decline toward S2 (25,788) and S3 (25,680).
📌 Conclusion:
The 26,008–26,058 zone remains the make-or-break level for the coming week. Traders should closely watch price behavior around this area for directional cues.
Disclaimer: aliceblueonline.com

EURUSD - Bullish ContinuationHTF (4H) structure remains bullish, with price driving toward higher objectives.
On the 30M, structure is aligned after the major LH break. Now waiting for a clean SSL sweep into the internal OB — sitting just beneath the inducement zone.
LTF (5M): once mitigation occurs into the bullish block, I’ll wait for a CHoCH and a clean pullback to execute buy entries.
Patience is key.
Tracking is the edge.
Let’s go. 🔥

EURGBP - Bullish ContinuationHTF (4H) showing bullish intent — waiting on full mitigation of the internal OB. This zone carries strong significance, mapped from higher timeframe structure with volume confirming sustained interest, making it a high-quality area to work from.
On the 30M, I’m looking for alignment confirmation — once the LH is broken, bullish bias is validated and continuation becomes favored.
LTF (5M): once the mid-zone is mitigated and a clear CHoCH prints, I’ll wait for a pullback into clean demand to execute buys.
Patience is key.
Tracking is the edge.
Let’s get it. 🔥

CADJPY - Bullish ContinuationHTF (4H) showing clean bullish structure — tape reading confirms strength and continuation intent.
On the 30M, structure remains bullish as price works toward the SSL. Waiting for price to dip into the internal OB test area before engagement.
LTF (5M): once mitigation occurs, I’ll wait for a clear LH break and pullback into the bullish leg — targeting liquidity above mid and HTF highs.
Patience is key.
Tracking is the edge.
Let’s get it. 🔥

GBPJPY - Bullish ContinuationHTF (4H) structure remains bullish, printing higher highs and higher lows with strong volume supporting key pivot points.
On the 30M, I’m waiting for a deeper pullback — looking for price to sweep SSL and tap into the underlying OB. Once full candle mitigation is confirmed, I’ll shift into execution mode.
LTF (5M): after mitigation, I’m waiting for a clean LH break followed by a pullback into fresh demand to take buy entries targeting mid and major highs.
Patience is key.
Tracking is the edge.
Let the market do the work. Let’s go. 🔥

AUDJPY - Bullish Continuation Setup4H HTF showing strong bullish momentum, with volume supporting higher lows and upside intent.
On the 30M, price is approaching the SSL sweep — looking for a pullback into the underlying OB. Once we get a full candle mitigation, I’ll drop to lower timeframes to assess reaction.
LTF (5M): waiting for a clean LH break followed by a controlled pullback to confirm entry.
Until then, patience is key — tracking the process and letting the setup come to me.
Let’s go. 🔥
