CMCT Squeeze Indicator AnalysisUsed the EMA 9, EMA 21, Squeeze Indicator, and ATR indicator to map out squeeze zones and price movement in the last month plus. The bulls over at CMCT have brass balls and diamond hands and have locked the float. Despite massive manipulation this thing is about to go to the moon. Last week they washed 60% SI down to 4% on Monday with no covering and just last Thursday accrued another 56% Live Short Interest just to suppress the momentum. The pressure cooker is boiling and the shorts keep trying to put the fire out with gasoline by continuing to short with 400% CTB. I am no chart guru, this is my first time posting a chart and my first time using any of these indicators. Regardless, Ive been hodling and accumulating for 2 weeks and can sense the shift. Now would be a great time to get in and HODL for 20+ Lets finish 2025 with a bang! BULLS UNITE!
Pivot Points
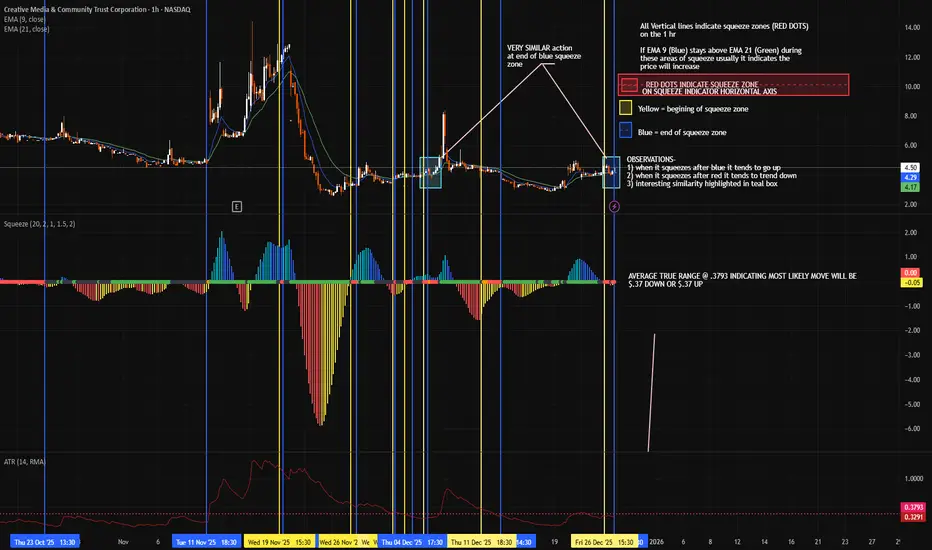
CMCT SQUEEZE IMMINENTUsed the EMA 9, EMA 21, Squeeze Indicator, and ATR indicator to map out squeeze zones and price movement in the last month plus. The bulls over at CMCT have brass balls and diamond hands and have locked the float. Despite massive manipulation this thing is about to go to the moon. Last week they washed 60% SI down to 4% on Monday with no covering and just last Thursday accrued another 56% Live Short Interest just to suppress the momentum. The pressure cooker is boiling and the shorts keep trying to put the fire out with gasoline by continuing to short with 400% CTB. I am no chart guru, this is my first time posting a chart and my first time using any of these indicators. Regardless, Ive been hodling and accumulating for 2 weeks and can sense the shift. Now would be a great time to get in and HODL for 20+ Lets finish 2025 with a bang! BULLS UNITE!

Nifty Analysis EOD – December 26, 2025 – Friday🟢 Nifty Analysis EOD – December 26, 2025 – Friday 🔴
Bears Breach 26,100: Psychological 26K Tested as Support Levels Crumble.
🗞 Nifty Summary
The Nifty started with a weak footing, opening below the PDL. Although it initially found support near 26,104 and attempted to fill the gap, a sharp rejection at the PDC pushed prices back down through the CDO, CDL, and the 26,104 level.
After a brief range-bound period near 26,070 where a symmetrical triangle formed, the subsequent breakdown dragged the index into the previous gap zone near 26,030. Following 45 minutes of high uncertainty and tight consolidation, a final leg down marked the day’s low at 26,008.60.
A late Bull Flag pattern facilitated a 50-point recovery, allowing the Nifty to close at 26,047.65, down -99.80 points (-0.38%). As predicted in our previous notes, the breakdown below 26,120 successfully triggered tests of 26,104 and 26,070.
🛡 5 Min Intraday Chart with Levels
🛡 Intraday Walk
The day was a masterclass in bearish control, with sellers swiftly grabbing 100 points of ground from the bulls.
The failure to sustain the initial gap-fill and the sharp rejection at the PDC set a negative tone that persisted for most of the session.
The symmetrical triangle breakdown and the subsequent uncertainty near 26,050 highlighted the lack of buyer conviction until the very end of the day.
The late recovery is a small silver lining, but the structural damage below 26,100 is evident.
📉 Daily Time Frame Chart with Intraday Levels
🕯 Daily Candle Breakdown
Open: 26,121.25
High: 26,144.20
Low: 26,008.60
Close: 26,042.30
Change: −99.80 (−0.38%)
🏗️ Structure Breakdown
Type: Bearish candle.
Range (High–Low): ≈ 136 points — moderate volatility.
Body: ≈ 79 points — reflecting clear selling pressure and bearish dominance.
Upper Wick: ≈ 23 points — weak buying attempt near the open quickly rejected.
Lower Wick: ≈ 34 points — buying interest emerged near the psychological 26,000 level.
📚 Interpretation
The market opened near 26,121 but failed to find any follow-through buying. Sellers maintained control throughout the session, pushing the price to the brink of the 26K mark. While the partial recovery from the lows shows that buyers are defending the psychological round number, the close remains significantly below the open. This structure reflects sustained short-term bearish pressure within the broader consolidation zone.
🕯 Candle Type
Bearish Candle with Lower-Wick Support Attempt — Signals selling dominance; buyers are active near lower levels but require a strong follow-up session to confirm a bottom.
🛡 5 Min Intraday Chart
⚔️ Gladiator Strategy Update
ATR: 173.50
IB Range: 72.65 → Medium
Market Structure: ImBalanced
Trade Highlights:
09:32 Short Trade: Target Hit (1:1.15) (PDL Breakout)
11:07 Short Trade: Target Hit (1:1.85) (Range Breakout)
13:45 Long Trade: SL Hit (Contra Trend)
Trade Summary: The strategy capitalized on the clear bearish intent early on, hitting targets on both the PDL breakdown and the mid-morning range breakout. However, the late-afternoon attempt to catch the contra-trend recovery resulted in a stop-loss hit as the market remained volatile near the lows.
🧱 Support & Resistance Levels
Resistance Zones:
26070
26104 (Major Polarity Resistance)
26155
Support Zones:
26030
26000 (Psychological)
25985 ~ 25965 (Critical Defensive Zone)
🧠 Final Thoughts
“The 26,000 psychological zone is the next battleground.”
The upcoming session will be tricky.
While 26K acts as a psychological cushion, the structural momentum is currently with the bears. We must wait for the opening tick and the formation of the Initial Balance (IB).
I am expecting a potential test of 25,985; if we see recovery signs there, a relief rally could be in the cards.
However, any failure to reclaim 26,104 will keep the pressure firmly on the downside.
✏️ Disclaimer
This is just my personal viewpoint. Always consult your financial advisor before taking any action.

Bitcoin – The Big Liquidity Hunt is Coming!Bitcoin's price is controlled by banks and governments. They won't allow the price to move until they have acquired the liquidity they need.
Before trading, you should always think about where most retail traders have placed their stop losses. They don't care if you lose; they're after liquidity.
But if you can identify these liquidity pools, you can ride along with the big banks and institutions and profit.
If technical analysis accounts for 20%, psychology is 80% of the story.
The timeframe for this analysis is 4 hours
On the chart, we've marked liquidity pools places where most traders have set their stops with $$$ signs.
The price has been ranging in this zone for 36 days. What happens each time? Liquidity pools form, these pools get swept, and then the price moves.
Now, the liquidity pools we've marked at the lows in red have not yet been swept, and most traders in long positions have their stops just below these two lows. The range from 83,764 to 82,412 is exactly where long traders’ stop losses will be hit, short positions will increase in size, and it is the best zone for a trend reversal.
There are many traders with a bearish view on Bitcoin but guess what happens if these two lows are hit? Longs get stopped out, traders in short positions either add to their size or new shorts join in—and that is exactly where the price will bounce back upwards.
Trading is not hard or complicated if you have a professional coach.
If you have a coin or altcoin you want analyzed, first hit the like button and then comment its name so I can review it for you.
This is not a trade setup, as it has no precise stop-loss, stop, or target. I do not publish my trade setups here.

FREE SUPPORT and RESISTANCE Indicator to Identify Key Levels
In this article, I will show you a simple technical indicator that will help you to identify support and resistance levels easily trading any financial market.
And what I like about this indicator is that it is absolutely free and it is available on all popular trading platforms: tradingview, meta trader 4, meta trader 5, etc.
This indicator is called Zig Zag.
After adding the indicator, the price chart will look like that.
First, I recommend changing its settings .
Price deviation - 1.5
Pivot legs - 5
Here are the inputs that I recommend for structure analysis on a daily time frame.
And in style remove labels because they really distract.
What this technical indicator does, it underlines the significant impulse legs. The completion and initial points of the impulses will be the important structures.
Your key structures will be the areas based on the initial/completion points of impulses based on wicks and candle closes.
A key horizontal support will be based on the initial point of the impulse and the lowest candle close.
Key supports will be all the structures that are below current price levels.
A key horizontal resistance will be based on the initial point of the impulse and the highest candle close.
Key resistances will be all the structures that are above current price levels.
Also, the completion/initial points of the impulses will occasionally compose the vertical structures - the trend lines.
Underline all the supports/resistances based on Zig Zag indicator.
All these structures are significant and can be applied for pullback/breakout trading.
Also, remember that you can modify the inputs of the indicator.
Increase Price deviation and Pivot legs number will show the stronger structures, while decreasing these numbers, more structures will appear on the chart.
On the left chart:
Price deviation - 1.5
Pivot legs - 5
On the right chart:
Price deviation - 5
Pivot legs - 10
The right chart shows just 2 structures, but very important ones.
This indicator is very powerful and it can help you a lot in learning structure analysis.
❤️Please, support my work with like, thank you!❤️
I am part of Trade Nation's Influencer program and receive a monthly fee for using their TradingView charts in my analysis.

STABLE Looks Bullish (4H)A large portion of the trading wick has been filled. The price has moved back upward and is now trading on a key level. A bullish CH (Change of Character) has also formed.
Alongside these bullish signals, a 3D pattern is visible, indicating the liquidation of sellers.
We have identified two entry points; if the price pulls back to these levels, we will enter the position using DCA.
Targets are marked on the chart.
Do not enter the position without capital management and stop setting
Comment if you have any questions
thank you

BAND Analysis (4H)An important trigger line has been broken, and the price has also formed a bullish CH.
Buyer momentum looks strong as well. The structure shows a BAND pattern, which supports long/buy positions. Therefore, we are looking for long/buy positions in the support zones.
The targets are marked on the chart.
We have two entry points, and the position should be entered using DCA.
A daily candle closing below the invalidation level will invalidate this analysis.
For risk management, please don't forget stop loss and capital management
When we reach the first target, save some profit and then change the stop to entry
Comment if you have any questions
Thank You

SYN Analysis (4H)Considering the sweep of the liquidity pool, a strong CH, and the creation of higher lows, the price structure appears bullish. Therefore, we are looking for a long/buy position in the demand zones.
We have two entry points, and if the price pulls back, we will enter the position.
The targets are marked on the chart.
A daily candle closing below the invalidation level will invalidate this analysis.
For risk management, please don't forget stop loss and capital management
When we reach the first target, save some profit and then change the stop to entry
Comment if you have any questions
Thank You

SUN Analysis (1D)The structure on higher timeframes is still bullish, but the internal structure is bearish. It is expected that the internal structure will remain bearish until the entry points we have identified.
After sweeping the liquidity pool marked on the chart and reaching our entry points, the price is expected to react and move upwards.
A long position can be taken on spot. We have identified two entry points, and the targets are also marked on the chart.
A daily candle closing below the invalidation level will invalidate this analysis.
For risk management, please don't forget stop loss and capital management
When we reach the first target, save some profit and then change the stop to entry
Comment if you have any questions
Thank You

AKE Analysis (4H)Due to the large AKE ranges and the high volatility of this coin, this signal is only suitable for spot trading.
All upper supply pivots on the chart have been consumed, and price is currently trading above key levels. We also have a bullish CHoCH on the chart; therefore, within this structure, we are looking for buy/long positions.
Additionally, a strong liquidity pool at the lows has been swept.
The targets are marked on the chart, with the main target potentially being the highlighted supply zone.
If we are fortunate and price forms a pullback, we will enter the position at the two specified entry points.
Do not enter the position without capital management and stop setting
Comment if you have any questions
thank you

DUSK Buy/Long Signal (4H)Considering the liquidity sweep at the bottom, followed by the formation of a large bearish candle and then its engulfment with the formation of a bullish CH, we can look for buy/long positions on the pullback to the support zones.
We have marked two entry points on the chart, which should be entered using DCA.
The targets are also marked on the chart.
Do not enter the position without capital management and stop setting
Comment if you have any questions
thank you

JTO Buy/Long Signal (4H)JTO is currently at key levels and we have a bullish CH on the chart. Above the current price the CP move appears as a spike which indicates there is no significant resistance.
On pullbacks to the support zones we can look for buy or long positions.
The targets are marked on the chart. Take partial profit at the first target and move the stop loss to breakeven.
Do not enter the position without capital management and stop setting
Comment if you have any questions
thank you

SANTOS Buy/Long Setup (4H)We have a strong CH on the chart and a strong upward reaction from the 0.768 Fibonacci level of the previous wave, which suggests that this drop may be a corrective move rather than a reversal.
On pullbacks into the support zones, we can take the risk and enter buy/long positions.
We have two entry points for entering the position, which should be done using DCA.
The targets are marked on the chart.
A daily candle close below the invalidation level will invalidate this analysis.
For risk management, please don't forget stop loss and capital management
When we reach the first target, save some profit and then change the stop to entry
Comment if you have any questions
Thank You

ENSO Buy/Long Setup (4H)Given that the price has formed a bullish CH, is sitting on a key level, and the order blocks above the chart have been exhausted, we can look to enter buy/long positions on a pullback into the support zones.
You should enter using DCA at the two specified entry points.
The targets are marked on the chart.
A 4-hour candle close below the invalidation level will invalidate this analysis.
For risk management, please don't forget stop loss and capital management
When we reach the first target, save some profit and then change the stop to entry
Comment if you have any questions
Thank You

XMR keeps failing at 450 resistance, is a major breakdown comingYello Paradisers— how many times can XMRUSDT hit the same wall before it collapses for good? The rejection from the 448 to 450 zone is starting to look like more than just noise.
💎XMRUSDT respected an ascending channel for a while but that structure has now clearly broken. The recent breakdown along with an internal CHoCH signals a shift in short-term momentum. The impulsive rejection has cooled off the buyers and the current consolidation just below the broken channel shows that sellers are gaining control while buyers struggle to hold ground.
💎After the breakdown, price made a corrective attempt but was quickly rejected again around the 0.5 to 0.618 Fibonacci retracement area. This zone has now become a supply region and continues to suppress any bullish attempts. As long as price stays under that structure with no strong bullish displacement the bias remains bearish with a likely push toward lower liquidity zones and key support levels.
💎This view changes only if price closes a strong candle above the 450 resistance. That would reclaim the previous range high, cancel the bearish structure shift and signal renewed bullish strength with potential to target higher liquidity above the current range.
🎖Right now is not the time for emotional moves. Stay calm and stay focused. We are only interested in the cleanest and most high probability setups. That is how you win in this game long-term.
MyCryptoParadise
iFeel the success🌴

NIGHTUSDTI've been eyeing this since yesterday. it's doing a CRT buy model if I am right. If checked on the the Daily TF, the previous candle was swept and it was on the POI which was the FVG, which adds up to the confluence as IPDA. I need to see it break to the swing high that swept the previous candle to confirm and look for entry.

GBPUSDThe price is in a corrective channel and can move downwards to the specified targets as long as it does not break the price ceiling.

Gold BuysGold reached another new ATH during Asia session.
We saw a retracement and price created an exhaustion zone during London session with it gracing that zone and rejecting, decided to take a buy.
we are doing a 1:5 RR however believe price could push all the way back to Asia high / exhaustion and beyond for the so called "Christmas Rally".

BCH Buy/Long Signal (4H)The structure of Bitcoin Cash is bullish and it continues to form higher highs and higher lows.
Each bullish wave in this fractal moves more than 1 percent and the previous lows are not taken. We expect the same behavior this time as well with the price rising at least 19 percent.
Therefore buy or long positions can be considered at the support levels of the previous wave.
The targets are marked on the chart.
Do not enter the position without capital management and stop setting
Comment if you have any questions
thank you

FILE COIN Buy/Long Signal (4H)Considering the bullish CH, the bearish candle being engulfed, and the formation of a CP move at the top of the chart, Filecoin may be preparing for a strong bullish move.
We have identified two entry points on the chart where you should enter the position using DCA.
The targets are marked on the chart, with the main target being the origin of the CP move.
Do not enter the position without capital management and stop setting
Comment if you have any questions
thank you

XPL Buy/Long Signal (2H)A liquidity pool has been swept, and we also have a bullish CH on the chart. After the price hit a lower-timeframe supply zone, it is now in a pullback phase.
We have two entry points on the chart where we should enter the position using DCA. The targets have been marked on the chart.
At the first target, make sure to secure some profit and then move the position to breakeven.
Do not enter the position without capital management and stop setting
Comment if you have any questions
thank you

LONG XAUUSDGiven the bullish market structure and the formation of higher highs, a corrective move is expected. A pullback into the 61.8–70% Fibonacci retracement zone, aligned with the bullish order block, could act as a strong demand area and offer a potential buying opportunity after confirmation.

NMDC LONG SETUPLogic: NMDC is on a uptrend on the daily time frame. The demand zone on marked levels has been formed as a RBR and near a prior pivot which has been violated, making it a good quality zone with an outside gap.
Retracement of the prices on this levels should be seen as a buying opportunity with R:R as 1:3 (trail further) and strict SL at the lower line.
It is also evident a stronger demand exist below that level which is a DBR formed due to the reaction of previous RBR. But if price retraces to the lower zone, then it means that the stock has already seen a bad move.
Betting on the marked zone may serve better.
