FARTCOIN buy/long setup (4H)Considering the strong bullish CH and BOS, the liquidity formed below the pivots, and the creation of a QM pattern, we can look for buy/long positions in the zone below the liquidity, which overlaps with the QM level.
Since the stop level is far, it is recommended to trade this setup on spot.
The targets have been marked on the chart.
A daily candle closing below the invalidation level will invalidate this analysis.
Do not enter the position without capital management and stop setting
Comment if you have any questions
thank you
Pivot Points

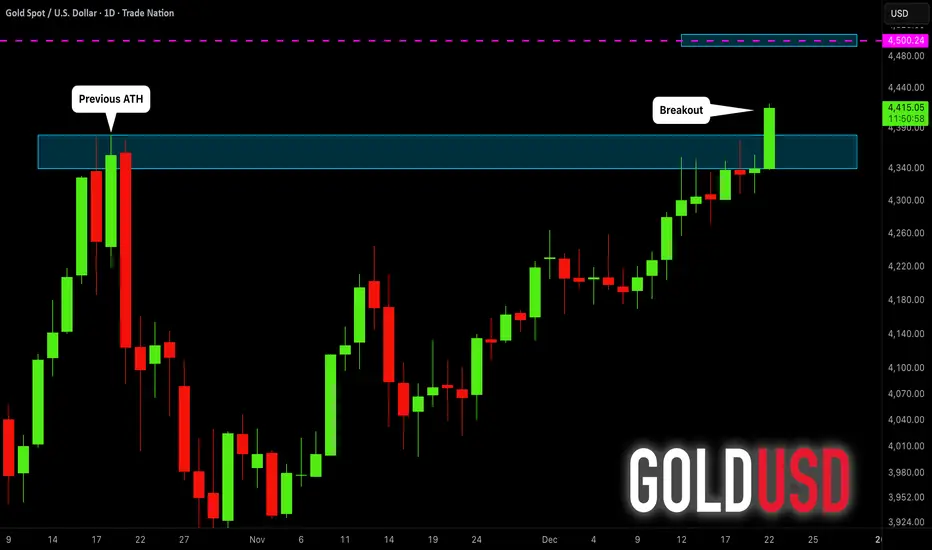
GOLD (XAUUSD): The Next Strong Resistance
As Gold has successfully updated the ATH today,
here is the next strong resistance that I see.
It is based on 4500 psychological level.
I believe that it will be the next goal for the buyers.
❤️Please, support my work with like, thank you!❤️
I am part of Trade Nation's Influencer program and receive a monthly fee for using their TradingView charts in my analysis.
Elite | XAUUSD | 4H – Weekly Market Structure Outlook New ATH |OANDA:XAUUSD
After rejecting from the ATH double-top region, price corrected deeply into higher-timeframe demand, where buyers regained control. The market respected trend support and printed a clean structural continuation, followed by consolidation and breakout. Current price is approaching a critical resistance band where reaction is expected before the next directional expansion.
Key Scenarios
✅ Bullish Case 🚀
If price holds above the recent breakout zone and shows acceptance:
🎯 Target 1: Previous ATH zone
🎯 Target 2: ATH extension
🎯 Target 3: New price discovery highs
❌ Bearish Case 📉
If price rejects strongly from resistance and breaks below the bullish structure:
🎯 Downside Target 1: Broken structure retest zone
🎯 Downside Target 2: Trend support / demand area
Current Levels to Watch
Resistance 🔴: ATH / Weekly supply zone
Support 🟢: Breakout base & ascending trend support
⚠️ Disclaimer: This analysis is for educational purposes only. It is not financial advice. Please conduct your own research before trading.

Elite | BTCUSD | 2H – Descending Structure Into Major DemandBITSTAMP:BTCUSD
After failing to hold above 92K–94K, BTC continued respecting the descending trendline, showing controlled sell pressure rather than panic. The current reaction at demand suggests sell-side liquidity has been tapped, but structure has not yet flipped bullish. Any upside move without a structural reclaim remains corrective until proven otherwise.
Key Scenarios
✅ Bullish Reversal / Expansion 🚀
Conditions (MANDATORY):
Strong 2H hold above 85,000
Break and acceptance above 88,500
Trendline breakout with follow-through
🎯 Target 1: 90,500
🎯 Target 2: 93,500
🎯 Target 3: 96,400 (major liquidity)
❌ Bearish Continuation 📉
Conditions:
2H close below 84,500
🎯 Downside Target 1: 82,800
🎯 Downside Target 2: 81,000
Current Levels to Watch
Resistance 🔴: 88,500 – 90,500 – 96,400
Support 🟢: 85,200 – 84,500 – 82,800
⚠️ Disclaimer: This analysis is for educational purposes only. It is not financial advice

PIPPIN Looks Bearish (12H)Before anything else, you should note that this token is very risky and highly volatile.
A trend break has occurred, a bearish CH was previously formed, and if you check the full PIPPIN data, you’ll see that it is at its previous ATH but showing bearish signals. All of this suggests that PIPPIN may experience deep drops in the near future.
We have two entry zones for sell/short positions, which should be entered using DCA.
The targets are marked on the chart.
A daily candle close above the invalidation level will invalidate this outlook.
For risk management, please don't forget stop loss and capital management
When we reach the first target, save some profit and then change the stop to entry
Comment if you have any questions
Thank You

USDJPY - 15/12/25 day tradeUS dollar was weak on the opening this monday morning with Asian session dropping. On the HTF there is a demand zone below that i am looking to grab a buy position to continue the upward climb on the USDJPY.
This day trade has price sweeping the low of the Asian session. therefore i am looking to grab a sell limit slightly high above with a continuation to the demand zone below.

HUDCO SHORT SETUPLogic: With HUDCO on continuous downtrend on the Monthly, Weekly and Daily timeframe, the setup may act much in favour.
As the stock is seeing some bounce from a demand zone after a long correction, a bounce towards 228 levels can be seen as a shorting opportunity for an R:R of 1:2.
A strong demand zone on daily time frame is present just below the marked levels, but considering the stock is bouncing from a demand zone of a higher timeframe it can pierce the daily supply zone and the marked levels can act as bull trap.
Also the marked levels coincide with a prior pivot which is broken by the move.

Nanocap Beast Poised for a Breakout?*Reuploaded - chart was recently deleted as I accidently used a paid indicator. However, this setup is looking really nice and still worth to follow. the analysis below is still relevant and now we wait to see how price reacts at the supply structure.
CZR is shaping up for a potential macro range breakout, and while the technicals are compelling, it's critical to acknowledge the elevated risk profile. As a nanocap, CZR demands disciplined risk management and precise position sizing.
Setup Options
Option 1: Aggressive Breakout Anticipation
Enter early if the current monthly candle closes above the yearly pivot ($0.26).
Stop Loss: $0.210 (tight and tactical).
Target: Initial TP at ~$0.70 (major supply zone), with full TP at the 100% macro range extension.
Option 2: Confirmation & Pullback Entry
Wait for a confirmed breakout and close above the range.
Enter on the first clean pullback.
Stop Loss: Based on structure formed during the pullback (can use the SL).
Target: Same as Option 1 — ~$0.70 and full range extension.
Option 3: Deeper Pullback & Reassessment
If price retraces deeper into the range, reassess the setup.
Look for signs of strength (e.g., volume spike, bullish divergence) before re-engaging particularly ~$0.135
This scenario may offer a better R:R if structure holds.
*please note arrows are not based on time analysis just market structure.

Nifty Probable price projectionIt is clear from the chart that nifty is taking resistance at current level.
case 1:
If price sustains above the pivot and the trendline price moves up
case 2:
If price sustains below the pivot and the trendline price may move down

'Two Charts, Same Pattern, Totally Different Market - Here's Why🔥 THE DEEPEST TRUTH MOST TRADERS NEVER LEARN: CONTEXT IS THE MARKET’S REAL LANGUAGE
If you stare at enough charts, you’ll start to see a pattern problem — and it’s destroying traders every single day. Everyone wants to react to what price looks like, instead of learning how price behaves.
Two charts can look exactly the same — same pattern, same shape, same pullback, same consolidation, same breakout — and still produce completely opposite outcomes.
Why?
Because context isn’t visual.
Context is structural.
Context is narrative.
Context is market psychology expressed through order flow.
A lot of traders are studying candles… but the candles aren’t the truth.
The phase is the truth.
The position inside the leg is the truth.
The liquidity story is the truth.
And if you don’t know the truth, the market punishes you.
⸻
🔥 THE DIFFERENCE BETWEEN WINNING AND LOSING IS NOT THE PATTERN — IT’S THE ENVIRONMENT
Let’s break it down clean:
A pullback inside a strengthened, impulsive uptrend is opportunity.
Smart money is reloading.
Volume supports the continuation.
Liquidity is building below swing lows.
The correction is healthy — supported by momentum, structure, and expansion.
But here’s the flip:
A pullback inside a weakened, distributive market is a death trap.
The leg is tired.
Momentum is fading.
Liquidity is drying out.
Smart money is offloading inventory — not accumulating.
To the naked eye, both pullbacks look the same.
To the trained eye, they couldn’t be more different.
This is why top-down analysis matters.
⸻
🔥 BREAKOUTS PROVE IT EVEN CLEARER
A breakout during a momentum phase is fuel.
It tells you price is expanding with force, not faking direction.
But a breakout inside distribution?
That’s manipulation.
That’s inducement.
That’s the market selling strength to buyers who don’t understand phase transitions.
From the outside, both breakouts look clean.
Both breakouts feel bullish.
Both breakouts trigger emotion.
But one breakout is confirming continuation —
The other breakout is preparing reversal.
And traders who don’t understand context end up buying the exact candle professional money is using to exit.
⸻
🔥 THIS IS WHY MOST TRADERS LOSE: THEY TRADE SHAPES, NOT STORIES
Most people can read candles.
Very few can read intention.
Most people see structure.
Very few understand order flow.
Most people memorize patterns.
Very few study phases, accumulation, distribution, inducements, and macro positioning.
And when you’re blind to context, price movement starts looking random — not because it is random, but because your process is incomplete.
⸻
🔥 TOP-DOWN ANALYSIS IS THE ANTIDOTE
When you move from 4H → 30M → 5M, the entire game changes.
You start seeing:
• What leg price is responding to
• Whether the move is correction or expansion
• Whether the premium/discount environment supports continuation or reversal
• Whether volume aligns with market direction
• Whether structural shifts have real intention
• Whether the pullback is healthy or distributive
• Whether you’re trading strength or exhaustion
This is not about finding entries.
This is about understanding story.
And when you understand the story, the market stops attacking you — it starts communicating with you.
That’s why I always say:
📌 Structure without context is noise.
📌 Patterns without narrative are traps.
📌 Entries without phase analysis are gambling.
⸻
🔥 SMART MONEY DOESN’T TRADE CANDLES — IT TRADES PHASES
Accumulation → Manipulation → Expansion → Distribution.
That cycle has existed forever — way before candlesticks, way before indicators, way before retail charts.
Jesse Livermore was teaching it 100 years ago without even using modern language:
Price doesn’t move because of patterns — price moves because of positioning.
And that’s the same message today, just spoken through volume, OBs, HTF narrative, inducements, liquidity sweeps, and structural transitions.
Context IS Smart Money Concepts.
Context IS the real edge.
Context IS the only reason price behaves the way it does.
⸻
🔥 FINAL MESSAGE FOR TRADERS: IF YOU CAN’T SEE CONTEXT, YOU’RE NOT SEEING THE MARKET
If trading feels confusing, unpredictable, inconsistent, emotional — it’s not because you’re bad at trading.
It’s because you’re trading charts instead of trading environments.
Two charts can be identical.
Only context tells you whether the pullback deserves your money —
or your patience.
Only context tells you whether the breakout deserves conviction —
or caution.
Only context tells you whether the structure deserves participation —
or avoidance.
Context tells the truth.
Everything else is noise.

AUDCAD - Bullish OutlookMulti-Timeframe:
Alignment is syncing — waiting for full confirmation before active execution.
HTF (4H):
Strong bullish structure intact — short and simple, momentum is clear.
Mid-Term (30M):
Applying continuation logic. Fresh SSL was taken, pushing price into the mid-term OB (orange zone). The zone has been refined to identify real smart money buy interest. Clean mitigation observed, waiting for trend change and sync back into bullish to catch the move without being in front of it.
LTF (5M):
Waiting for LH break to confirm intent and track the pullback for minor liquidity and buy points into the bullish leg. Price and volume will lead, along with smart money signals, until execution.
Patience is key.
Tracking is the edge.
Let’s go. 🚀

USDCAD - Bullish OutlookHTF (4H):
Strong bullish structure intact. Price swept previous structure and is now moving toward a strong test area, maintaining bullish intent.
Mid-Term (30M):
Waiting for alignment. Once LH breaks and trend change is confirmed, my interest becomes active. After the break, I’ll track price for fresh liquidity and OB mitigation before considering execution.
LTF (5M):
Once full alignment is in place, I’ll wait for the final CHoCH and pullback to identify buy points along the existing trend.
Patience is key.
Tracking is the edge.
Let’s go. 🚀

USDCHF - Bullish OutlookMulti-Timeframe:
Alignment intact — waiting for full sync before execution.
HTF (4H):
Bullish structure remains intact. Price is in a ranging environment but leaning bullish overall, showing strong structural support.
Mid-Term (30M):
OB has been mitigated, with bullish pressure visible in the orange zone to the left. Smart money engineered liquidity, leading price toward the LTF OB at the discounted origin zone.
LTF (5M):
Price is currently mitigating the internal OB near the origin block (green zone). I’m looking for full candle bodies inside the zone to confirm smart money intent. If not, I’ll continue tracking until a fresh BOS, clean POI, and liquidity levels form.
Patience is key.
Tracking is the edge.
Let’s go. 🚀

ZEC Sell/Short Setup (1H)Use this setup as a scalp, not a swing trade.
Since price has reacted to a major supply zone and has formed a CP pattern below the supply, a drop is expected.
Make sure to move your stop to breakeven at the first target.
The targets are clearly marked on the chart.
For risk management, please don't forget stop loss and capital management
When we reach the first target, save some profit and then change the stop to entry
Comment if you have any questions
Thank You

EURUSD - Bullish OutlookHTF (4H):
Bullish alignment restored. Price is heading toward the HTF objective at 1.19183, showing clean momentum.
Where the untrained eye might see confusion, the trained eye sees a guided navigation road map.
Mid-Term (30M):
CHoCH confirmed — previous strong LH has been taken out, leaving directional footprints and structure hints.
Now waiting on full candle mitigation inside the mid-term OB to align the next push toward the HTF objective.
LTF (5M):
Once price taps the zone, I’ll track for a minor LH break to confirm zone strength, with volume supporting interest for continuation.
Until then — patience is key.
Tracking is the edge.
Smart Money leads.
Let’s go. 🚀

EURGBP - Bullish OutlookHTF (4H):
Bullish structure is clean and controlled — rhythm is easy to read, directional intent is clear. I want to be part of that continuation phase once the lower timeframes sync.
Mid-Term (30M):
Previous week’s mid-term OB was violated, driving price directly into the stronger HTF OB below. Solid mitigation there. Now I’m expecting a mid-term CHoCH + LH break to flip structure back bullish. Until full alignment forms and the market syncs correctly, I’m staying patient and monitoring.
LTF (5M):
Once the 30m LH breaks, I’ll look for a fresh SSL and newly formed OB near the sweep. That’s when I’ll drop into LTF to confirm the flip and validate that mid-term zone is ready to hold and launch.
Patience is key. Tracking is the edge.
Let’s go. 🚀

CADJPY - Bullish OutlookHTF (4H):
Bullish momentum remains intact as price continues to build off previous week’s structure. Narrative is still expansion, nothing broken, no change in intent.
Mid-Term (30M):
Looking to join the continuation phase, but expecting distribution first. Waiting for bears to drive price lower to sweep liquidity (SSL) and deliver price into the mid-term OB. That’s the area I want to see mitigated before aligning with the next leg up.
LTF (5M):
Once price taps the mid-term zone, I’ll drop down for confirmation—LH break + full CHoCH to validate continuation and position flow. Until then, staying patient.
Patience is key. Tracking is the edge.
Let’s see what unfolds — let’s go.

GBPJPY - Bullish OutlookHTF (4H):
Market is in a clean expansion phase with strong volume supporting bullish momentum. New structure has formed, and the narrative remains continuation to the upside as long as current structure holds.
Mid-Term (30M):
Price has shown continuation flow, but I’m expecting short-term bearish movement first — a drive lower to sweep liquidity and complete full SSL into the OB below. Once that zone is fully mitigated (candle bodies included), next step is confirmation for continuation.
LTF (5M):
Waiting on a CHoCH and LH break to align with the broader narrative. From there, I’ll focus on recent liquidity structure + fresh OB development for potential execution.
Patience is key. Tracking is the edge.
Let’s see what this week offers — let’s work.

AUDJPY - Bullish OutlookHTF (4H):
Price remains bullish with clean continuation flow to the upside. Current leg is expanding with strong momentum, and the next HTF objective is 104.402.
Mid-Term (30M):
Price pushed higher into continuation structure, and we saw mitigation of the refined orange OB. That zone held clean with solid volume follow-through — supporting ongoing upside intent. Market structure remains aligned with the HTF expansion narrative.
LTF (5M):
A clean CHoCH formed as the major LH was taken, opening the path for continuation toward the highs. I’m still tracking price closely for deeper mitigations into LTF OBs before considering execution — letting price come to me rather than chasing early imbalance.
Plan:
Patience stays the key. Tracking is the edge. Waiting for price to sweep and deliver a cleaner OB mitigation before stepping in. The bullish narrative remains intact until proven otherwise.
Let’s see what the week delivers — focus and execution.

USDJPY - HTF Bullish Narrative + IDM Mechanics + LTF OutlookHTF (4H):
Structure remains bullish.
HTF external liquidity target sits at 157.905 with market intent showing continued expansion toward that level.
⸻
Mid-Term (30M):
Price is holding previous week’s structure and continuing its bullish progression toward mid/HTF highs. We saw mitigation of the refined OB before price reversed, using IDM to pull traders into the refined zone and engineer liquidity for continuation.
⸻
LTF (5M):
Major CHoCH swept inducement and engineered liquidity beneath the move. Strong volume and candle exhaustion show clear bullish intent reacting off the green zone.
Entry was possible there, but I chose discipline — I want full alignment before stepping in.
⸻
Expectations:
Looking for a fresh LTF liquidity sweep to lead price back into a clean LTF OB, which aligns with imbalance on the zoomed-out structure.
This week, it’s patience:
Track → Align → Execute.
Let’s see how price delivers.
Until then — patience is key, tracking is the edge.
Let’s go. 🚀

LONG TRADE- AB CAPITALLong Idea ABCAPITAL
Idea: With AB Capital retracing down, the marked levels may act as strong support zone.
As the zone is on Weekly demand zone too.

APT Buy/Long (4H)A solid structure shift has occurred on the chart, and a liquidity pool is visible above. If price reaches our entry zones before touching the supply area, we will enter the position.
We have two entry points, and we will enter using a DCA approach.
The targets are marked on the chart.
A daily candle close below the invalidation level will invalidate this analysis.
For risk management, please don't forget stop loss and capital management
When we reach the first target, save some profit and then change the stop to entry
Comment if you have any questions
Thank You

EURUSD: Support & Resistance Analysis For Next Week 🇪🇺🇺🇸
Here is my latest structure analysis and important
supports and resistances for EURUSD for next week.
Consider these structures for pullback/breakout trading.
❤️Please, support my work with like, thank you!❤️
I am part of Trade Nation's Influencer program and receive a monthly fee for using their TradingView charts in my analysis.
