$ZETA good place to build positionNYSE:ZETA is checking back into prior resistance / upsloping support. good place to enter a defined trade. Exit position with a weekly close below key trendlines.
Beware of upcoming earnings if you don't want to hold long term
Pivot Points

GDX – Gold Miners Beta to BullionVanEck Gold Miners ETF (GDX) tracks a basket of global gold mining stocks, typically offering higher beta and volatility than spot gold ETFs. This chart is for capturing leveraged exposure to the gold theme: I’m marking structural demand zones, prior capitulation lows, and breakout levels to time long entries when miners begin to outperform bullion.

GOLD(XAUUSD): +8000 Pips Possible Swing Buy, Is This Possible?Dear Traders,
The market has been extremely volatile recently, fuelled by widespread uncertainty. Trading in these conditions is extremely dangerous and could easily wipe out your accounts. However, we see an excellent opportunity. The price could drop around $4740, which would be a critical level for a price reversal and a potential all-time high.
We recommend waiting for the price to reach this level before trading gold today.
Team Setupsfx_


XAUUSD: Trend in 4-H timeframePlease pay special attention to the accurate trend, and magic colored levels.
Its very sensitive setup, ...............<<<<<<<<<<<<<<<<<<<<<<<
Be careful
BEST
MT

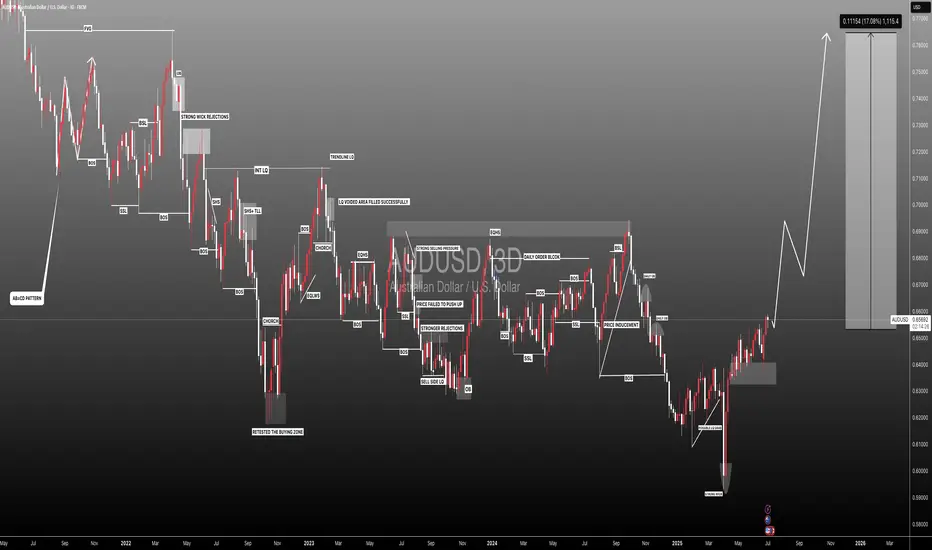
#AUDUSD: +1100 Pips Possible Swing Bullish Move! AUDUSD a strong sign of bullish behaviour has appeared alongside bullish momentum. As we have NFP tomorrow, we expect market to remain volatile; what we think now is to have market settled down before we can have any confirmation. We recommend to remain extra cautious tomorrow, once market get settled we can then enter with accurate risk management.
Like, comment and Share for more!
Team Setupsfx_
GBPCAD: Perfect Buying Opportunity In Making Worth 1000+ PipsDear Traders,
The GBP/CAD pair is at a turning point, and it might just reverse! Recent market data indicates a strong upward trend, with the pair gaining over 1000 pips in the last cycle. This surge is backed by increasing trading volume and a convincing week-closing candle, with smaller timeframes also showing the momentum shift.
📌Looking at the financial side, the pair has appreciated by 6% from 1.6700 to 1.7700 over the past month. Average daily trading volume has increased by 18%, and the volatility spikes have created swing opportunities. The 14-day ATR is 0.0125, suggesting a daily range of about 125 pips. Monthly pivot levels hint at possible support around 1.7450 and resistance at 1.7850, which aligns with our target zones.
📌We’ve identified two target levels: near 1.7800 and around 1.7950. If the price breaks through the initial resistance, momentum could push towards the higher target, potentially adding 150 pips. Traders holding standard lot positions could expect a gross movement value of £1,000 per 100 pips, assuming proper risk management.
📌Recent economic data seems to favour the GBP. The Bank of England’s focus on controlling inflation and the slight contraction in Canadian trade balances support this. The CAD’s connection to crude oil is still a factor, and any drop in oil prices could further boost GBP gains. Overall, the forex market’s liquidity conditions suggest that GBP/CAD is sensitive to macroeconomic catalysts.
Trading Plan📊🧠
- Use the 4-hour timeframe to find an ideal entry point near the 1.7500 support area.
- Aim for a risk-to-reward ratio of at least 1:2, considering a larger stop-loss of 80–100 pips to handle volatility spikes.
Set your first take-profit at 1.7800 and think about closing a portion of your position. If the price action confirms the breakout, adjust your stop-loss to breakeven and target 1.7950 as your secondary goal. Keep an eye on volume and candlestick patterns around key levels, as these will help you decide whether to extend or close your swing trade.
Good Luck Trade Safe, For More Like And Comment ;
Thank you ❤️
Setupsfx_

#EURUSD: Three Take Profit With One Swing Entry! 2026 TargetDear Traders, 🚀
Hope you are doing great, we have an excellent opportunity coming up for EURUSD, buying at our buying zone can be beneficial for swing traders. There is one entry zone, and there are three targets or take profit points. We are expecting the trade to completed by end of the year.
We will keep you all updated❤️
Team Setupsfx_

Key Levels & Bias — XAUUSD (Gold)Timeframe: 1H
Date: 30 Jan 2026
Update: Intraday
🔹 Bias
Bullish Reversal (Buy the Dip – Conditional)
🔹 Key Levels
Resistance / TP Zone: 5514.30
Major Supply Above: 5580 – 5600
Strong Demand / Support Zone: 5000 – 5100
Current Price Area: ~5087
🔹 Technical Context
Price corrected sharply after a parabolic rally.
Market is testing a high-probability demand zone.
Trendline broken → focus shifts to horizontal structure.
Projection suggests W-formation / double bottom potential.
🔹 Trade Idea (Not a Signal)
Prefer buy confirmation from demand.
Entry only after bullish structure shift / confirmation.
Conservative traders wait for 15m confirmation candle.
⚠️ Risk Note
Strong bearish momentum recently.
Avoid blind entries — confirmation is key.
Disclaimer ⚠️: This is not a financial advice

Short Initial target $99LEG 1: Silver careering down towards the first target at $99
LEG 2: On break of channel $80 comes into play.
LEG 3: Price stabilisation around $60.

$TSLA looks "Cheap" but it can always get cheaperTSLA has been consolidating in a flag here. While price could break up out of it, I actually lean towards price breaking to the downside. The reason is because there have been more tests on the downside, and I think if price falls and tests it again, it'll break.
That and, if you turn on Heikin Ashi candles, it looks like bearish momentum is starting on higher timeframes (1D-4D) and Ichimoku giving bearish warning signals in the cloud formation.
I think the most likely outcome is that we break lower and go test the box below for a new low. Everyone would get bearish down there, but that will be a great level to buy for the long term.

ETH Sell/Short Setup (4H)Based on the price reaction at the FLIP zone, the loss of the ascending trendline, and the formation of a bearish CH (Change of Character), it seems that bearish momentum is starting to take control of the market. These factors together suggest a potential shift in market structure in favor of the sellers.
We have marked two red dashed lines on the chart, which represent our planned entry zones. These areas are selected based on structure and price behavior, not emotions or anticipation.
The targets are clearly defined and labeled on the chart in advance. Risk management is a priority in this setup. Once Target 1 is reached, the position should be moved to break-even in order to protect capital and eliminate downside risk.
If the stop loss is triggered, it simply means we are out of the trade—no revenge trading, no overthinking. This is part of the plan and must be respected.
Now we wait and let the market decide. Patience and execution matter more than prediction.
Normally, we do not share such clean and straightforward setups here. This example is posted purely for educational purposes, to demonstrate how we approach structure-based trading and risk management.
Let’s see how price reacts and what the market delivers.
If you have a coin or altcoin you want analyzed, first hit the like button and then comment its name so I can review it for you.
This is not a trade setup, as it has no precise stop-loss, stop, or target. I do not publish my trade setups here.

$SPY the beginning of a covid style selloff? 20-32% drop?It is finally time for a larger selloff to happen. As you can see, we've broken down out of a rising wedge and many people are calling for another scenario to buy the dip, but this dip doesn't look the same as all of the other dips.
To me, this looks more like the start of a larger selloff. My thesis is that this selloff will be a cross between the selloff that took place in 1989 and covid. I think we're about to see a 20-32% drop that comes very quickly not giving people time to get out.
The past two days we're already trading exactly like we did in covid, where we can see sharp rallies that are met with more selling.
The reason this selloff is different is because volatility is starting to react and I have strong buy signals on the weekly timeframe while I'm getting weekly sell signals on SPY.
While my base case was that we'd only get a 20% selloff down to the $550-560 area on the chart, I won't rule out the possibility of the market selling off to the next support level down at $468-$481.
The selling should get stronger once we're under the $666-672 level and volatility will start to rise quickly. Under the $650 level should be lights out for the market.
Again, I think this selloff is going to happen very quickly over the next few weeks, so I'd be cautious buying any dips.
Let's see how it plays out.

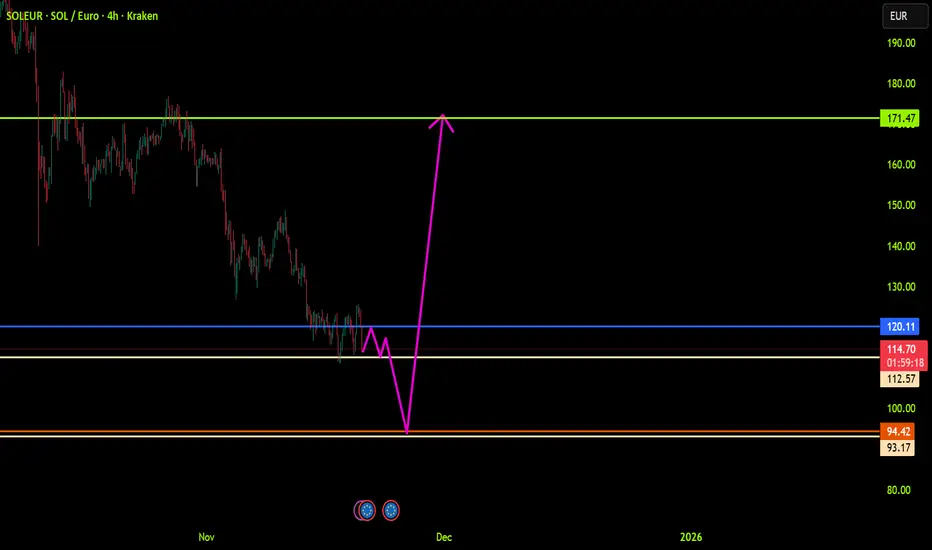
SOLEUR: Trend in 4-H time frameThe color levels are very accurate levels of support and resistance in different time frames.
A strong move requires a correction to major support and we have to wait for their reaction in these areas.
So, Please pay special attention to the accurate trends, colored levels, and you must know that SETUP is very sensitive.
BEST,
MT
VRAUSDT: Trend in weekly time frameThe color levels are very accurate levels of support and resistance in different time frames, and we have to wait for their reaction in these areas.
So, Please pay special attention to the very accurate trend, colored levels, and you must know that SETUP is very sensitive.
Be careful
BEST
MT

XAUUSD: Trend in 4-H timeframePlease pay special attention to the accurate trend, channels, and magic colored levels.
Its very sensitive setup, ...............<<<<<<<<<<<<<<<<<<<<<<<
Be careful
BEST
MT

YM (US30): Trend in 4H-time framePlease pay special attention to the accurate trend, channel, and magic colored levels.
Its very sensitive setup, ...............<<<<<<<<<<<<<<<<<<<<<<<
Be careful
BEST
MT

XAUUSD Dump | 29th Jan 2026 XAUUSD (30M)
Key Levels – Dynamic Bias
Resistance: 5540 – 5570
Support: 5300 – 5330
Market Bias: Bearish Favor 📉
Structure:
• Head & Shoulders / Double Top at highs
• Ascending trendline broken
• Price retesting underside of structure
Expectation:
Rejection from resistance → continuation toward support

USDJPY H1 – Price Reaction at Key Levels (29/01/2026)USDJPY is analyzed on the 1-hour timeframe (H1).
The market is currently trading within a broader bearish environment, as price remains below the higher-timeframe moving average and has previously produced a strong impulsive move to the downside. After that impulse, price entered a corrective phase.
On the H1 timeframe, USDJPY formed a short-term bullish correction from the recent swing low, creating higher highs and higher lows. However, this move stalled after reacting into a supply zone aligned with the previous bearish leg. The rejection from that area indicates selling pressure is still active.
Price is now pulling back from the supply zone and moving toward the lower demand area marked on the chart. This zone previously acted as a reaction point and may be used as a reference for trade management or further confirmation.
As long as price remains below the recent swing high and below the higher-timeframe resistance, the bearish scenario remains valid. A clear reaction or structure shift around the demand zone will be important for the next directional move.
This idea is based on market structure, supply and demand, and price reaction on the H1 timeframe, without relying on indicators or predictions.
This is a technical analysis idea for educational purposes, not financial advice.

AUDNZD H1 Trend Following Pullback SetupThis chart presents a trend-following continuation setup on AUDNZD using the H1 timeframe.
Price is trading in a clear bullish structure, with higher highs and higher lows maintained above the main dynamic support. After a strong impulsive move, the market pulled back into a key support area within the trend, where buying pressure began to reappear.
The highlighted zones illustrate the expected continuation area to the upside and the invalidation area if the pullback structure fails. The setup focuses on participating only in the direction of the dominant trend and avoids counter-trend conditions.
A management rule is applied: if price reaches the management zone before triggering the planned entry, the setup is considered invalid and should be ignored. This helps maintain consistency and risk control across similar scenarios.
This idea is shared for educational and analytical purposes only and reflects one possible interpretation of market structure under trending conditions.

Nifty Analysis EOD – January 29, 2026 – Thursday🟢 Nifty Analysis EOD – January 29, 2026 – Thursday 🔴
The Great V-Shape: Bulls Absorb 200-Point Panic to Close above PDH
🗞 Nifty Summary
The Nifty delivered a masterclass in market psychology today.
Opening flat with a bearish tilt, the index witnessed a sudden, high-velocity 200-point plunge from the first tick, slicing through the PDL to test the 25,180 support zone. This move acted as a massive liquidity hunt, trapping aggressive bears before forming a solid “Cup and Handle” base.
The recovery was as fierce as the fall; at 12:30 PM the C&H pattern broke out, followed by a 1:00 PM surge that reclaimed the Long-Term Trendline, the 25,310 ~ 25,335 zone, and the PDH.
Nifty successfully hit our 25,430 target, marking a day high of 25,458.15 and closing strongly at 25,418.90 (+0.30%).
The daily chart has printed a powerful Bullish Engulfing candle, resetting the stage for the pre-budget session.
🛡 5 Min Intraday Chart with Levels
🛡 Intraday Walk
The day was a “tale of two extremes.”
The morning’s 200-point slide was a reminder of the volatility that precedes major events like Budget-26.
However, once the 25,160 zone held, the structural repair was flawless. The breakout at 1:00 PM was a high-conviction “all-in” move by the bulls, where four major technical hurdles (Trendline, Resistance Zone, IBH, and PDH) were cleared in a single momentum burst.
Despite the early chaos, the index ended where the structure demanded—at the next expansion level of 25,430
📉 Daily Time Frame Chart with Intraday Levels
🕯 Daily Candle Breakdown
Open: 25,345.00
High: 25,458.15
Low: 25,159.80
Close: 25,418.90
Change: +76.15 (+0.30%)
🏗️ Structure Breakdown
Type: Bullish Engulfing / Rejection Candle.
Range: ≈ 298 points — extreme intraday volatility.
Body: ≈ 74 points — moderate strength, but significant given the context.
Upper Wick: ≈ 39 points — minor profit-booking at the 25,450 hurdle.
Lower Wick: ≈ 185 points — massive rejection of lower prices (The “Spring”).
📚 Interpretation
The Bullish Engulfing structure on the daily frame, combined with the 185-point lower wick, signals a definitive failure of the bears to sustain the breakdown.
This “V-Shape” recovery usually indicates that the “weak hands” have been shaken out.
The fact that Nifty closed near the day’s high despite such a deep early draw-down is a testament to the underlying demand ahead of the February 1st event.
🕯 Candle Type
Bullish Rejection / Engulfing Candle — Shows extreme resilience; continuation is the primary bias, though a consolidation “breather” is expected tomorrow.
🛡 5 Min Intraday Chart
⚔️ Gladiator Strategy Update
ATR: 259.82
IB Range: 199.95 → Big
Market Structure: Balanced
Trade Highlights:
10:13 Long Trade: SL Hit (Early mean-reversal attempt caught in the initial flush).
11:07 Long Trade: Target Hit (1:1.75) (Channel & Zone Breakout).
13:02 Long Trade: Target Hit (1:3.41) (Trendline Breakout).
Trade Summary: A high-conviction day for the Gladiator Strategy. While the initial volatility took out an early stop-loss, the system stayed disciplined, re-entering as the recovery structure matured. The 1:00 PM breakout was the “trade of the week,” delivering a 1:3.41 R:R as the market aggressively reclaimed the trendline.
🧱 Support & Resistance Levels
Resistance Zones:
25,495 ~ 25,515 (Psychological)
25,585 ~ 26,605
25,650 ~ 25,670
Support Zones:
25,335 ~ 25,310 (Flipped)
25,270
25,190~ 25,180
25,060
🧠 Final Thoughts
“Panic is the bulls’ greatest fuel.”
We successfully hit the 25,430 level, but the journey was a reminder to stay prepared for anything.
Our next psychological hurdle is the 25,495 ~ 25,515 zone. If breached, 25,605 is the final fort.
However, with only one session left before the Budget-26 event, I expect a “silent” session tomorrow—characterized by narrow-range consolidation as the market pauses to catch its breath.
Stay disciplined and don’t chase the noise.
✏️ Disclaimer
This is just my personal viewpoint. Always consult your financial advisor before taking any action.

#GBPUSD: Three Targets Swing Buy 720+ Pips Move **Trading Setup For GBPUSD 1 Daily Time Frame**
🔺After a while where the price was mostly down, it hit a low of 1.30 but then turned around. Since then, it has been climbing steadily, with little dips that have only made it go higher. Right now, it is at 1.3490, which we think is a good time to start a long position in GBPUSD.
🔺Trading at the current price is a smart move because the price is up, which helps keep our risk in check and makes the trade more likely to succeed. We can put a stop-loss order below the blue line we marked.
🔺To make some money, we have set three goals. First, we aim for 1.3657, which is a big wall that the price needs to get over. Once it does, we can look at the second goal, which is 1.42. We will keep doing the same thing until we reach our final goal of 1.42.
🔺We would love for you to like and comment on our analysis, as it helps us make more content. Thanks so much for your support!
Sincerely,
Team SetupsFX_🏆❤️
