EURUSD | HTF Reaction Zone in Play - Waiting for confirmation💱 Ticker: EURUSD
🧠 Description:
Price is currently reacting within a higher timeframe reaction zone, showing signs of potential continuation.
From here, I’m watching for either a change of character (CHoCH) to confirm early bullish intent,
or a deeper mitigation into the HTF POI before continuation.
This area holds significance — how price behaves here will set the tone for the next leg.
Patience and precision over prediction.
Pivot Points

EURUSD for a short term reversal Looking at EURUSD to continue its reversal a little further, before resuming its downtrend
Scenario 1 :
Price reacts to the lower daily OB and the week opens low so we can go get some liquidity in the FVG we left open from last week
That would give it some fuel to keep going higher a little more and hit the liquidity on the upside
In this case we could take some longs from that FVG back to previous week high
Scenario 2 :
We open higher, and then I'd expect a mean reversal back to previous week low,
In any case i'll be prepared

USDCHF Long Selling IdeaHello Traders
In This Chart USDCHF HOURLY Forex Forecast By FOREX PLANET
today USDCHF analysis 👆
🟢This Chart includes_ (USDCHF market update)
🟢What is The Next Opportunity on USDCHF Market
🟢how to Enter to the Valid Entry With Assurance Profit
This CHART is For Trader's that Want to Improve Their Technical Analysis Skills and Their Trading By Understanding How To Analyze The Market Using Multiple Timeframes and Understanding The Bigger Picture on the Chart

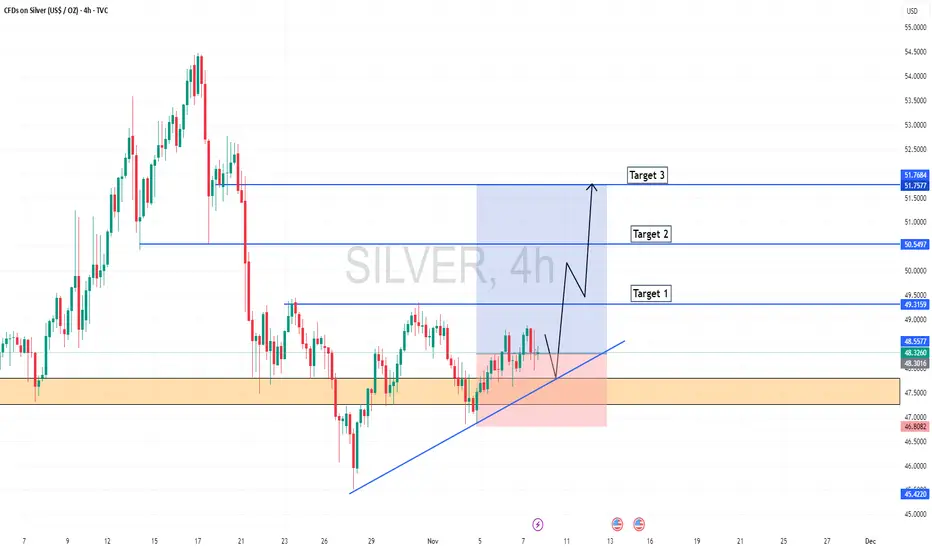
Silver is in the Bullish directionHello Traders
In This Chart XAGUSD HOURLY Forex Forecast By FOREX PLANET
today XAGUSD analysis 👆
🟢This Chart includes_ (XAGUSD market update)
🟢What is The Next Opportunity on XAGUSD Market
🟢how to Enter to the Valid Entry With Assurance Profit
This CHART is For Trader's that Want to Improve Their Technical Analysis Skills and Their Trading By Understanding How To Analyze The Market Using Multiple Timeframes and Understanding The Bigger Picture on the Charts
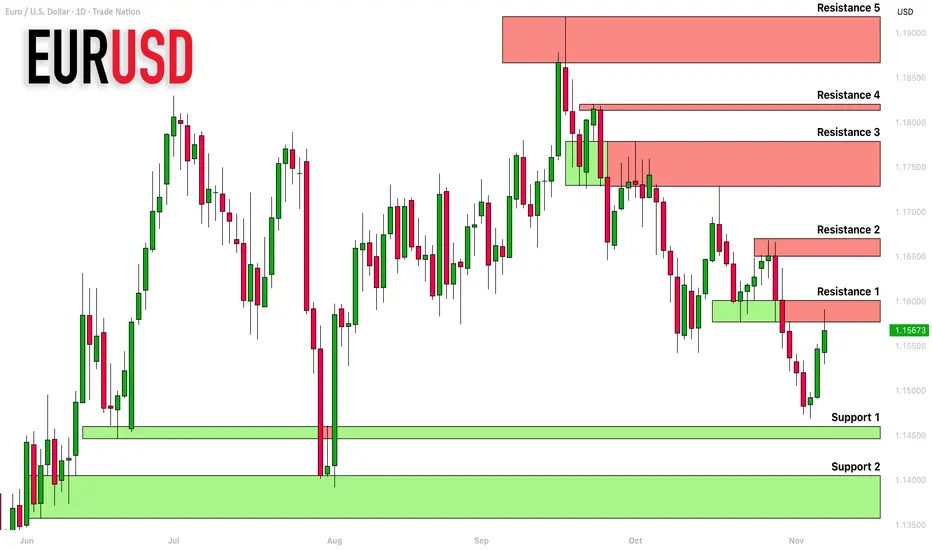
EURUSD: Support & Resistance Analysis For Next Week 🇪🇺🇺🇸
Here is my latest structure analysis and important
supports and resistances for EURUSD for next week.
Consider these structures for pullback/breakout trading.
❤️Please, support my work with like, thank you!❤️
I am part of Trade Nation's Influencer program and receive a monthly fee for using their TradingView charts in my analysis.
MON Buy/Long Setup (2H)A bullish structure is visible on the chart. You can look for a long (buy) position around the green zone, which is the last order block.
Targets and stop loss levels are marked on the chart.
This coin is volatile, so make sure to manage your risk and position size carefully.
For risk management, please don't forget stop loss and capital management
When we reach the first target, save some profit and then change the stop to entry
Comment if you have any questions
Thank You

ICP retracementICP retraced from a ~$10 peak to its ~$7.50 pivot point. It could be building momentum for a $10 break which could least to ~$12 /$14 range. A solid break below $7.50 could lead to further lower pricing.

TradeWithMky Wanna Tell THE FUTURE | Weekly Bullish 🚀 TradeWithMky – Precision Crypto Market Analysis
Specializing in TOTAL Crypto Market Cap (CRYPTOCAP: TOTAL) on the weekly timeframe.
🔥 Now LIVE: The MIRACLE SHOT Indicator – a proprietary smart money footprint tool that detects institutional accumulation zones, hidden support levels, and high-probability reversal points with surgical accuracy.
📊 Current Chart Breakdown (Nov 09, 2025):
Price has broken above the descending trendline with strong bullish momentum
Smart Money Footprint confirmed at $3.1T – $3.3T zone
First Target: This TOP → $3.9T–$4.1T (ascending channel resistance)
Critical Support III at $3.17T – WARNING zone below $3.08T
🛡️ Risk Levels Clearly Marked:
Support I: $2.46T
Support II: $2.51T
Support III: $3.17T (HOLD or DIE)
💡 Follow for daily updates, miracle shot signals, and macro crypto insights.
⚡ Powered by MIRACLE SHOT™ – See What Smart Money Sees.
Not financial advice. Trade at your own risk.
Persian News Announcement (for Persian Audience):
📢 خبر فوری برای معاملهگران ایرانی: انتشار اندیکاتور معجزهآسا "میراکل شات"!
سلام به جامعه کریپتو ایران!
تیم TradeWithMky با افتخار اعلام میکند:
🔥 اندیکاتور انقلابی "میراکل شات" (Miracle Shot Indicator) حالا رایگان در تریدینگویو منتشر شد!
این اندیکاتور هوشمند:
✅ ردپای نهنگها و اسمارت مانی را نشان میدهد
✅ نقاط ورود و خروج دقیق در سقف و کف بازار
✅ هشدارهای حمایت و مقاومت حیاتی با رنگبندی واضح
✅ مخصوص بازار کل کریپتو (TOTAL Market Cap) در تایمفریم هفتگی
💥 در چارت فعلی:
بازار از کانال نزولی خارج شده
تارگت اول: ۴.۱ تریلیون دلار
حمایت کلیدی: ۳.۱۷ تریلیون – زیر این سطح خطرناک است!
👉 همین حالا پروفایل را فالو کنید و اندیکاتور را فعال کنید:
معجزه در یک شات. آینده را ببینید.
تیم TradeWithMky – همراه شما در مسیر سودآوری

ETHEREUM Roadmap (3D)This is a broader outlook on Ethereum in the higher timeframe.
From the point marked as "Start" on the chart, it seems that Ethereum's correction has begun, forming an ABC pattern. Wave B appears to have completed as a symmetrical structure, and we are likely in wave X of B or wave C.
We expect a price rebound from the green zone.
So, keep a close eye on the chart and monitor it carefully.
For risk management, please don't forget stop loss and capital management
When we reach the first target, save some profit and then change the stop to entry
Comment if you have any questions
Thank You

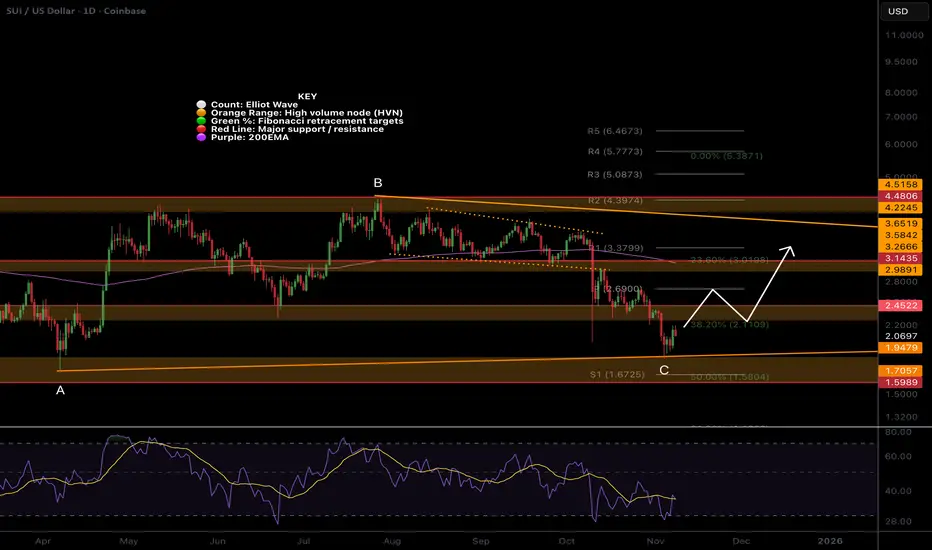
SUI remains in a shallow Fib triangleCRYPTOCAP:SUI Price remains in a downtrend, falling below a major High Volume Node support, tapping the macro triangle lower boundary.
Wave C of the triangle appears complete. If this count is correct, we should accelerate to the upper boundary around $3.6 over the next month or so, with some difficulty at the daily 200EMA and pivot as resistance.
📈 Daily RSI printed bullish divergence from oversold
👉 Continued downside loses the triangle pattern, and the next target is $1.6
Safe trading
SOL holds up wellCRYPTOCAP:SOL Price continues lower in the channel, a textbook ABC correction so far.
Wave 1 ended with a wedge throw-over. Price has found support above the Fibonacci golden pocket and High Volume Node at the channel's lower boundary. The probability is a continuation to the downside with a target of $140.
📈 Daily RSI tapped oversold with no divergence to suggest a bottom
👉 Continued downside brings up the $112 target, a great buy opportunity
Safe trading

ONDO,1 more push lowerLSE:ONDO Price is sitting just above High Volume Node support, testing the descending trend-line as resistance. As long as we are below the trend-line, the probability is to the downside.
Wave 2 appears complete after 5 waves down from the wave X flat correction. Price was front-run at the golden pocket Fibonacci retracement, but only a bounce so far. We are below the daily pivot and 200EMA, which is bearish.
📈 Daily RSI tapped oversold twice with slight bullish divergence.
👉 Continued downside has a target of the bottom of the High Volume Node at $0.5
Safe trading

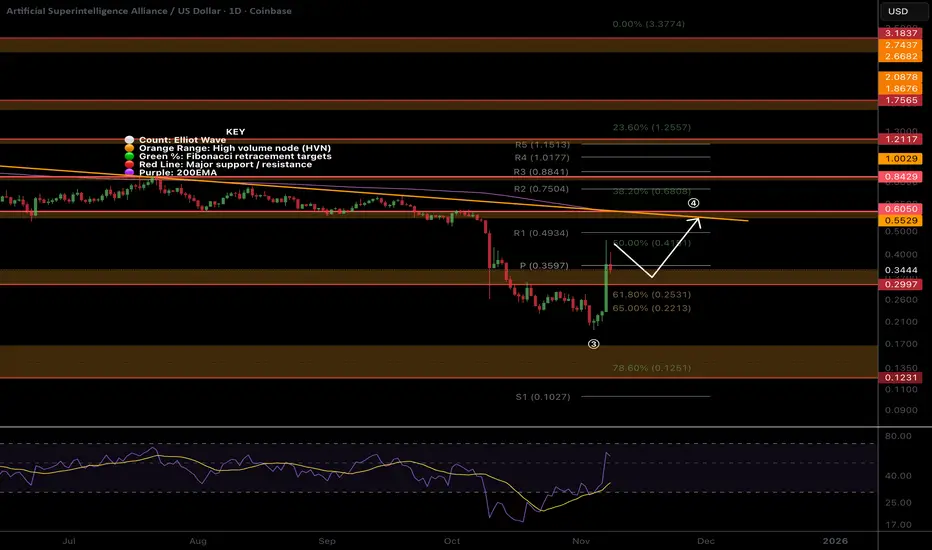
FET, Pump and dump?NYSE:FET Price bounced with a one day candle of 70% recovering the High Volume Node resistance and daily pivot from the golden pocket Fibonacci retracement.
Chasing candles higher is what’s on the cards of naive investors now. Greed and FOMO immediately took over socials with much gloating. This is a recipe for lower, humbling them.
📈 Daily RSI went too high, too fast, and now has bearish divergence in a bear market, a strong signal.
👉 Continued upside has a target of the daily 200EMA and High Volume Node resistance at $0.6.
Safe trading
ETH Correction complete?CRYPTOCAP:ETH Wave 2 is taking the form of a complex WXYXZ correction broadening wedge. Ugly, hard to trade or find any entries. This will cause a lot of stress. This is also potentially a wave 4, but my preferred count is 2 for now.
Wave 2 appears complete with a swing below the boundary, but the recovery should have been stronger by now; instead, we are stalling below the daily 200EMA. The trend is down, and so we should expect more down. Wave X printed a triangle
📈 Daily RSI has not reached oversold and is still bearish with no divergences.
👉 Continued downside has a target of the High Volume Node $2600, where I will be adding.
Safe trading

DOGE More downside to come?CRYPTOCAP:DOGE Price is testing the bottom of the channel and pivot point as resistance, where it is likely to be rejected.
Wave (2) appears complete after the Friday flash crash, hitting the ‘alt-coin’ golden pocket, 0.786 Fibonacci retracement. The trend remains down, so this is the higher probability. Price needs to overcome the heavy resistance ahead before we can talk about being bullish long-term.
📈 Daily RSI has printed bullish divergence, which is bullish
👉 Continued downside has a target of the 0.618 Fibonacci retracement and High Volume Node $0.12
Safe trading

BTC, Correction finished?CRYPTOCAP:BTC Price continues in a shallow range, down 22% from the all-time high, but sentiment is nearing extreme fear.
This complex correction appears complete at the trend-line boundary, where I bought, but I am giving it room for one more push lower to complete 5 waves down for Y. If wave 2 ends here, wave 3 is expected to be powerful and fast.
Price is below the daily 200EMA, which will offer some resistance at a High Volume Node. For now, the trend is down, and so further downside is the higher probability.
📈 Daily RSI has not reached oversold like all the other ranges did and is still bearish with no divergences.
👉 Continued downside brings up the next High Volume Node at $92000
Safe trading

BNB Bearish continuation?CRYPTOCAP:BNB Price appears to have completed wave (1) at the R1 pivot and has retraced to the daily 200EMA, 0.5 Fibonacci retracement and S1 pivot so far. A tough nut to crack.
Wave (2) appears complete with a textbook ABC correction ending at strong support. The downtrend is intact, so the probability is still to the downside until the structure flips.
📈 Daily RSI has not reached oversold and is still bearish with no divergences
👉 Continued downside loses the 200EMA and brings up the Golden pocket as support $740
Safe trading

AAVE local analysis updated, Bear trend continueEURONEXT:AAVE Locally, price continues bearish after falling out of the wedge, completing wave 1. Until the price gets above the orange descending trend-line, the probability is downside continuation.
Wave 2 appears complete after the big drop, black swan event. I was looking for a dip back into the long lower wick, which we have and price found support. This suggests we grind higher from here, but we must get through the daily 200EMA, just above the High Volume Node resistance and daily pivot. This area will be tough to crack.
The alternative count is a triangle forming discussed below, which is the (A)(B)(C) shown.
📈 Daily RSI has printed bullish divergence from the oversold threshold, which is bullish and a bottoming signal.
👉 Continued downside has a next target of $150.
Safe trading

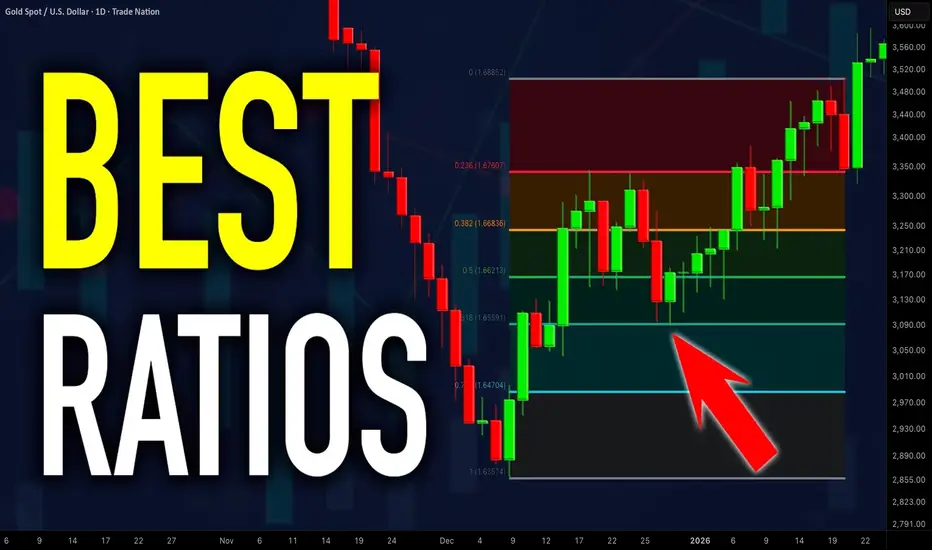
Powerful Fibonacci Trading Strategy For Beginners (GOLD FOREX)
I am going to reveal a powerful fibonacci trading strategy that I learned many years ago. It combines structure analysis, fibonacci retracement and extension levels and candlestick analysis, and it is suitable for beginners.
Step 1
Find a trending market - the market that is trading in a bullish or in a bearish trend on a daily time frame.
AUDUSD is trading in a bullish trend on a daily.
Step 2
Execute structure analysis - identify key horizontal and vertical structures on a daily time frame.
Have a look at key structures that I spotted on AUDUSD.
Step 3
Draw fibonacci retracement levels.
Here are the important ratios you should look for: 382, 50, 618, 786.
In a bearish trend,
draw fibonacci retracement levels from the high of the trend to current low based on wicks.
In a bullish trend,
You should apply fibonacci retracement from the low of the trend to a current high based on wicks.
Take a look how I draw the retracement levels,
I took the low of the trend and the high of the trend.
Step 4
Find confluence .
Look for fibonacci numbers that match - lie within key structures that you identified.
Support 1 matches with 382 retracement.
Support 2 matches with 786 retracement.
Remove other ratios from the chart.
Step 5
Wait for a test of one of the fibonacci levels that match with key structure
The price perfectly tested 382 retracement level.
Step 6
Wait for a confirmation on a 4h time frame.
Our confirmation will be a formation of an engulfing candle - a strong candle that completely engulfs the entire range of a previous candle with its body.
In a bearish trend, we will look for a formation of a bearish engulfing candle. Bearish engulfing candle indicates a strong selling pressure and the strength of the sellers.
In a bullish trend, we will look for a bullish engulfing candle. It indicates a strong buying reaction and imbalance.
Have a look at a bullish engulfing candle that was formed on AUDUSD on a 4H time frame after a test of 382 retracement.
Step 7
Open a trading position, set stop loss and choose the target.
After you spotted an engulfing candle, open a trading position.
Open short after a formation of a bearish engulfing candle and open long after a formation of a bullish engulfing candle.
If you sell , your safest stop loss will be 1.272 extension of the last bullish impulse on a 4H.
If you buy , your stop loss will be 1.272 extension of the last bearish impulse on a 4H.
In our example, our stop loss will be 1.272 extension of a bearish impulse leg on a 4H time frame. The extension is based on high and low of the impulse.
If you short , your take profit will be the closest key structure support on a daily.
If you buy , your take profit will be the closest key structure resistanc e on a daily.
Being applied properly, the strategy should generate 60%+ winning rate.
Always remember to check your reward to risk ratio before you open the trade. It should be at least 1.1/1.
Also, before you place a trade, always make sure that you trade WITH the trend and take only trend-following trades.
The strategy works perfectly on Forex, Gold, Silver, Oil, Indexes.
Good luck in your trading.
❤️Please, support my work with like, thank you!❤️
I am part of Trade Nation's Influencer program and receive a monthly fee for using their TradingView charts in my analysis.
The big XAG LongPlaying the potential Wave 3 for Silver.
My invalidation will be a weekly close below the highlighted demand zone.

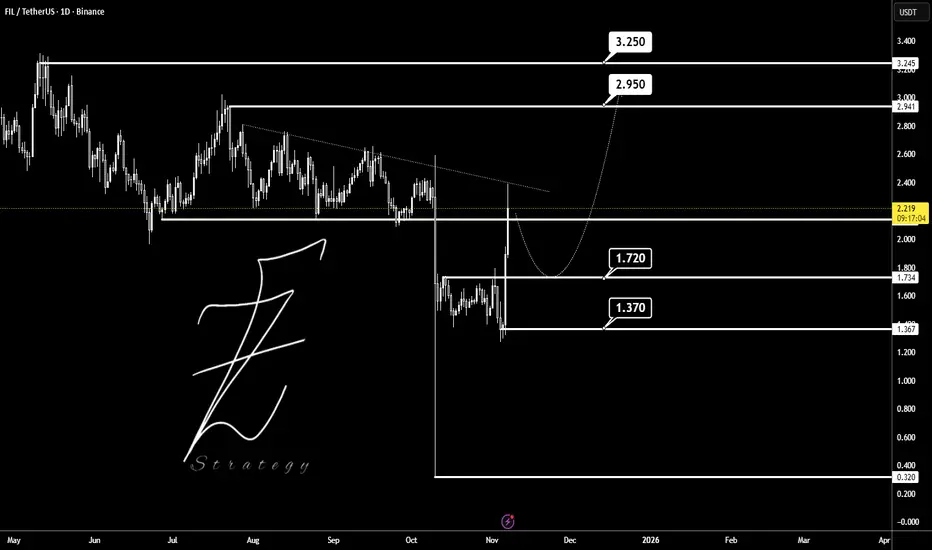
FILUSDTBINANCE:FILUSDT is now for breakout trendline but should pullback to 1.720$ and start up-trend to 3$.
DOT/Polkadot DropDOT is facing a supply zone (the green area), and the neckline (green) on the RSI has been broken. When the blue line breaks and the RSI pulls back to its broken neckline, that's one of the optimal entry points. This is because stop hunting is highly likely in supply and demand zones, I've drawn the probable path of movement. BINANCE:DOTUSDT

BITCOIN daily FALLING-WEDGEBitcoin is in a falling wedge and very likely can break above that in the coming days
