AUDUSD | Long IdeaLooking for AUDUSD to make a move up from this Asia low here.
Other USD pairs making the same move at the moment so momentum is on my side here.
Let me know what you think!
do your own due diligence, this is not investment advise!
Pivot Points

USDJPY - 27/1/2026Price is climbing back up after last weeks huge drop in the dollar.
There has been a BoS which suggests that bullish move may be coming through this week.
As price left a small imbalance below and the volatility is quite low on the creep upwards. I expect that the low may be taken later this week.
As a day trade, i am looking for a buy limit order entry at the demand zone just below the BoS with the TP at the small imbalance above.

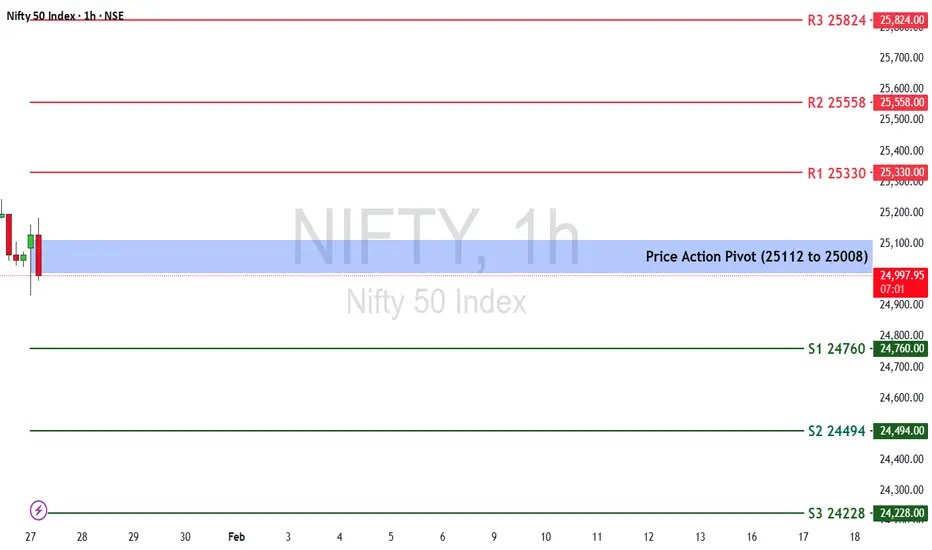
Nifty 50 Weekly Outlook ( 27th Jan – 30th Jan 2026)The Nifty 50 Index last week ended at 25,048.65, posting a sharp decline of –2.51%.
🔹 Key Levels for the Upcoming Week
📌 Price Action Pivot Zone (25,008–25,112)
This blue-shaded area represents the crucial weekly decision zone.
Sustaining above 25,112 may invite recovery buying, while rejection from this zone can continue the selling pressure.
🔻 Support Levels
S1: 24,829
S2: 24,494
S3: 24,228
🔺 Resistance Levels
R1: 25,330
R2: 25,558
R3: 25,824
Market Outlook
Bullish Scenario:
If Nifty reclaims and holds above the Pivot Zone (25,008–25,112), upward momentum may push the index toward R1 (25,330).
A strong breakout above this level can extend the recovery toward R2 (25,558) and R3 (25,824).
Bearish Scenario:
If the index fails to sustain above 25,008, continued weakness may drag Nifty toward S1 (24,829).
A breakdown below this support can open the path toward S2 (24,494) and S3 (24,228).
Disclaimer: aliceblueonline.com/legal-documentation/disclaimer/
GOLD Bearish Setup – 30M AnalysisDate: 26/01/2026
Timeframe: 30M
Current Price: 5067.98
🔻 Market Bias: BEARISH / SELL
Gold is trading near the upper boundary of an ascending channel, showing distribution at highs after a strong impulsive move. Price is failing to sustain above the 5,100 liquidity zone, indicating potential downside.
📍 SELL SETUP
Entry Zone: 5095 – 5100
Stop Loss: Above 5115
Targets:
• TP1: 5050
• TP2: 5000 (Psychological Level)
• TP3: 4960 (Demand / Break & Retest Zone)
📌 Key Confluences
• Strong resistance & liquidity cluster near 5100
• Possible Head & Shoulders / Triple Top formation
• Price testing upper boundary of ascending channel
• Distribution after strong impulsive bullish move
• 5000 acting as a major psychological magnet
🧠 Market Structure
Price remains inside an ascending parallel channel, but repeated rejection at highs increases the probability of a pullback toward the channel median.
⚠️ Note
Wait for proper confirmation (rejection candle / bearish structure shift) before entry.
This is not financial advice. Proper risk management is required.

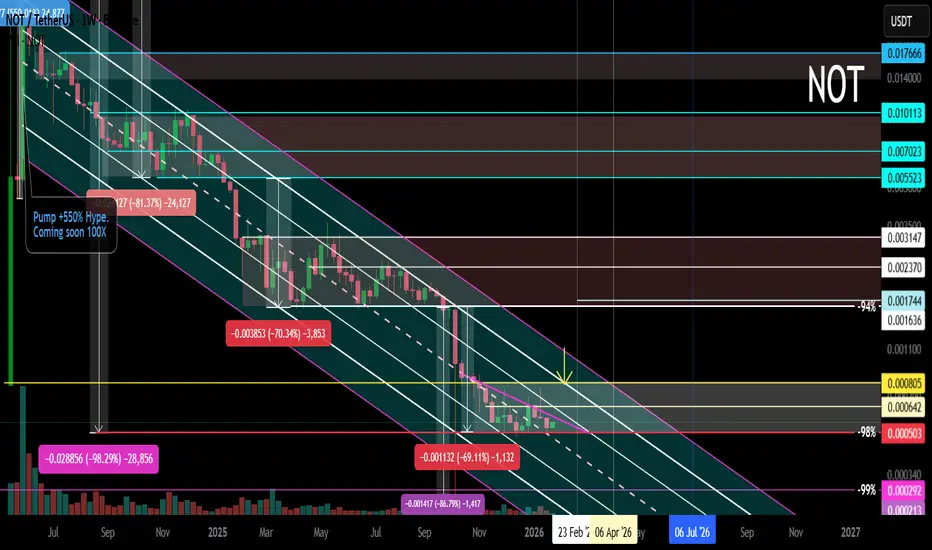
NOT Main Trend. Descending Channel -98% 01/27/2026Logarithm. Time frame: 1 week.
The price is in the main trend and remains in a downward channel with a given volatility range.
It's important to understand that the creators of this cryptocurrency always sell at any price (they're created for profit, fueled by hype). However, at low prices (-94-99%), a dilemma arises:
1️⃣ invent a reason for a scam and abandon the project;
2️⃣ or reverse the trend and temporarily restore faith in this scam cryptocurrency. In order to continue sales.
You can use this and profit from it. But, in the long term, you should be cautious with such assets. This applies to absolutely all cryptocurrencies created for hype and without any real future use. When trading such a dying former super-hype, manage your risks. This is the basic principle. If you can't do this, avoid it.
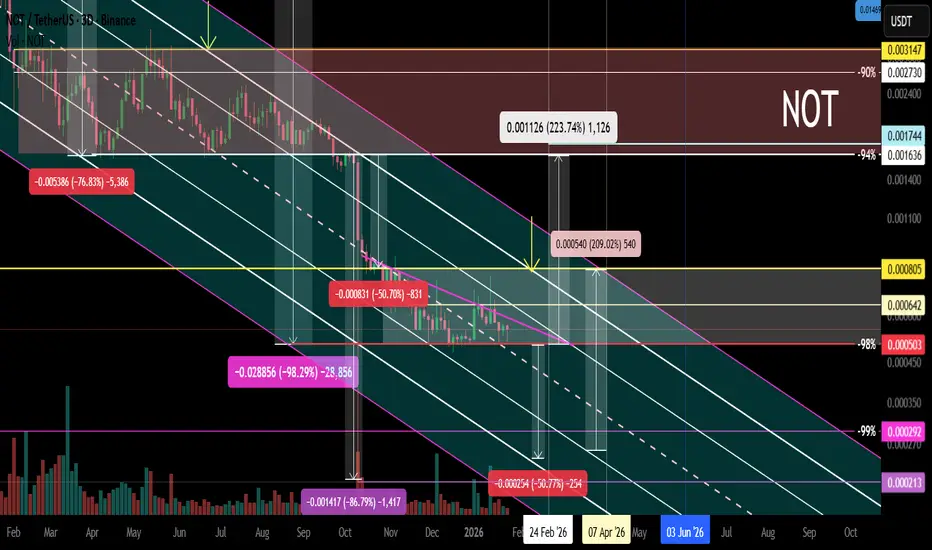
NOT Local trend. Sideways. -98%. Reversal zones 27 01 26
NOT Local trend. Sideways -98%. Reversal zones 27 01 26Logarithm. 3-day time frame.
The price in the main trend is still in a downward channel with a given volatility range.
Medium-term - locally , another sideways trend has formed (the third in a downward channel), but the decline is already -98% (not counting the futures long, which was previously down by -99%). Typically, such low-liquidity hype scams decline by -94-98% (with rare exceptions of -99% or a complete scam project, based on some fiction).
It's important to understand that the creators of such cryptocurrencies always sell at any price (they're created for profit, under the hype). But at low price levels (-94-99%), a dilemma arises:
1️⃣ invent a reason for a scam and abandon the project;
2️⃣ or reverse the trend and temporarily restore faith in the scam cryptocurrency. This will, in turn, continue selling.
You can exploit this and profit from it. But, in the long term, it's best to be cautious with such assets. This applies to absolutely all cryptocurrencies created for hype and with no real future use. When trading such dying former super-hypes, manage your risks. This is the foundation. If you can't manage it, avoid it.
Onds patiently waiting to long Onds golden pocket is around 9.5$ on this most recent momentum move. These high flying small caps are hard to watch and sit sidelined on. I only buy or trade them on golden ratio pullbacks.

AUDCAD - BullishPrice is pushing higher with rising volume, and for now I’m simply watching the show. I expect sell-side liquidity to be taken as price works toward midweek objectives.
If bears step in and bring price back into discounted territory, I’ll shift focus to how it distributes and forms a corrective structure. Otherwise, I’m content sitting on my hands and letting price do the work.
Nothing forced.
Patience is key. Tracking is the edge. Let’s go.

USDCAD - BullishFrom my perspective, higher-timeframe structure has flipped, with sellers taking control. Price has shown a clear shift in market character, breaking the prior major higher low and establishing downside intent.
From here, I’m watching for a strong HTF lower high to form, which would keep price aligned toward continuation to the lows. Until that develops, I’m simply reading the tape and tracking behavior.
Nothing forced.
Patience is key. Tracking is the edge. Let’s go.

Gold SellPrice reacted at the earlier London exhaustion zone, which has become the NY exhasution zone as well.
15 min candle flip, was confirmation of price rejecting that area. Expecting a retest of the Asia exhaustion of early morning trade, but could also see price push right through to extend the bearish view, since we have a FVG at around the 5000 area.
RR 1:5

RIOT Short-term analysis | Trading and expectationsNASDAQ:RIOT
🎯 Price completed wave II of 3, reclaiming the daily 200EMA and pivot. The next challenge is to overcome the High Volume Node resistance. The uptrend is strong.
📈 Daily RSI hit oversold with bullish divergence and has room to grow.
👉 Continued downside has a target of the High Volume Node, $10
Volatility analysis | Expected range & extremities
🎯RIOT is behaving as expected in the usual range, sitting above fv, moving along its steady growth path.
👉Fair value is ~$15
safe trading

MSTR Short-term analysis | Trading and expectationsNASDAQ:MSTR
🎯 Price dropped hard wave Y of 4, invalidating the previous analysis. Wave Y can complete any time in this flat correction pattern, but is approaching the 0.382 Fibonacci retracement, a high probability bottom.
📈 Daily RSI printed hidden bearish divergence, suggesting lower to come
👉 Continued downside has a target of the S1 pivot, $136
Volatility analysis | Expected range & extremities
🎯MSTR has finally completed its overheated cooldown, dipping below fv. Downside momentum is in control and could continue to push the price down further. SD-2 threshold is $120
👉Fair value is ~$200
Safe trading

IREN Short-term analysis | Trading and expectationsNASDAQ:IREN
🎯 Iren wave 4 hit the daily 200EMA, just above 0.382 Fibonacci retracement. Price is at High Volume Node resistance, but above the daily pivot and 200EMA, showing the uptrend is intact. Continued downside has a target of the daily 200EMA, $26.75
📈 Daily RSI has not reached oversold
👉 Analysis is invalidated only at all time high, for now
Volatility analysis | Expected range & extremities
🎯IREN came back down to it’s expected range and jumped back into the SD+2 overbought zone. The incline is steep, reflecting its strong growth, giving strong down days also. Price is above fv
👉Fair value is ~$35
Safe trading

HUT Short-term analysis | Trading and expectationsNASDAQ:HUT
🎯 Price jumped back up following my path. Wave 4 of V was indeed complete at the 0.382 Fibonacci retracement and High Volume Node just above the daily 200EMA. The daily R1 pivot has been claimed. The uptrend is well intact.
📈 Daily RSI is showing bearish divergence as price falters
👉 Analysis is invalidated if we close below wave 4, $30
Volatility analysis | Expected range & extremities
🎯 Hut is in the SD+2 overheated zone, where it is expected to spend <5% of the time. Price has a tendency to rally above the SD+3 threshold before being rejected, characteristic of low-cap assets. Price is well above fv, traders should be cautious
👉Fair value is ~$20
Safe trading

GOOGL Short-term analysis | Trading and expectationsNASDAQ:GOOGL
🎯 Wave III continued, price looks exhausted but just won’t stop rewarding investors. It may trap late trend-chasing investors, causing them to capitulate lower. Wave (B) of a corrective wave appears complete. Wave (C) has an initial target of the High Volume Node at $277, the 0.236 Fibonacci retracement. This is a likely area for a wave 4 correction to end in a bullish uptrend.
📈 Daily RSI has printed a bearish divergence from overbought for weeks
👉 Analysis is invalidated if price moves above wave III into all-time high
Volatility analysis | Expected range & extremities
🎯Google has been overheated for some time above the SD+3 threshold, where it is expected to spend <1% of the time. A large drop would not be surprising, but this sustained rally is reflecting the AI growth and could be setting google on a new, bullish path. Price is well above fv, not something I would be buying at this time
👉Fair value is ~$260
Safe trading

COIN Short-term analysis | Trading and expectationsNASDAQ:COIN
🎯 Price continued lower, ignoring all bullish divergences, though another is forming. Price has filled the gap and sits in the golden pocket. The bears are in control.
📈 Daily RSI has printed bullish divergence from oversold, a strong bottoming signal.
👉 Analysis is invalidated above $263, suggesting a major bottom is in
Volatility analysis | Expected range & extremities
🎯COIN behaving as expected. Price tested the SD+2 threshold 3 times and was rejected to fv each time. No momentum took hold despite COIN’s big run. Price is at fv.
👉Fair value is ~$225
Safe trading

CLSK Short-term analysis | Trading and expectationsNASDAQ:CLSK
🎯 Price is back at the daily 200EMA and above the pivot, below major resistance after finding support at the orange trend line and golden pocket. The direction is ambiguous, but I am leaning to further upside this week
📈 Daily RSI sits at the EW, flipped bullish but with no divergence.
👉 Analysis is invalidated if price falls below wave (2) at $9
Safe trading

CIFR Short-term analysis | Trading and expectationsNASDAQ:CIFR
🎯 The triangle has flipped to a bearish-looking triangle. This is a penultimate pattern, we can expect price to thrust lower, test the daily 200EMA, end the correction and then makes its way to new highs. l pattern Wave d of the triangle may still be underway, wave e is expected to end at the daily pivot where price currently sits, above the daily 200EMA, showing the uptrend is still intact but flattening.
📈 Daily RSI is neutral, reflecting triangle dynamics
👉 Analysis is invalidated if price falls below wave b or above wave a.
Safe trading

BTDR Short-term analysis | Trading and expectationsNASDAQ:BTDR
🎯 Price overcame the daily 200EMA, major High Volume Node and Pivot, showing a strong bullish trend is in play. It has pulled back to test the 200EMA and support node, normal behaviour. Wave C looks underway toward the $25 target.
📈 Daily RSI printed bullish divergence.
👉 Analysis is invalidated if price falls below wave (B), 9.50, and the structure will start to look bearish.
Safe trading

GOLD (XAUUSD): Important Support & Resistance Analysis
Here is my updated structure analysis for Gold.
Resistance 1: 5096 - 5112 area
Resistance 2: 5196 - 5212 area
Resistance 3: 5296 - 5312 area
Support 1: 4988 - 5010 area
Support 2: 4758 - 4773 area
Support 3: 4629 - 4644 area
Support 4: 4536 - 4550 area
Consider these structures for pullback/breakout trading.
❤️Please, support my work with like, thank you!❤️
I am part of Trade Nation's Influencer program and receive a monthly fee for using their TradingView charts in my analysis.

Market structure for 2026 and 2027? New ATH above $150,000!!!!During 2025 and much of 2026, BTC has been experiencing what could apparently be interpreted as a crypto winter. In reality, this would only be entirely true if the fundamental news in the sector were aligned with price action. What we are actually seeing instead is a clear divergence between sector news, an increasingly active industry that is progressively accepting the asset as something key, and price behavior.
Why is this happening? Are we being lied to, perhaps?
No, we are not being lied to. What is really happening is the construction of well-capitalized positions in the futures market that effectively flush out the most reckless participants, over-leveraged traders, and those who overtrade.
Taking this situation as a key element to interpret the future scenario, and considering that markets tend to repeat certain chart patterns, I have established the following framework with sell zones, no trade zones, and buy zones.
Let's see :)
Obviously, this is not investment advice. The purpose is purely educational and driven by curiosity. Always do your own research. Not your keys not your coins and always HODL! 🚀

BITCOIN Looks Still Bearish (8H)From the point where we placed the red arrow on the chart, it appears that a bearish Diagonal is forming. We are currently in wave D of this Diagonal, which itself is forming a triangle.
It seems that wave d of this triangle has completed, and the price is now attempting to enter wave e, which represents the final wave of the triangle. For the price to return toward the red zone, some bottoming and accumulation may be necessary, and this process could take time.
It’s important to note that in markets like Bitcoin, price action is not always purely natural. Large market participants, including market makers and institutional players such as banks, often influence the market, creating temporary squeezes, fake breakouts, or liquidity hunts. These movements can affect the timing and shape of waves, and they often drive price toward key liquidity zones before the market continues its intended structure.
Once this triangle is complete, we expect Bitcoin to resume its drop. However, if a daily candle closes above the invalidation level, this bearish scenario would be negated. Traders should keep in mind that patience is key, and observing volume, liquidity, and market manipulation patterns can provide valuable confirmation for the next move.
If you have a coin or altcoin you want analyzed, first hit the like button and then comment its name so I can review it for you.
This is not a trade setup, as it has no precise stop-loss, stop, or target. I do not publish my trade setups here.

Gold SellGold reached another new ATH during Asia session this morning.
Taking a sell considering price ranging around the Asia exhasution zone pre-London and then again during London, after a rejection at the R3 level.
This will be a short based on price possibly pushing down towards the daily open, but targeting the Asia mid-range exhastion level only.
Overall bias is bullish and will look to take long position during NY if it presents itself.
