EUR/USD is benefiting from the Greenland diplomatic crisis.The euro has recovered most of its January losses and is now targeting a critical resistance area.
⚡Psychological Support (1.1700): EUR/USD's success in holding above 1.1700 confirms a shift in short-term sentiment from bearish to consolidative with an upward bias.
⚡RSI (58 - 60): Is in the positive zone but not yet overbought, giving the euro room to attempt a further rally.
✅ Key Levels to Watch
⚡Major Resistance ($1.1750 - $1.1800): A breakout of 1.1750 would pave the way for EUR/USD to test the 1.1800 area (early January peak). A successful settlement above 1.1800 would officially end this month's downtrend.
⚡Immediate Support ($1.1700): This level must be held. A daily close below this level would bring the pair back to the neutral zone around 1.1660.
⚡US Jobless Claims & PCE (Thursday): Tomorrow's employment data and PCE inflation will be the real test for the dollar. If US data is significantly stronger than expected, the euro could suddenly lose its upward momentum.
Priceactionstrategy

Price Action: Long Term, Mid Term, Short Term Trend Explained
In this article, I will teach you the basics of market trend analysis.
We will discuss Long Term, Mid Term and Short Term trends.
I will show you how to identify and apply them properly.
Please, note that we will execute the trend analysis strictly on a daily time frame.
For the trend identification, we will rely on classics price action analysis rules.
We will say that the trend is bullish if the price forms at least 2 consequent bullish impulses with a retracement leg between them, so that the price would set at least 2 higher highs and a higher low between them.
We will say that the trend is bearish if the price forms at least 2 consequent bearish impulses with a retracement leg between them, so that the price would set at least 2 lower lows and a lower high between them.
If none of these conditions are met, we will say that the market is consolidating .
Long Term Trend
Long term trend is based on the analysis of a price action over 1 year.
To identify a long-term trend, start by analyzing the price action over a period of one year from the current trading day.
Analyze highs and lows.
According to the rules, the long term trend on USDCAD is consolidation.
Mid-Term Trend
Mid-term trend is based on the analysis of a price action over the last 5 months.
To identify a mid-term trend, start by analyzing the price action over a period of 5 months from the current trading day.
Analyze highs and lows.
According to our rules, the mid term trend on the pair is bearish.
Short Term Trend
Short term trend is based on the analysis of a price action over the last 2 months.
To identify a short-term trend, start by analyzing the price action over a period of 2 months from the current trading day.
Analyze highs and lows.
According to our rules, the short term trend on the pair is bearish.
According to our trend analysis,
long term trend is a consolidation,
mid-term trend is bearish,
short term trend is bearish.
Combining these 3 trends, we can derive that the pair is trading
in a huge range . After the price reached a resistance of the range, the price started to trade both in a short term and midterm bearish trends.
We can anticipate a bearish continuation till the price reaches a support of a long term range.
That is how you execute a trend analysis with price action.
❤️Please, support my work with like, thank you!❤️
I am part of Trade Nation's Influencer program and receive a monthly fee for using their TradingView charts in my analysis.

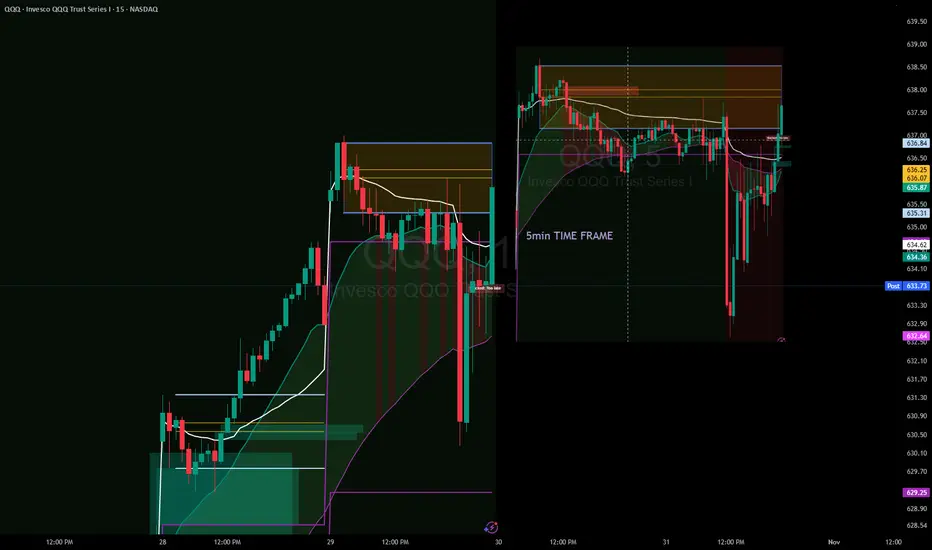
Daily Recap – The Patience Play (QQQ ORB Setup)Fellow traders,
Today was one of those sessions that remind us: sometimes the best trade is no trade at all.
The morning ORB (9:30 – 9:45 NY) gave us a wide initial range with very little conviction in either direction. We saw price flirt with both edges, but no candle could close decisively outside the box. Each push quickly reversed, leaving nothing but wicks and false momentum.
Volume stayed neutral and the EMAs never truly separated — a classic sign of indecision. Even the higher-timeframe (30-min) trend stayed flat, confirming there was no clean alignment to give us the confidence we needed.
Mid-session, price finally poked above the ORB high — but it immediately failed and rolled right back into the range. Later in the day, the real move came to the downside… well past the optimal ORB window. By then, discipline meant staying out.
👉 No setup, no entry — and that’s perfectly fine.
The goal isn’t to trade every day; it’s to trade only when probability lines up.
Tomorrow, we reset with the same rules:
Wait for a clean break and retest outside the ORB.
Confirm volume and trend.
Let the market come to us.
Stay patient, stay disciplined, and remember — consistency is built on the days you don’t force it.
— Trades with B
“XAUUSD – Strong Sell Setup from All-Time High Resistance “XAUUSD – Strong Sell Setup from All-Time High Resistance 🚨📉”
Currently, gold has reached a strong resistance zone around 3575 – 3600, where price is showing signs of exhaustion after a strong bullish rally. This area is a key supply zone and could trigger profit-taking or fresh short entries.
From here, I am expecting a potential correction move.
1st Target: Around 3480 – 3450, where we can see a clear demand zone and previous consolidation.
If bearish pressure continues, the price may extend towards the final target at 3330 – 3320, which is also a key support point aligned with previous market structure.
Market structure shows a clear higher low formation earlier, which fueled this rally, but after tapping into resistance, a short-term pullback seems highly likely.
📌 Overall, short-term bias = bearish correction, while long-term trend remains bullish unless price breaks below the 3320 support zone.

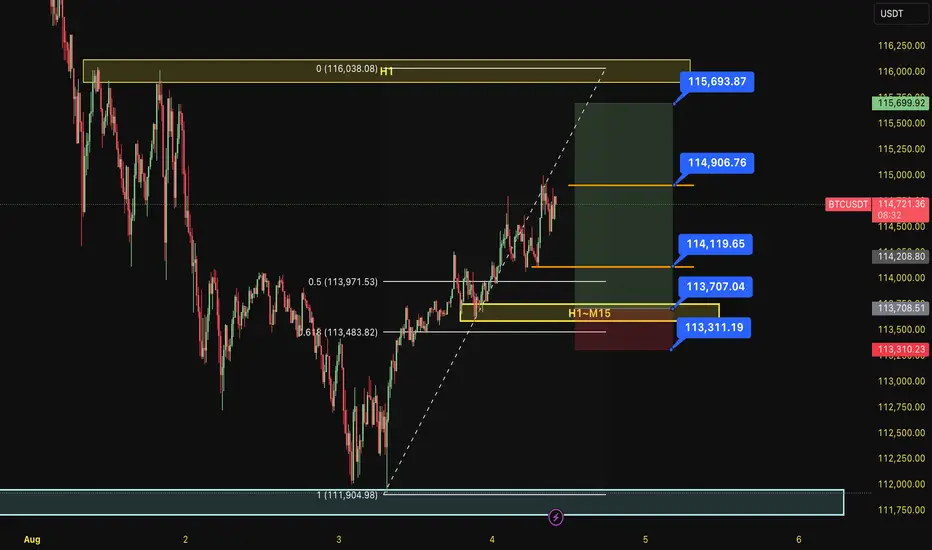
BUY BTC 4.8.2025Confluence order: BUY at H1~M15
Type of order: Limit order
Reason:
- The current top is not touching anything, expected to rise to the H1 above.
- M15~FIBO 0,5-0,618 (same position)
Note:
- Management of money carefully at the last bottom (114,119)
Set up entry:
- Entry buy at 113,707
- SL at 113,311
- TP1: 114,119 (~1R)
- TP2: 114,906 (~3R)
- TP3: 115,963 (~5R)
Trading Method: Price action (No indicator, only trend and candles)
TONUSDT Bullish Structure Continuation – Minor Pullback Leg Up🧾 1. Overview of the Chart Setup:
The current TONUSDT (Toncoin/USDT) 2-hour chart exhibits a strong bullish market structure, characterized by a clear sequence of higher highs and higher lows. This confirms bullish momentum and suggests that the market is in a well-established uptrend.
The key highlight here is the "Blue Ray – Trend Continuation Pattern", which signals sustained bullish pressure following a clean breakout. This breakout was preceded by a consolidation phase, indicating accumulation by smart money before the expansion move.
🔍 2. Technical Structure and Pattern Breakdown:
🔵 Blue Ray – Trend Continuation Pattern:
This diagonal support trendline captured the initial breakout after the market bottomed near July 29–30.
Price respected this ascending line multiple times before accelerating, confirming bullish control.
Once the price broke above the previous swing high, it completed the pattern and triggered a momentum-driven rally.
🔲 Structural Zones – Major and Minor:
Minor Support Zone (~3.50 USDT):
Currently acting as short-term demand.
Price is showing early signs of rejection here, suggesting bulls may reload for a second impulsive move.
If this zone holds, we expect a new higher high to form, potentially targeting 3.80–4.00+ USDT.
Major Support Zone (~3.20–3.25 USDT):
Acts as long-term bullish defense.
In case of deeper retracement or shakeout, this is the key level to watch for possible trend continuation and re-entry.
📈 3. Structural Analysis and Price Projection:
The projected path on the chart shows a classic price action structure:
Impulse
Correction (toward minor support)
Next Impulse (break of recent high)
Higher low (continuation within trend channel)
Potential final push toward the 3.90–4.00 range
This type of Elliott Wave-inspired behavior suggests we're in wave 3 or 5 of a bullish sequence, with minor dips offering low-risk long setups.
📊 4. Candlestick & Market Behavior:
Recent candles show long lower wicks, suggesting buyers are stepping in during dips.
Bearish candles are relatively smaller and followed by immediate bullish response.
This indicates buy-the-dip sentiment, common in a trending market.
🔄 5. Trading Plan & Scenarios:
✅ Bullish Continuation (Base Case):
Wait for a clear bullish engulfing or price bounce at the minor support zone (~3.50 USDT).
Enter with confirmation: bullish candle close, volume spike, or trendline reaction.
Targets:
TP1: 3.80 USDT
TP2: 4.00–4.10 USDT
Stop Loss: Below 3.45 (or structure-based trailing stop)
⚠️ Bearish Case / Deeper Pullback:
If 3.50 fails, look for signs of accumulation around the major support (~3.20–3.25).
This zone can serve as the ultimate defense for trend continuation and provide a second long opportunity with better R:R.
🧠 6. Mindset for Traders:
Don’t chase: Let price come to your level, and focus on confirmation.
Trade with the trend: Structure supports bullish movement — trade in the direction of strength.
Use proper risk management: Define SL and TP before entering. Partial profits at key resistance zones are a smart strategy.
Avoid overtrading : Wait for structural retests or confirmation candles to stay on the right side of the market.

Gold (XAUUSD) – 22 July Outlook | Reversal Zones in FocusGold (XAUUSD) – 22 July Outlook | Three Key Reversal Zones to Watch
Yesterday, Gold gave a strong breakout above the key resistance level at 3377 , shifting the M15 structure bullish and confirming upside strength.
Today, the market is likely entering a retracement phase on both the H4 and M15 timeframes — a healthy pullback after a breakout, which may lead to the next leg of the uptrend.
So where should we focus for long opportunities?
We are observing three key zones as potential bases for the continuation move:
📍 Zone 1 – 3377.6–3373.5 (Breaker Block):
This is the immediate structure zone — previous resistance which may now flip into support.
→ If price respects this area, we can anticipate a classic S&R Flip setup.
📍 Zone 2 – 3367.5–3363 (Demand Block):
If the first level doesn’t hold, this zone becomes critical. It lies just under the breakout base and could act as the next level of defense by bulls.
📍 Zone 3 – 3358.5–3350.5 (H4 Order Block):
This is the most significant support zone for the day. It aligns with a higher-timeframe order block, making it a high-probability POI for a deeper pullback and reversal.
But remember, we do not predict blindly .
Plan of Action:
– Observe price behavior at each zone
– Wait for confirmation via M1 internal structure shifts + BoS
– Trade only when all conditions align
– SL: 40 pips | TP: 120 pips
Risk-Reward: Always 1:3
Summary:
✅ Structure is now bullish on M15 and H4
✅ We’re in a pullback phase — ideal for continuation trades
✅ Three clear POIs mapped — now we wait for the market to speak
Patience. Precision. Discipline.
Let the trade come to you — not the other way around.
📘 Shared by @ChartIsMirror

XLMUSDT, 1HrPattern is looking Good , If BTC is Sustaining Above 1,06,834 this level then , This XLM pattern will Give a Good Breakout ,
Enter only When Upper Trendline is Breakout
Take Your Own Risk According to your Capital .
Follow for More Ideas Like This

DOTUSDT , 1HrPattern is looking Good , If BTC is Sustaining Above 1,06,834 this level then , This DOT pattern will Give a Good Breakout ,
Enter only When Upper Trendline is Breakout
Take Your Own Risk According to your Capital .
Follow for More Ideas Like This

ADAUSDT , 1HrPattern is looking Good , If BTC is Sustaining Above 1,06,834 this level then , This ADA pattern will Give a Good Breakout ,
Enter only When Upper Trendline is Breakout
Take Your Own Risk According to your Capital .
Follow for More Ideas Like This

GBPUSD – 30m Buy Setup | FVG Entry + ChoCh + -27% Fib Target💷 GBPUSD Long Setup | May 8, 2025 | 30m Smart Money Model
This 30-minute GBPUSD chart shows a perfect Smart Money shift backed by a clean Change of Character (ChoCh), a deep pullback into a Fair Value Gap (FVG), and confirmation via breaker block reentry.
Let’s break it down:
🔍 KEY CONFLUENCES:
🟪 FVG between 1.32909 – 1.33112
🔄 ChoCh confirms structural shift from bearish to bullish
📉 Entry inside 50–79% Fib retracement (Discount Zone)
🧱 Breaker Block confluence with internal BOS
🎯 Target: -27% Fib extension = 1.33737
🛡️ Stop below 100% Fib ~1.32400
📈 Setup Specs:
Timeframe: 30min
Bias: Long
Entry Zone: 1.33090 – 1.33110
TP: 1.33737 (Fib -27%)
SL: ~1.32400
RR: Approx. 1:3.5+
💡 Why It Matters:
Smart Money often accumulates positions in hidden imbalances like this FVG zone. Retail traders get shaken out on the pullback — meanwhile institutions reload just below previous liquidity sweeps. The ChoCh confirms the shift, and boom — the liquidity vacuum fuels a launch to premium levels.
🎯 Chart Ninja Tip:
“ChoCh isn’t just a signal… it’s a signature. It tells you Smart Money is changing sides.”

USDCHF: One More Bearish Wave Ahead?! 🇺🇸🇨🇭
It looks like USDCHF has successfully completed a consolidation
after quite an extended bearish rally.
A breakout of a support line of an ascending triangle pattern
on a 4H time frame provides a strong bearish confirmation.
We can expect a movement down at least to 0.81 level.
❤️Please, support my work with like, thank you!❤️
I am part of Trade Nation's Influencer program and receive a monthly fee for using their TradingView charts in my analysis.

PhoenixLTD, 1W & 1DLooking very Good Channel Pattern and it is ready to Breakout
Enter into it after the upper trendline Breakout
it is Combination of Both Triangle and Channel Patterns , it can Break any time
so look an eye on it or make an Alert above trendline broke
Follow For More Swing Trade Ideas Like This

TataSteel , 1WThe Channel Pattern Breakout is looking very Good ,
we can consider this Breakout at this point also because it is at 20 EMA Support
if you are not Confident wait for Proper Retest to enter or if you want to take some risk then You can Enter at this Place .
Follow For More Ideas like this Swing Trade Ideas

28.03.25 Morning ForecastPairs on Watch -
FX:EURAUD
FX:AUDJPY
A short overview of the instruments I am looking at for today, multi-timeframe analysis down to what I will be looking at for an entry. Enjoy!

18.03.25 Morning ForecastPairs on Watch -
FX:EURNZD
FX:GBPNZD
FX:GBPUSD
A short overview of the instruments I am looking at for today, multi-timeframe analysis down to what I will be looking at for an entry. Enjoy!

17.03.25 Morning ForecastPairs on Watch -
FX:GBPAUD
OANDA:UK100GBP
FX:NZDJPY
FX:USDJPY
A short overview of the instruments I am looking at for today, multi-timeframe analysis down to what I will be looking at for an entry. Enjoy!

Learn How to Trade Cup and Handle Pattern on Forex & Gold
If you are studying a price action, you should definitely know how to identify and trade Cup and Handle pattern formation.
Being applied properly, it can generate big profits.
In this educational article, I will teach you how to identify this pattern. We will discuss its psychology and I will share with you 2 trading strategies.
📏And let's start with the structure of the pattern.
The pattern has 3 important elements:
Cup - long-term correctional movement that tends to move steadily from a bearish trend to a bullish trend.
Handle - short-term correctional movement with signs of bullish strength.
Neckline - upper horizontal boundary of the pattern - a strong resistance that the price constantly respects.
⚠️Being formed, it warns you about a highly probable coming bullish movement.
The trigger that confirms the initiation of a bullish wave is a breakout of the neckline of the pattern and a candle close above.
Here is the example of a completed C&H with a confirmed neckline breakout, indicating a highly probably coming bullish movement.
Depending on the preceding price action, Cup & Handle Pattern can either be a trend-following or reversal pattern.
📉If the pattern is formed after a bearish impulse. It is considered to be a reversal pattern.
Here is the example of a reversal C&H that I spotted on EURUSD.
📈If the pattern is formed at the top of a bullish impulse , it is considered to be a trend following pattern.
Here is the example of a trend following C&H that I spotted on GBPJPY.
The thing is that while the price forms the C&H, buying volumes are accumulating. Even though, buyers are hesitant and reluctant initially, their confidence grows, and the accumulation leads to explosive neckline breakout.
There are 2 strategies to trade this pattern.
✔️ Strategy 1.
That approach is quite risky , but the reward can be quite substantial.
You should monitor the price action when the price is creating a handle. Occasionally, the price starts trading in a falling channel: parallel or contracting one.
Your trigger will be a bullish breakout of its resistance and a candle close above.
Once the violation is confirmed, you can buy aggressively or set a buy limit order on a retest.
Stop loss will lie below the lows of the channel.
Target will be the closest key resistance.
Here is the example of the handle being a falling channel.
✔️ Strategy 2.
Wait for a breakout of a neckline of the pattern.
Once a candle closes above that, it will confirm the violation.
Buy the market aggressively or set a buy limit on a retest of a broken neckline then.
Stop loss will lie below the lows of the handle.
Target will be the closest key resistance.
Here is the example of the trade based on a confirmed breakout of a neckline of C&P on NASDAQ Index.
Applied properly, the strategies may reach up to 70% win rate.
As always, the best pattern will be the one that forms on a key level.
Try it, test it, and good luck in your trading journey.
❤️Please, support my work with like, thank you!❤️

USDCAD - Weekly forecast, Technical Analysis & Trading IdeasMidterm forecast:
1.39318 is a major support, while this level is not broken, the Midterm wave will be uptrend.
Technical analysis:
While the RSI support #1 at 47 is not broken, the probability of price decrease would be too low.
A trough is formed in daily chart at 1.34185 on 09/25/2024, so more gains to resistance(s) 1.44670, 1.46000, 1.46900 and more heights is expected.
Supports and Resistances:
1.46900
1.46000
1.38884
1.38168
1.37487
1.36876
1.36072
1.35404
1.34323
1.33664
1.31816
1.30929
__________________________________________
❤️ If you find this helpful and want more FREE forecasts in TradingView,
. . . . . Please show your support back,
. . . . . . . . Hit the 👍 BOOST button,
. . . . . . . . . . . Drop some feedback below in the comment!
🙏 Your Support is appreciated!
Let us know how you see this opportunity and forecast.
Have a successful week,
ForecastCity Support Team

Dollar Index (DXY): Ready to Recover?!
Dollar Index may start growing after a test of a key horizontal support.
We already see some signs of strength of the buyers on a 4H.
Goals: 108.70 / 109.35
❤️Please, support my work with like, thank you!❤️

EURCHF: Confirmed Bullish Continuation 🇪🇺🇨🇭
EURCHF may continue growing after a completion of a consolidation
on a key intraday/daily support.
A bullish violation of its resistance confirms that.
Goals: 0.9444 / 0.9456
❤️Please, support my work with like, thank you!❤️

USDCAD: Bullish Trend Continues 🇺🇸🇨🇦
USDCAD looks bullish after a breakout of a resistance line
of a bullish flag pattern on a daily.
Retesting that the price formed a double bottom on an hourly.
Nice the price will most likely increase more.
Goals: 1.4485 / 1.4490
❤️Please, support my work with like, thank you!❤️

CADJPY: Bearish Continuation Confirmed 🇨🇦🇯🇵
It looks like CADJPY is returning to a bearish trend.
The price completed a consolidation within a bearish flag
and violated its support with a high momentum bearish candle yesterday.
With a high probability, the pair will continue falling soon.
Next support - 107.15
❤️Please, support my work with like, thank you!❤️
