VIX: Fear vs Correction principleBased on principle, where highest probability is when:
-(SPX) 50/200 UP sloping.
-Full correction
-Positive "context" (fundamentals, that change every year. For instance next year theme is new FED chair. Beginning of QE money printing etc).
Some times SPX drops and VIX flies on "fear". but strong trend stays in tact. And sometimes there is a full exhaust, meaning going up is "easy" (no resistance).
Probabilities

A High Probability end for the Swing Pullback on EUR/USD Hey guys and gals!
Following up on our "A high probability market structure scenario on EUR/USD" you can see that statistical probabilities guided us through the break of the internal low.
So now what?
If you were short, what is a good target/exit?
Where is the Swing pullback likely to end?
We will let probabilities and data guide us.
-------------------------------------------------------------------------------
Of course, the Swing could always extend further, and if it does we have extended analysis for this.
But in any case, we will likely see at least a strong Internal Pullback from these levels where we can further assess.
-------------------------------------------------------------------------------
Thanks for your support. If you enjoyed this analysis, make sure to follow me so you don't miss the next one. And if you found it helpful, feel free to drop a like 👍 and leave a comment 💬, I’d love to hear your thoughts and am open to any questions or requests for analysis.
-------------------------------------------------------------------------------
💸💸💸💸💸💸
👇 👇 👇 👇 👇 👇

TA Never Fails, But Traders Often Do
Why Technical Analysis Doesn’t Fail, and How to Make It Work for You
Has it ever happened to you that your system or technical analysis gives you the perfect signal… and the trade still goes wrong? And then, other times, with the exact same pattern, everything clicks magically and you end up with textbook profits, the kind proudly posted on social media.
Every trader has felt that same confusion at some point. At some stage in their career, every trader has questioned whether technical analysis really works. And if that question still lingers unanswered in your mind, this post is for you.
Here, I’ll walk you through why technical analysis sometimes seems to work like magic and other times fails miserably, and, more importantly, how understanding its true role can turn it into a tool that meaningfully strengthens your trading
Understanding the Real Role and Reach of Technical Analysis
At its core, technical analysis (TA) studies past price and volume behavior. But here’s the key point many overlook: expecting it to predict the future with certainty is like assuming that because something happened under certain conditions once, it will play out exactly the same way again. That’s rarely true.
When you rely on a chart pattern or setup, what you’re really hoping for is that the market environment hasn’t changed much. But markets don’t stay still. They are dynamic, adaptive, and constantly shifting. That’s why sometimes the “perfect” signal delivers textbook profits… and other times it collapses into a loss.
I’m sure you can relate: you spot the perfect setup, take the trade with full confidence, everything looks aligned, and then Powell makes a comment, volatility spikes, and your stop is hit in seconds. Did technical analysis fail? Not really. The conditions changed, and the past environment could not be reproduced.
From this perspective, TA stops being a deterministic tool (“if price breaks support, the market will fall”) and becomes a probabilistic one (“if price breaks support, there’s a certain probability the market will fall”). This isn’t a weakness, it’s an honest recognition of the uncertainty that governs financial markets and their ever changing nature.
When we strip away the myths and put technical analysis in its rightful place, it becomes clear: at best, TA allows us to frame probabilities, never certainties. It’s not a crystal ball, it’s a framework for making informed probabilistic assessments in a world that will always remain uncertain.
Where the True Power of TA Really Lies
Take the classic example: “if price breaks support, the market has a higher probability of falling than of rising.” That statement doesn’t promise certainty, but if it turns out that, say, 60% of the time the market does fall after breaking support, then you’ve uncovered something valuable: an edge.
And here’s where trading shifts from chasing luck to building consistency. If out of every 10 trades, 6 follow through in your favor, then all you really need is solid risk management, for example, keeping a minimum 1:1 risk to reward ratio. Do that, and over the long run you don’t just “sometimes win,” you run a system with a positive expectancy.
Once you’ve found that edge, the real trick is repetition. And this isn’t just motivational talk, it’s math. Statistics has a law (and in science, a law means tested truth) that guarantees the more you repeat your process, the closer your actual results will move toward that expected 60/40 edge. With discipline and patience, the math will always pull you back toward being a long term winner.
This also means you don’t second guess yourself the next time the market breaks support just because the last time it didn’t work out (thanks, Powell). You keep playing your probabilistic edge. The outcome of a single trade is irrelevant, what matters is the process repeated over time. I wrote about this earlier, and it’s worth remembering: consistency in applying your edge always beats obsessing over one result.
TA as a Compass, Not a Crystal Ball
The smartest and most effective use of technical analysis is not to predict exact prices, but to build a probabilistic edge.
TA only becomes truly powerful when it’s integrated into a system with positive expectancy, not when it’s treated like an oracle. It’s not about guessing where the next tick will land, but about shaping a repeatable process that, over time, compounds into long term gains.
Seen in this light, TA stops being a magic wand and instead becomes a compass, a steady guide to help you navigate with consistency. You don’t need to know the exact shape of every curve in the road. What you need is a reliable compass and a clear map that, with enough repetition, will get you to your destination.
How to Make TA Not Fail You
The key takeaway is simple: the problem isn’t that technical analysis “fails,” but how we interpret it and what we expect from it. Demanding certainty only leads to frustration and blinds us to its real value.
Used probabilistically and as part of a structured system, TA becomes a valuable ally. So the next time that ‘perfect setup’ fails, don’t waste energy asking what went wrong. You already know, it’s just uncertainty doing its job. Don’t let it shake your confidence, and don’t let Powell, or anything else, ruin your day. Instead, focus on the next repetition, because that’s where your edge truly lives.
The market doesn’t owe you certainty. But with an edge and discipline, probability will reward you with consistency, and that’s what compounds into real results
________
👉 If you’d like to dig deeper into this mindset shift, check out my earlier post on True Laser Vision, where I explain why projecting the value of your account is infinitely more powerful than trying to project the price of an asset. And if you’d like a more structured walk through these ideas, visit my profile, you’ll find plenty of posts where I break down how probability, expectancy, and discipline can catapult your trading to the next level. Follow along if you want to keep sharpening these skills
Mastering the Edge: How Risk and Leverage Shape WinnersIn my last post, we discovered how expectancy works like a compass — giving us direction and helping us see the road ahead of our trading account. But a compass alone won’t move you forward. To actually get anywhere, you need an engine.
And that engine is risk management.
Many traders spend years looking for the “perfect” trading system, only to ruin it by stepping too hard on the gas. They don’t blow up because their strategy was flawed — they blow up because their risk was.
Risk per Trade: The Accelerator and the Brake
Think of risk per trade as the pressure you put on the accelerator. Risk too little, and your system barely moves. Risk too much, and you spin out of control.
When you risk a fixed fraction of your account, every trade slightly changes the size of the next one. This creates compounding — the same principle that builds fortunes when handled with care, but wipes accounts when abused.
The key takeaway is simple: risk is the throttle of your system. Push it wisely.
Drawdowns: The Valleys You Can’t Avoid
Every journey has valleys and peaks, and trading is no different. A drawdown is simply the distance between your highest equity peak and the valley that follows.
It’s not something you can avoid. Every trader, no matter how skilled, will walk through valleys. What matters is how deep they go — and whether you can climb back out. The bigger your risk per trade, the deeper those valleys will be.
Leverage: The Amplifier
Leverage doesn’t change your system; it amplifies it. It’s like turning up the volume on your speakers. A little more volume makes the music clearer. Too much, and the sound distorts, eventually blowing out the speakers.
In trading, leverage multiplies your effective risk. That means it can quickly push you beyond the “sweet spot” where your system grows steadily, into a dangerous zone where volatility eats away at your gains.
The point is not to avoid leverage altogether, but to respect it. Used wisely, it enhances your edge. Used carelessly, it magnifies every weakness until it breaks you.
Risk of Ruin: The Hidden Monster
Even with a profitable edge, there’s always a monster lurking in the shadows: risk of ruin.
In simple terms, risk of ruin is the probability that you’ll blow up your account before your trading edge has enough time to show itself. It’s not about whether your system works — it’s about whether you survive long enough to let it work.
Here’s the practical catch: leverage amplifies both your gains and your losses. And because losses are inevitable, leverage makes your drawdowns deeper. The real question every trader should ask is: will this amplified drawdown knock me out of the game too soon?
That’s why using leverage wisely is non-negotiable. Even a solid system can collapse if pushed beyond its limits. The trade-off is clear: grow steadily but safely, or chase faster growth and risk snapping the system in half.
Now, for those who like to peek under the hood, there is actually a scientific way to estimate the “sweet spot” for risk and leverage. Traders and mathematicians call it the Kelly Criterion. In this post we don’t go into formulas, but if you want to see the numbers, the simulations, and even play with your own scenarios, you’ll find a complete Python notebook in this GitHub repo (github.com).
Bringing It All Together
A trading system with an edge is like a powerful engine. But without managing the fuel (risk), the throttle (leverage), and the terrain (drawdowns), even the best engine can explode before reaching its destination.
This is why risk management isn’t just a technical detail — it’s survival. And here’s the truth: every profitable trader in the world, whether they know it or not, follows these principles. Some arrive at it through mathematics and statistics, others apply it intuitively. What outsiders often call “the touch” or “the magic” of a great trader is nothing mystical at all — It’s nothing more than the consistent application of probabilistic thinking, whether done consciously or unconsciously.
Strip away the charts, the buzzwords, and the noise, and you’ll always find the same foundation underneath: probability, expectancy, and risk control. Apply them consciously with tools and simulations, or apply them instinctively — either way, they are the invisible framework that separates survival from ruin, and consistency from chaos.
And if you want to see this foundation in motion, not as abstract ideas but as living numbers and scenarios, the GitHub notebook is there for you. It’s a way to pull back the curtain and watch how expectancy, Kelly criterion, leverage, and drawdowns truly shape the future of your trading account.
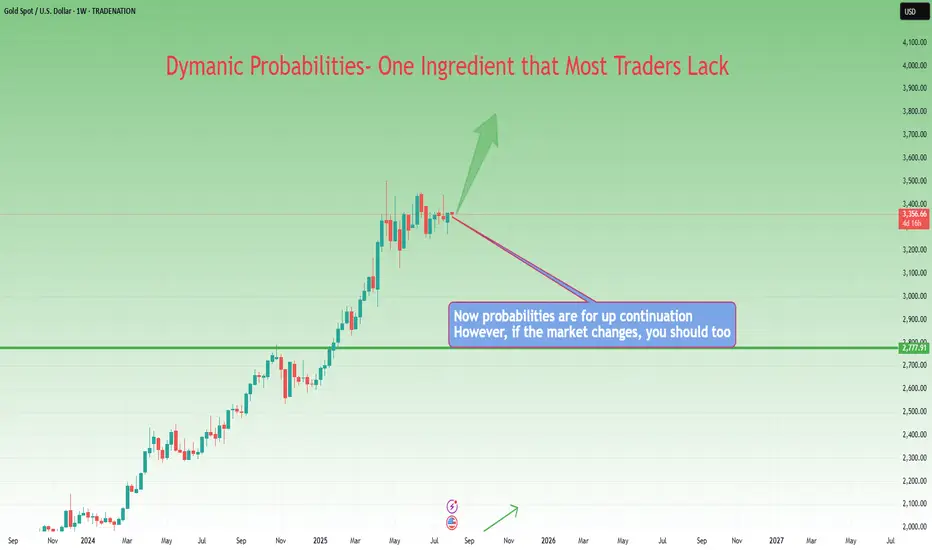
From Execution to Adaptation: Enter Dynamic ProbabilitiesIn the previous article , we looked at a real trade on Gold where I shifted from a clean mechanical short setup to an anticipatory long — not because of a hunch, but because the market behavior demanded it.
That decision wasn’t random. It was based on new information. On structure. On price action.
It was based on something deeper than just “rules” — it was about recognizing when the probability of success had changed.
That brings us to a powerful but rarely discussed concept in trading:
👉 Dynamic probabilities.
________________________________________
📉 Static Thinking in a Dynamic Market
Most traders operate with static probabilities — whether they realize it or not.
They assign a probability to a trade idea (let’s say, “this breakout has a 70% chance”) and treat that number as if it’s written in stone.
But markets don’t care about your numbers.
The moment new candles print, volatility shifts, or structure morphs — the probability landscape changes. What once looked like a clean setup can begin to deteriorate. Conversely, something that looked uncertain can start aligning into high-probability territory.
Yet many traders fail to adapt because they’re emotionally invested in the original plan.
They’ve already “decided” what the market should do, so they stop listening to what the market is actually doing.
________________________________________
🧠 Dynamic Probabilities Require Dynamic Thinking
To trade dynamically, you must be able to update your internal odds in real time.
This doesn’t mean constantly second-guessing or overanalyzing — it means refining your bias based on evolving context:
• A strong breakout followed by weak continuation? → probability drops.
• Price holding above broken resistance with clean structure? → probability increases.
• Choppy pullback into support with fading volume? → potential reversal builds.
It’s like playing poker: you might start with a good hand, but if the flop goes against you, your odds change.
If you ignore that and keep betting like you’ve got the nuts, you’re not being bold — you’re being blind.
________________________________________
📍 Back to the Gold Trade
In the Gold trade, the initial short was based on structure: broken support turned resistance.
The entry was mechanical, the reaction was clean. All good.
But then:
• Price came back fast into the same zone.
• Sellers failed to defend it decisively.
• The second leg down was sluggish, overlapping, and lacked momentum.
• Compression began to form.
That’s when the probability of continued downside collapsed — and the probability of a reversal increased.
The market had changed. So did my bias.
That’s dynamic probability in action — not because of a feeling, but because of evolving evidence.
________________________________________
🧘♂️ The Psychological Trap
Many traders intellectually accept the idea of being flexible — but emotionally, they cling to certainty.
They fear being “inconsistent” more than they fear being wrong.
But in a dynamic environment, consistency of thinking is not about repeating the same action — it’s about consistently reacting to what’s real.
True consistency is not mechanical repetition. It’s mental adaptability grounded in logic.
________________________________________
🧠 Takeaway
If you want to trade professionally, you must upgrade your mindset from fixed-probability execution to fluid-probability reasoning.
That doesn’t mean chaos. It means structured flexibility.
Your edge isn’t just in spotting patterns — it’s in knowing when those patterns are breaking down.
And acting accordingly, before your PnL does it for you.
Disclosure: I am part of TradeNation's Influencer program and receive a monthly fee for using their TradingView charts in my analyses and educational articles.
BTC DOMINANCE- BEARISH AFLife and Trading: Decisions Shape Outcomes
Life can shift dramatically in a single day—either for the better or worse. Everything boils down to the decisions you make, whether in heated moments or calm reflection. When chaos and panic dominate, your best refuge lies in creativity, knowledge and balls.
During the recent shakeout, I stayed silent—not because I lacked an opinion, but because moments like these require clarity. It’s like a car crash—you first ensure your safety before analyzing the damage. So, I distanced myself from the noise and dove deep into the charts.
Key Observations: Bitcoin Dominance
Bitcoin dominance, a critical indicator during altcoin crashes, was rising but met resistance at significant levels. Bearish arguments at that time included:
Weekly Bearish FVG respected
Daily Bearish FVG respected
Trendline retest confirming the break
Current Bearish Arguments:
PMH & PML respected
PWH & PWL respected
Weekly and Daily Bearish FVG respected
4H swing highs/lows respected
4H Bearish FVG respected
Strategy:
Given these signals, it’s tempting to go all-in on altcoins. However, I anticipate a ranging market until Christmas, followed by a dip below the 50% level—a precursor to a true altcoin bull market.
Be cautious: I expect another shakeout around December 18 or 23, where I plan to take significant positions. Always have a clear entry and exit plan to navigate these volatile waters.
Follow me to stay updated, and remember—this market rewards patience and preparation.
God bless you.
-Jay

Ethereum (ETHUSD) : Time to Position for Profits!Ethereum (ETH/USD) is currently positioned for a bullish breakout, and I am excited to share my analysis with fellow traders.
Bullish Sentiment and Technical Setup
The current price action shows ETH testing the $4,000 resistance level, which, if broken, could trigger a wave of FOMO buying, propelling prices towards $4,500 and beyond. With the Relative Strength Index (RSI) reflecting strong buying momentum, now is an opportune time to consider long positions.
I will be utilizing probabilities to strategically enter into long trades, focusing on support levels around $3,600 to $3,700 as potential entry points during any pullbacks.
Several fundamental factors are contributing to this bullish outlook:
Institutional Interest: Recent reports indicate that BlackRock has made a significant investment in Ethereum, purchasing over $230 million worth. This institutional backing is a strong signal of confidence in Ethereum’s future.
Market Dynamics: The overall cryptocurrency market is experiencing renewed interest as Bitcoin has surpassed the psychological barrier of $100,000. Historically, Ethereum tends to follow Bitcoin's lead, and this correlation suggests that ETH could also see substantial upward movement.
Technological Advancements: Ethereum's ongoing developments in DeFi and NFT sectors continue to attract users and investors alike. The upcoming upgrades and increased adoption are likely to bolster its price further.
In summary, the combination of technical indicators pointing towards a bullish trend and supportive fundamentals creates a compelling case for trading ETH/USD long.
As we navigate this exciting market landscape, I encourage fellow traders to stay vigilant and consider positioning themselves for potential gains in the coming weeks.
P.S. If you have any questions about how I trade probabilities with the overall market direction, feel free to reach out.
Let's capitalize on this momentum together!
2W:
Hourly Timeframe Entry:

POLKADOT- FUEL FOR A RALLYThe fuel is loaded, the engines are running-this rally is about to explode.
BINANCE:DOTUSDT

FANTOM BULLISH-POTENTIAL 6.39RRFantom (FTM): A Bullish Opportunity with Controlled Risk
BINANCE:FTMUSDT
The current price action of Fantom presents an attractive setup for taking calculated risks. Here are the key bullish arguments supporting this perspective:
Previous Monthly Low (PML - November): Disrespected, signaling strength.
Previous Monthly High (PMH): Disrespected, further affirming bullish momentum.
Monthly Bullish Fair Value Gap (FVG): Holding so far; confirmation expected by early Sunday morning.
Previous Weekly High (PWH): Disrespected.
Previous Weekly Low (PWL): Disrespected.
Daily Bullish FVG: Being respected, showing demand at this level.
4H Swing High: Disrespected.
4H Swing Low: Disrespected.
Bearish Arguments:
Previous Daily High (PDH): Respected, a minor resistance to watch.
Previous Daily Low (PDL): Respected.
Trade Management:
Stop Loss (SL): $0.84–$0.82
Take Profit (TP): $1.90–$1.88
Entry Zone: $0.9951–$0.9683
Risk-to-Reward Ratio (RR): 6.39
I am using Quantfury to manage this trade, a platform I find effective for precise execution.
Final Thoughts: The market appears poised for further upside, but stay disciplined and avoid being influenced by noise. The next five months are crucial for crypto, requiring full focus and adherence to your own strategies. Remember, every lesson comes from experience, not just from external opinions.
Stay patient, trade smart, and blessings to all!

XRPUSD on the Rise: Positioning for Profits with X1X2 AnalysisXRPUSD is currently positioned for a bullish breakout, and I’m excited to share my analysis using the X1X2 methodology to capture potential long opportunities.
In my approach, I will leverage probabilities to strategically get positioned for long entries.
Key Fundamentals Supporting the Bullish Bias
Several fundamental factors are contributing to this bullish outlook:
- Legal Clarity: Recent developments in regulatory clarity surrounding cryptocurrencies are fostering a more favorable environment for XRP, which is crucial as it aims to expand its use case in cross-border payments.
- Increased Adoption: There’s growing interest from institutional investors and partnerships that enhance XRP's utility within the financial ecosystem.
- Market Sentiment: The overall market is experiencing a resurgence, with Bitcoin's recent price action influencing altcoins positively, including XRP.
With the combination of technical analysis and supportive fundamentals, there’s a compelling case for entering long positions.
Let’s stay informed and ready to capitalize on the opportunities ahead!
Feel free to share your thoughts or questions below!
1M:
2W:
4H:
P.S. If you have any questions about how I trade probabilities with the overall market direction, feel free to reach out.

GBP/USD: Bullish Bias and Strategic PositioningToday, I’m excited to share my analysis on the GBPUSD currency pair, which is currently showing a strong bullish bias.
As we navigate through the market, I will be utilizing probabilities to strategically position myself for long trades.
Current Market Dynamics
The GBP/USD pair has recently shown resilience, bouncing off critical support levels around 1.2670. This rebound suggests a potential bullish reversal, driven by positive sentiment surrounding the UK economy.
Key fundamentals such as the Bank of England's recent decisions to maintain interest rates amidst inflationary pressures signal confidence in economic stability, which supports our bullish outlook.
Global Influences
On the global stage, factors such as a weakening U.S. dollar and improving economic indicators from the UK create a favorable environment for the British Pound. Additionally, geopolitical developments are leaning towards stability, which typically boosts investor confidence in GBP.
Trading Strategy
In this context, I plan to leverage statistical probabilities to identify optimal entry points for long positions. By focusing on key technical indicators, I aim to maximize potential gains while effectively managing risk.
Join me as we explore this exciting opportunity in GBP/USD! Let’s make informed trading decisions together and capitalize on this bullish momentum. Happy trading!
2W:
3H:
P.S. If you have any questions about how I trade probabilities with the overall market direction, feel free to reach out.

Bearish Signals: Time to Short ADAUSDAs I prepare to share my bearish trade idea for ADAUSD, here are key trends that support my outlook:
- Market Sentiment: Cardano (ADA) has faced a significant downturn, losing nearly 13% this week and about 41% year-to-date. This reflects growing concerns among investors and a lack of bullish momentum.
- Technical Indicators: A bearish divergence between ADA's price and daily active addresses suggests weakening demand, indicating potential further declines.
- Price Action: ADA is trading below crucial moving averages (20-day and 50-day), trapped in a declining channel. This reinforces the bearish sentiment as it approaches the lower boundary.
In my trading strategy, I focus on probabilities to position myself for short trades on ADAUSD.
In summary, by leveraging probabilities alongside market trends, I aim to strategically position myself for potential declines in ADAUSD.
This disciplined approach not only enhances my trading strategy but also aligns perfectly with the current bearish environment.
Join me as we navigate this market together!
P.S. If you have any questions about how I trade probabilities with the overall market direction, feel free to reach out.
4H:https://www.tradingview.com/x/IFRT8mYP/

Join My Bullish EUR/GBP Journey!Hey Traders! Today, I'm excited to share my bullish trade idea on the EUR/GBP currency pair. As we navigate through the current market dynamics, I believe there are several key fundamentals supporting this upward bias.
Current Market Fundamentals
- Economic Indicators: The upcoming release of the Confederation of British Industry (CBI) retail sales data is anticipated to show positive trends, which could strengthen the GBP. A robust consumer spending report can create a favorable environment for the Euro to gain against the Pound.
- Market Sentiment: Recent bullish candlestick patterns on the H4 chart suggest a potential reversal in the EUR/GBP pair. The price is currently hovering near the middle Bollinger Band, indicating a possible breakout.
- Technical Setup: The pair is trading between the 23.6% and 38.2% Fibonacci retracement levels, suggesting consolidation with potential for upward movement. This technical setup aligns with my bullish sentiment.
Utilizing Probabilities for Positioning
In my trading strategy, I emphasize the importance of probabilities to make informed decisions. Here’s why:
- Statistical Edge: By analyzing historical price movements and current market conditions, I can identify patterns that have a higher likelihood of repeating. This statistical approach helps me gauge potential outcomes more effectively.
- Risk Management: Using probabilities allows me to set realistic targets and stop-loss levels, ensuring that I manage risk while maximizing potential gains. For instance, if historical data shows a 70% success rate for bullish movements after similar setups, I can confidently position myself for long trades.
- Adaptability: Markets are dynamic; therefore, employing a probabilistic mindset enables me to adapt my strategy based on real-time data and changing conditions. This flexibility is crucial in maintaining an edge in trading.
Conclusion
With a bullish bias on EUR/GBP backed by solid fundamentals and a robust technical setup, I am ready to position myself for long trades using probabilities as my guiding principle.
Let’s keep an eye on the upcoming economic data releases and market movements that could further validate this trade idea.
Feel free to share your thoughts or any questions you may have! Happy trading!
1M:
2W:
2H:
P.S. If you have any questions about how I trade probabilities with the overall market direction, feel free to reach out.

Going Long on ETH: Strong Bullish Signals!Ethereum (ETH) is currently experiencing a bullish trend, supported by several key fundamentals:
Global Adoption and Institutional Interest
The cryptocurrency market, particularly Ethereum, is seeing increased adoption and institutional interest. Major financial institutions and corporations are exploring blockchain technology and decentralized finance (DeFi) applications, many of which are built on the Ethereum network.
Technological Advancements
Ethereum's ongoing upgrades and improvements, including the transition to Ethereum 2.0, are enhancing its scalability and efficiency. These developments are attracting more developers and users to the platform, potentially driving up demand for ETH.
Market Sentiment
Recent market analysis suggests a positive outlook for Ethereum, with some experts predicting significant growth potential. The breaking out of key resistance levels has fueled optimism among traders and investors.
Utilizing Probabilities for Long Positions
I'm employing probability-based strategies to enter long positions on ETHUSD.
By incorporating probability analysis into my trading approach, I aim to capitalize on Ethereum's bullish fundamentals while maintaining a structured and disciplined trading strategy.
Let's dive in!
2W:https://www.tradingview.com/x/t6j2hT4t/
2H:https://www.tradingview.com/x/prwKqAhU/

High-Probability SWI20 Longs with 57.78% Achieving TPI am adopting a probabilistic approach to my trading strategy based on historical and statistical data.
This method allows me to identify patterns and trends that have proven effective in the past, enabling me to make informed decisions about entering long positions.
By applying mathematical rules derived from historical performance, I can assess the likelihood of price movements and manage risk effectively.
This systematic approach helps to minimize emotional decision-making and enhances the potential for successful trades.
Key Fundamentals Supporting a Bullish Bias:
- Swiss Economic Resilience: Despite global economic challenges, Swiss equities are showing signs of recovery, with the Swiss SMI index rising 2% this year, indicating a potential bullish trend ahead.
- Central Bank Policies: The Swiss National Bank (SNB) has indicated a favorable inflation outlook, which could lead to supportive monetary policies that benefit the stock market.
- Currency Dynamics: The recent correction in the Swiss franc may ease pressure on exporters, potentially leading to improved earnings for companies within the index.
- Investment Inflows: Swiss-domiciled funds have recorded their highest net inflows since 2022, reflecting growing investor confidence in the Swiss market.
These factors collectively support a bullish outlook for the Switzerland 20 Index, aligning with my trading strategy.
2W:
HOURLY ENTRY:

Short Position on EURCAD: Strong Potential for TP SuccessKey Fundamentals Supporting a Bearish Bias:
- Eurozone Struggles: Recent economic reports indicate that the Eurozone is facing challenges, including sluggish growth and rising inflation. This could weaken the Euro as investors lose confidence.
- Interest Rate Outlook: The European Central Bank is taking a cautious stance on interest rates, while the Bank of Canada is likely to raise rates. This contrast could strengthen the Canadian Dollar against the Euro.
- Geopolitical Pressures: Ongoing issues in Europe, such as energy crises and trade disruptions, are creating uncertainty. This instability can further drag down the Euro's value relative to the CAD.
I'm focusing on short positions for EURCAD by using probabilities derived from historical data. By analyzing past trends and applying straightforward mathematical rules, I can spot high-probability trading opportunities.
This strategy helps me stay disciplined and make informed decisions, reducing emotional trading and increasing my chances of success.
Let's dive into the multiple timeframe top-down analysis together:
12M:
1D:
Hourly Entry:

My Bullish GBP/USD Strategy Using X1X2!You have no idea how many opportunities are there when you're simply following "X1X2"!
I invite you to engage with me in this analysis!
Current Fundamentals Supporting a Bullish Bias on GBP/USD:
1. Positive UK Economic Data: Recent reports indicate that the UK's GDP expanded by 0.2% in August, aligning with analyst expectations. Additionally, industrial production and manufacturing have shown growth, which supports the Pound's strength against the Dollar.
2. Diminishing US Dollar Strength: The US Dollar has faced selling pressure, particularly in light of recent mixed macroeconomic data. A softening inflation rate and rising initial jobless claims have raised concerns about the US economy, contributing to a bullish outlook for GBP/USD.
3. Market Sentiment Shift: An improving risk mood among investors has led to optimism regarding potential Federal Reserve rate cuts. This sentiment has weakened the Dollar, allowing GBP/USD to gain traction above key support levels.
Utilizing Probabilities in My Swing Trading Strategy:
In my trading approach, I employ a system known as X1X2, which focuses on probabilities to determine optimal entry points for long positions in GBP/USD.
In conclusion, my bullish bias on GBP/USD is supported by favorable economic indicators from the UK and weakening US economic data. By leveraging probabilities through my X1X2 system, I aim to position myself effectively for potential long trades in this pair.
1W:
3H:

ETHUSD: Bullish Bias with 58.65% Probability of Hitting TP1I'm feeling bullish on ETHUSD and looking to take some long positions.
My approach is all about using probabilities based on solid math and historical data from my charts.
Why probabilities?
They help me make smarter decisions by showing how often certain price levels have been reached in the past. This gives me a clearer idea of where I might want to enter and exit trades.
By analyzing past price movements, I can build my confidence in this trade and keep emotions in check.
With a 58.65% probability of hitting TP1, this setup looks like a great opportunity to ride the potential upward movement in Ethereum!
12M:
2W:
1H:
for more information check out my BIO!

USOIL: Multi-Timeframe Analysis | Strong Setup FormingI've been looking at various markets recently, and USOIL really stood out to me. I want to share how I analyze markets using a mechanical top-down approach across all timeframes to form my trading bias.
Top-Down Analysis:
This method is crucial in my trading strategy. It helps me stay objective by focusing on what the market is indicating regarding trends and key levels, rather than letting my personal opinions cloud my judgment.
By adopting a systematic approach, I've been able to reduce doubts and fears in my trading decisions.
Now, let's dive into the top-down analysis process.
12M:
2W:
6H:

Trade Idea for BTCUSDMy sentiment about BTCUSD is firmly bullish.
I plan to utilize probabilities to strategically position myself into long positions. This approach allows me to leverage statistical analysis and market behavior to enhance my trading decisions.
Several key fundamentals are currently influencing the market in a direction that aligns with my bullish bias on BTCUSD:
Institutional Adoption: There has been a notable increase in institutional interest in Bitcoin, with major firms investing heavily. This trend suggests growing confidence in Bitcoin as a long-term asset.
Economic Uncertainty: Global economic conditions remain volatile, leading many investors to seek alternative assets like Bitcoin as a hedge against inflation and currency devaluation.
Technological Advancements: Innovations in blockchain technology and increased acceptance of cryptocurrencies for transactions are contributing to a more robust ecosystem, enhancing Bitcoin's utility and attractiveness.
Conclusion
In summary, my bullish stance on BTCUSD is supported by both statistical probabilities and current global fundamentals. By strategically using probabilities, I aim to position myself advantageously in the market. This method not only enhances my trading strategy but also aligns with broader economic trends that favor the growth of Bitcoin.
Let’s dive into the top-down analysis together! Your thoughts and feedback are always welcome!
1D:
Hourly Timeframes:
If you found this analysis useful, please boost and comment! Your support helps us all grow!

Why EURUSD is Plummeting and How You Can Take Advantage of ItI am adopting a bearish bias on EUR/USD and will leverage probabilities derived from statistical and historical data to position myself for short trades.
By analyzing past market trends and current economic indicators, I aim to make informed decisions that enhance my trading success.
Key Fundamentals Supporting a Bearish Outlook:
- Interest Rate Differentials: The U.S. Federal Reserve is likely to maintain higher interest rates, which strengthens the USD against the EUR, especially as the European Central Bank (ECB) may consider rate cuts in response to economic challenges.
- Economic Performance: Recent economic data indicates that the Eurozone is facing significant headwinds, with disappointing growth figures that negatively impact market sentiment.
- Market Sentiment: Current market sentiment leans bearish towards the euro, with many traders already positioned short. This collective positioning could lead to further downward pressure on the EUR/USD pair.
These elements provide a solid foundation for my bearish outlook, making it an opportune moment to enter short positions.
1W:
HOURLY ENTRY:
If you require additional clarification, or wish to share your thoughts, don’t hesitate to drop a comment below!

Bullish Outlook on XRPUSDKey Reasons for a Bullish Bias:
1. Positive Market Sentiment: XRP has recently broken through an important resistance level, which shows that traders are feeling optimistic about its future.
2. Bullish Technical Patterns: An inverted Head and Shoulders pattern has formed, suggesting that XRP might be ready for a price increase.
3. Improving Regulations: Recent developments in cryptocurrency regulations are becoming more favorable, which could attract more institutional investors to XRP.
I plan to use probabilities based on historical data and the X1X2 methodology to enter long positions in XRP. Here’s why:
- Learning from the Past: By looking at past price movements and historical data of XRP, I can spot biases that might help predict future behavior.
- X1X2 Methodology: This method helps me identify key price levels to enter and exit trades, making my strategy more focused.
- Smart Risk Management: By using probabilities, I can set stop-loss orders at strategic points, reducing my risk and making more informed decisions.
In summary, with a positive market outlook and a solid trading strategy based on historical data and mathematical rules, I’m confident in taking long positions in XRPUSD.
Traders, if you found this idea helpful or have your own thoughts on it, please share in the comments. I’d love to hear from you!
12M:
2W:
1H:

LTCUSD: Strong Bullish Momentum with 68.87% Probability for TP1!I’m optimistic about Litecoin (LTCUSD) right now, and here are some compelling reasons to consider this trade:
- Market Recovery: The overall cryptocurrency market is bouncing back, with many coins, including Litecoin, showing positive price movements after recent dips.
- Growing Adoption: More people and businesses are starting to use cryptocurrencies for transactions, which could increase demand for Litecoin.
- Tech Improvements: Litecoin is undergoing updates that make it more efficient and user-friendly, attracting more interest.
- Positive Sentiment: Many analysts are optimistic about the future of cryptocurrencies, suggesting that prices could continue to rise.
To get positioned for long trades on LTCUSD, I rely on probabilities based on historical data in a mechanical trading system.
In short, my bullish outlook on LTCUSD is supported by strong market fundamentals, and by using probabilities from historical data, I aim to position myself effectively for potential long trades.
Please share your ideas and charts in the comments section below!
12M:
2W:
6H:
