15M/30M Possible Wyckoff Distribution on $SPYFor tomorrow for me it's pretty simple, looking at the 15M and 30M charts.
Break above $685 with some force and I re-analyze what I thought was a Wyckoff Distro on the 15M/30M charts.
Chop between $683 & $685, then look for a break below $685 and it aligns with Phase C > Phase D LPSY.
Not financial advice, I am a regard.
Put

Bullish Thesis for INTC Intel Stock in 2025If you haven`t bought INTC before the previous earnings:
Now Intel INTC is positioned for a potential turnaround and upside by the end of 2025, driven by strategic leadership changes, foundry business expansion, AI innovation, and favorable geopolitical dynamics. Here’s why INTC could head higher this year:
1. Leadership Transformation and Strategic Vision
The appointment of Lip-Bu Tan as CEO in March 2025 has injected new optimism into Intel’s prospects. Tan is a respected semiconductor industry veteran, and his arrival was met with a 10% jump in INTC’s share price, reflecting renewed investor confidence in the company’s direction.
2. Foundry Business Expansion and Government Support
Intel’s pivot toward a foundry-centric model is gaining momentum. The company is leveraging its U.S.-based manufacturing footprint to attract domestic and international clients, especially as geopolitical tensions and trade restrictions make U.S. chip production more attractive.
There is speculation about strategic partnerships, such as TSMC potentially acquiring a stake in Intel’s foundry operations, which could accelerate technology transfers and client wins.
The U.S. government is likely to continue supporting domestic semiconductor manufacturing through incentives and tariffs, directly benefiting Intel’s foundry ambitions.
3. AI and Next-Gen Product Launches
Intel is aggressively targeting the AI and data center markets. The upcoming Jaguar Shores and Panther Lake CPUs, built on the advanced 18A process node, are set for release in the second half of 2025. These chips will be available not only for Intel’s own products but also for external clients like Amazon and Microsoft, expanding the addressable market.
Intel’s renewed focus on AI accelerators and competitive cost structures could help it regain share in high-growth segments.
4. Financial Resilience and Market Position
Despite recent setbacks, Intel remains a dominant player in the PC CPU market and continues to generate substantial revenue, outpacing some key competitors in the latest quarter.
Analysts have revised their short-term price targets upward, with some projecting INTC could reach as high as $62—a potential upside of over 170% from current levels.
Forecasts for 2025 suggest an average price target in the $40–$45 range, with bullish scenarios pointing even higher if execution on foundry and AI strategies meets expectations.
5. Technical and Sentiment Factors
While technical analysis currently signals caution, the $18.50–$20 zone has provided strong support, and any positive news on foundry contracts or AI wins could catalyze a breakout from current consolidation patterns.
Market sentiment has shifted more positively following the CEO change and strategic announcements, suggesting the potential for a sustained rebound if Intel delivers on its promises.
In conclusion:
Intel’s combination of visionary leadership, foundry expansion, AI innovation, and favorable geopolitical trends sets the stage for a potential stock price recovery by the end of 2025. With analyst targets and investor sentiment turning more bullish, INTC presents a compelling case for upside as it executes its turnaround strategy
Disclosure: I am part of Trade Nation's Influencer program and receive a monthly fee for using their TradingView charts in my analysis.

ONDS Ondas Holdings Options Ahead of EarningsAnalyzing the options chain and the chart patterns of ONDS Ondas Holdings prior to the earnings report this week,
I would consider purchasing the 10usd strike price Calls with
an expiration date of 2028-1-21,
for a premium of approximately $3.95.
If these options prove to be profitable prior to the earnings release, I would sell at least half of them.

PUT CALL BUY SIGNAL IS NOW GIVEN AGAIN The chart is my work in put/call model I use to take positions . We are now into a level of heavy put buying once again which in MOST not All cases have lead to rally phase . I have taken a 25 % long again after missing the rally on monday but the rally in rsp means they are shifting away from leverage to late stage . I still have 6950 in sp cash min and in qqq a 643 . We could see one more drop in Bitcoin to a minor new low and this would setup a much bigger counter trend rally in BITCOIN to 96/106 targets for the right shoulder into 12/15 date best of trades WAVETIMER The longs are mid 2027 calls ONLY

DE Deere & Company Options Ahead of EarningsAnalyzing the options chain and the chart patterns of DE Deere & Company prior to the earnings report this week,
I would consider purchasing the 510usd strike price Calls with
an expiration date of 2025-12-19,
for a premium of approximately $8.95.
If these options prove to be profitable prior to the earnings release, I would sell at least half of them.

Put sale on TEMStrong stock. Innovative space. Buy low, sell high? $1.30
:-)
Around the 200 sma. 2 1/2 weeks is bread and butter. And getting stocks down there, I would be pleased.

MU Micron Technology Options Ahead of EarningsIf you haven`t bought MU before the rally:
Now analyzing the options chain and the chart patterns of MU Micron Technology prior to the earnings report next week,
I would consider purchasing the 155usd strike price Calls with
an expiration date of 2025-10-17,
for a premium of approximately $9.55.
If these options prove to be profitable prior to the earnings release, I would sell at least half of them.
Disclosure: I am part of Trade Nation's Influencer program and receive a monthly fee for using their TradingView charts in my analysis.

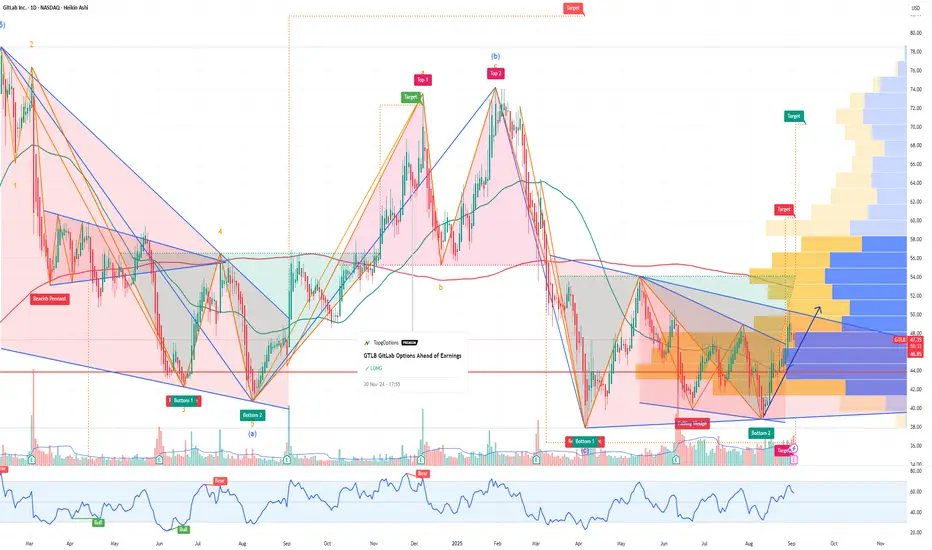
GTLB GitLab Options Ahead of EarningsAnalyzing the options chain and the chart patterns of GTLB GitLab prior to the earnings report this week,
I would consider purchasing the 50usd strike price Calls with
an expiration date of 2026-3-20,
for a premium of approximately $7.80.
If these options prove to be profitable prior to the earnings release, I would sell at least half of them.
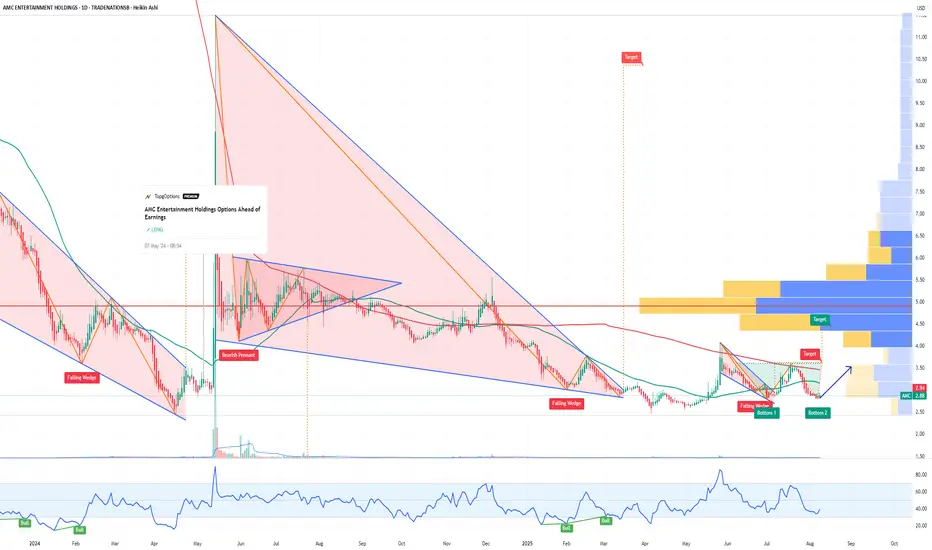
AMC Entertainment Holdings Options Ahead of EarningsIf you haven`t bought AMC before the last breakout:
Now analyzing the options chain and the chart patterns of AMC Entertainment Holdings prior to the earnings report this week,
I would consider purchasing the 2.50usd strike price Calls with
an expiration date of 2025-8-29,
for a premium of approximately $0.52.
If these options prove to be profitable prior to the earnings release, I would sell at least half of them.
Disclosure: I am part of Trade Nation's Influencer program and receive a monthly fee for using their TradingView charts in my analysis.
PINS Pinterest Options Ahead of EarningsIf you haven`t bought PINS before the previous earnings:
Now analyzing the options chain and the chart patterns of PINS Pinterest prior to the earnings report this week,
I would consider purchasing the 39usd strike price Calls with
an expiration date of 2025-8-8,
for a premium of approximately $2.22.
If these options prove to be profitable prior to the earnings release, I would sell at least half of them.

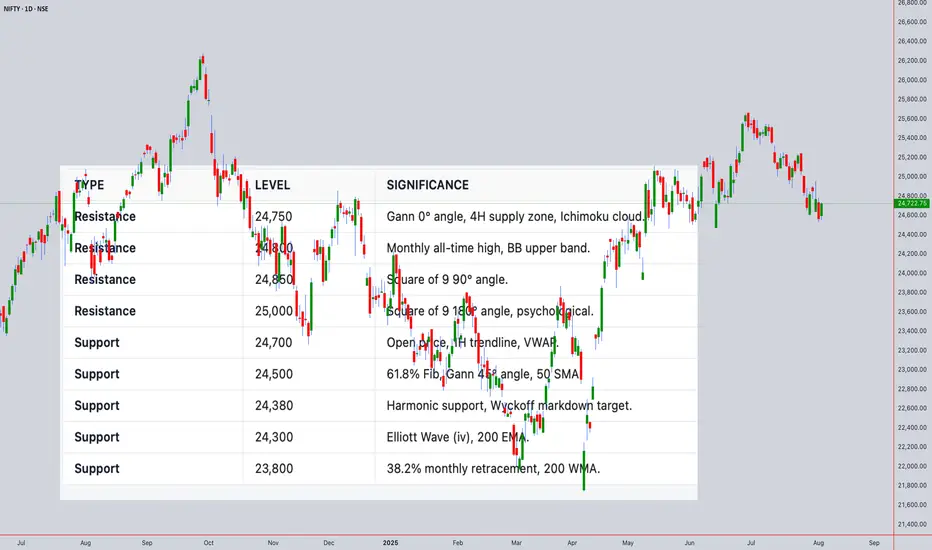
NIFTY50 Closing Price: ₹24,722.75 (4th Aug 2025, 02:00PM UTC+4)Comprehensive Technical Analysis for NIFTY50
world wide web shunya trade
Closing Price: ₹24,722.75 (4th Aug 2025, 02:00PM UTC+4)
Time Frames:
Intraday: 5M, 15M, 30M, 1H, 4H
Swing: 4H, Daily, Weekly, Monthly
1. Japanese Candlestick Analysis
Intraday (5M-4H)
4H: Bearish Engulfing at 24,722.75 signals rejection of highs.
1H: Dark Cloud Cover below 24,750 confirms weakness.
30M/15M: Shooting Stars at 24,720 indicate exhaustion.
5M: Three Black Crows pattern suggests strong bearish momentum.
Outlook: Bearish reversal likely if 24,700 breaks.
Swing (4H-Monthly)
Daily: Gravestone Doji at 24,722.75 warns of trend exhaustion.
Weekly: Bearish Harami after 3-week rally signals distribution.
Monthly: Long-legged Doji at all-time highs (24,800) indicates indecision.
2. Harmonic Patterns
Intraday
4H/1H: Bearish Butterfly completing at 24,722.75 (D-point).
PRZ: 24,700–24,750 (127.2% XA + 161.8% BC).
30M: Bullish Crab forming at 24,600 (secondary setup).
Swing
Daily: Bearish Gartley near 24,750 (78.6% XA retracement).
Weekly: Potential Bullish Bat at 24,500 if correction extends.
3. Elliott Wave Theory
Intraday
4H: Wave 5 of impulse cycle peaked at 24,722.75.
Structure: Completed 5-wave sequence from 24,200 → 24,722.75.
Corrective Phase: ABC pullback targeting 24,500 (Wave A).
1H: Sub-wave (v) ending with RSI divergence.
Swing
Daily: Wave 3 of primary bull cycle nearing completion at 24,750.
Weekly: Wave (iii) of larger impulse, expecting Wave (iv) correction to 24,300.
Monthly: Wave V of multi-year bull run, nearing major resistance at 24,800.
4. Wyckoff Theory
Intraday
Phase: Distribution (after markup from 24,200 → 24,722.75).
Signs: High volume at 24,722.75 (supply), failed upthrust above 24,750.
Schematic: Phase C (markdown) initiating.
Swing
Daily: Late Markup → Distribution at 24,750.
Weekly: Accumulation completed at 23,500; now in Markup but showing signs of exhaustion.
5. W.D. Gann Theory
Time Theory
Intraday: Key reversal windows:
UTC+4: 10:00–12:00 (resistance test), 14:00–16:00 (trend reversal).
Swing:
Daily: 8th Aug (4 days from close) for time squaring.
Weekly: 12th Aug (1 week) for cycle turn.
Square of 9
24,722.75 → Resistance Angles:
0° (24,750), 90° (24,850), 180° (25,000).
Support: 45° (24,500), 315° (24,250).
Angle Theory
4H Chart: 1x1 Gann Angle (45°) from 24,200 low at 24,500. Price overextended.
Daily Chart: 2x1 Angle (63.75°) at 24,722.75 acting as resistance.
Squaring of Price & Time
Price Range: 24,200 → 24,722.75 (522.75 points).
Time Squaring: 522.75 hours from 24,200 low → 24,750 resistance.
Ranges in Harmony
Primary Range: 24,000–25,000 (1,000 points).
50% Retracement: 24,500 (critical support).
61.8% Retracement: 24,380.
Secondary Range: 24,500–24,750 (250 points).
Price & Time Forecasting
Intraday Targets:
Short-Term: 24,500 (61.8% Fib).
Extension: 24,380 (Gann 45° angle).
Swing Targets:
Weekly: 24,300 (Wave (iv) target).
Monthly: 23,800 (38.2% retracement of entire bull run).
6. Ichimoku Kinko Hyo
Intraday (4H)
Cloud (Kumo): Price below Kumo (bearish).
Tenkan-sen: 24,700 (flat, resistance).
Kijun-sen: 24,650 (support).
Chikou Span: Below price (confirms bearish momentum).
Swing (Daily)
Cloud: Thick cloud resistance at 24,750–24,800.
Tenkan/Kijun: Bearish crossover at 24,700.
7. Indicators
Intraday
RSI (14): 68 (4H) → Overbought; divergence at highs.
Bollinger Bands: Price tagging upper band (24,750); contraction signals volatility.
VWAP: 24,680 (acting as dynamic resistance).
Moving Averages:
50 SMA: 24,600 (support).
200 EMA: 24,400 (major support).
Swing
Daily RSI: 72 (overbought, divergence).
Weekly BB: Upper band at 24,800 (resistance).
Monthly VWAP: 23,500 (major support).
200 WMA: 22,800 (long-term bull support).
Synthesized Forecast
Intraday (Next 24H)
Bearish Scenario (High Probability):
Trigger: Break below 24,700 (1H close).
Targets: 24,500 (T1), 24,380 (T2).
Timeline: 8–12 hours (UTC+4 22:00–02:00).
Bullish Scenario (Low Probability):
Trigger: Sustained close above 24,750.
Target: 24,850 (Gann 90° angle).
Swing (1–4 Weeks)
Bearish Scenario:
Targets: 24,300 (Wave (iv)), 23,800 (38.2% retracement).
Timeline: 5–10 trading days.
Bullish Scenario:
Trigger: Close above 24,800.
Target: 25,200 (Gann 180° angle).
For those interested in further developing their trading skills based on these types of analyses, consider exploring the mentoring program offered by Shunya Trade.(world wide web shunya trade)
I welcome your feedback on this analysis, as it will inform and enhance my future work.
Regards,
Shunya.Trade
world wide web shunya trade
⚠️ Disclaimer: This post is educational content and does not constitute investment advice, financial advice, or trading recommendations. The views expressed here are based on technical analysis and are shared solely for informational purposes. The stock market is subject to risks, including capital loss, and readers should exercise due diligence before investing. We do not take responsibility for decisions made based on this content. Consult a certified financial advisor for personalized guidance.
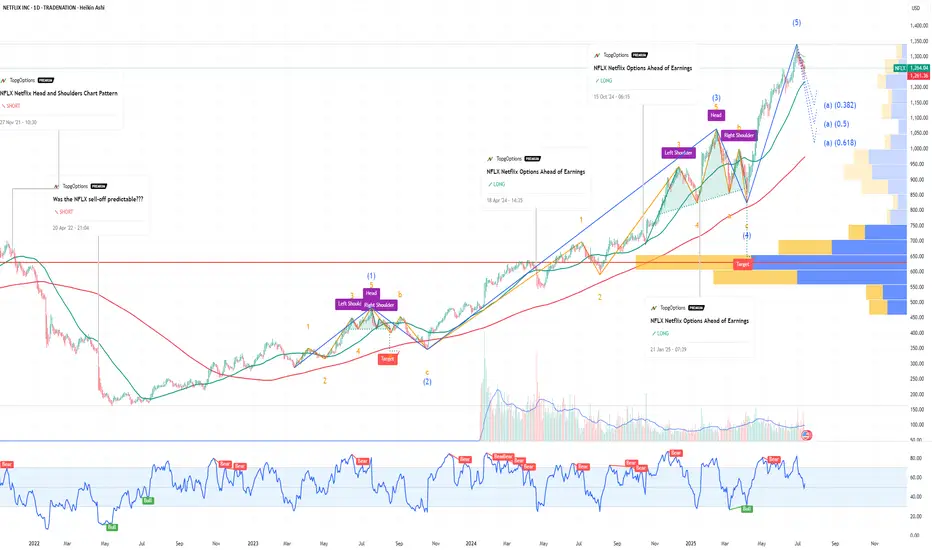
NFLX Netflix Options Ahead of EarningsIf you haven`t bought NFLX before the previous earnings:
Now analyzing the options chain and the chart patterns of NFLX Netflix prior to the earnings report this week,
I would consider purchasing the 1260usd strike price Puts with
an expiration date of 2025-9-19,
for a premium of approximately $71.10.
If these options prove to be profitable prior to the earnings release, I would sell at least half of them.
Disclosure: I am part of Trade Nation's Influencer program and receive a monthly fee for using their TradingView charts in my analysis.
$AMD Swing Trade – Put Debit Spread Setup🔻 NASDAQ:AMD Swing Trade – Put Debit Spread Setup (Jul 18 Exp)
📅 Trade Opened: July 3, 2025
🛠 Strategy: Buy to Open (BTO) Put Debit Spread
📉 Strikes: $31 / $30 (Jul 18 Expiration)
💵 Cost (Premium Paid): $0.21
🎯 Trade Thesis
This setup aims to capture short-term downside in NASDAQ:AMD via a low-cost, defined-risk spread. The trade fits within my broader portfolio of OTM spreads under $0.25.
Key Drivers:
🔻 Semi sector under pressure – NASDAQ:AMD showing relative weakness.
📉 Breakdown below key support near $31 and rejection at VWAP.
🧾 Weak momentum – MACD trending down, RSI near 44.
🔄 Trade enters into earnings season volatility.
📊 Technical Setup (Daily)
EMA(4) < EMA(8) < EMA(15): Bearish structure fully intact.
VWAP: Price rejected from 30-day VWAP zone.
MACD/RSI: Momentum still fading, no signs of bullish divergence.
⏳ Strategy Notes
Max loss: $0.21
Max gain: $0.79
Risk/reward structured for a drop into or below $30
Expiration: July 18
🧠 Journal Note
Most of my trades are swing-based using OTM debit spreads with tight risk control. No same-day entries — setups must have defined technical compression and short-term catalysts.

NKE NIKE Options Ahead of EarningsIf you haven`t sold NKE before the previous earnings:
Now analyzing the options chain and the chart patterns of NKE NIKE prior to the earnings report this week,
I would consider purchasing the 62usd strike price Calls with
an expiration date of 2025-7-3,
for a premium of approximately $2.29.
If these options prove to be profitable prior to the earnings release, I would sell at least half of them.
Disclosure: I am part of Trade Nation's Influencer program and receive a monthly fee for using their TradingView charts in my analysis.

QQQ NOTICE TREND LINE SUPPORT I have now started to position for the transition in the markets I have moved out of all calls again for the 4 time in 4 days each of the trades made $$ . but today is day 39 TD of the rally . And I am looking for a TOP in day 40 TD I have now moved to 40 today then 75% MOC in spy and qqq 5550 555 560 QQQ puts 2026 time zone and 650 in spy . The trendline has held rather nice to help make some nice $$ and we if bullish should now be in early wave 3 of 5 of 5 of 5 .So why buy puts NOW simple answer is It could still be wave c up for wave B or wave D. and That today is day TD39 I have posted a possible Major top due on td 40 and The spiral hold up into june 6th to 9th .I know my risks and am willing to start taking the same stand and positions as I did 11/29 12/6 and feb 18th based on the wave structure and PUT /CALL model . I am willing to This is not for all traders . But I am turning down in NYSI and the NYMO is showing buying is running out but bullish call buying is nearing the two last TOPS . I have 25 % cash and will wait for two things One put call drops to 60 on 5 day or 10 day at 65 second daily RSI is no confirmation . 3rd the qqq reaches 531/534 knowing it could extend to 541/555 and similar in sp cash or the DJI prints a .786 this is a lot but it is part of the game plan best of trades WAVETIMER

AVGO Broadcom Options Ahead of EarningsIf you haven`t bought AVGO before the rally:
Now analyzing the options chain and the chart patterns of AVGO Broadcom prior to the earnings report this week,
I would consider purchasing the 250usd strike price Calls with
an expiration date of 2025-6-13,
for a premium of approximately $14.75.
If these options prove to be profitable prior to the earnings release, I would sell at least half of them.
Disclosure: I am part of Trade Nation's Influencer program and receive a monthly fee for using their TradingView charts in my analysis.

PUT CALL MODEL SELL SIGNAL is Been given The chart is my own model Take notice of the green arrows and that trend line Notice anything ??? I do hope so . The trend is your friend till the End Time to hold my Beer ! best of trades WAVETIMER 85 % long puts waiting and hoping for a final POP .

NVDA NVIDIA Corporation Options Ahead of EarningsIf you haven`t bought NVDA before the previous earnings:
Now analyzing the options chain and the chart patterns of NVDA NVIDIA Corporation prior to the earnings report this week,
I would consider purchasing the 131usd strike price Puts with
an expiration date of 2025-6-20,
for a premium of approximately $7.00.
If these options prove to be profitable prior to the earnings release, I would sell at least half of them.
I`m overall bullish long term on NVDA.
Disclosure: I am part of Trade Nation's Influencer program and receive a monthly fee for using their TradingView charts in my analysis.

PUT CALL SELL SIGNAL IS NOW IN PLACE I am 100% short The chart posted is the put/call model We popped thru the bb bands I have now moved to a 100 % puts in the money dec 26 on qqq and spy I will add if the qqq can print 494 or the Spy can print and new high The cycle top was due 5/12 is a minor n MAJOR Best of trades Wavetimer

LMT Lockheed Martin Corporation Options Ahead of EarningsIf you haven`t bought LMT before the recent rally:
Now analyzing the options chain and the chart patterns of LMT Lockheed Martin Corporation prior to the earnings report this week,
I would consider purchasing the 490usd strike price Calls with
an expiration date of 2025-9-19,
for a premium of approximately $18.35.
If these options prove to be profitable prior to the earnings release, I would sell at least half of them.

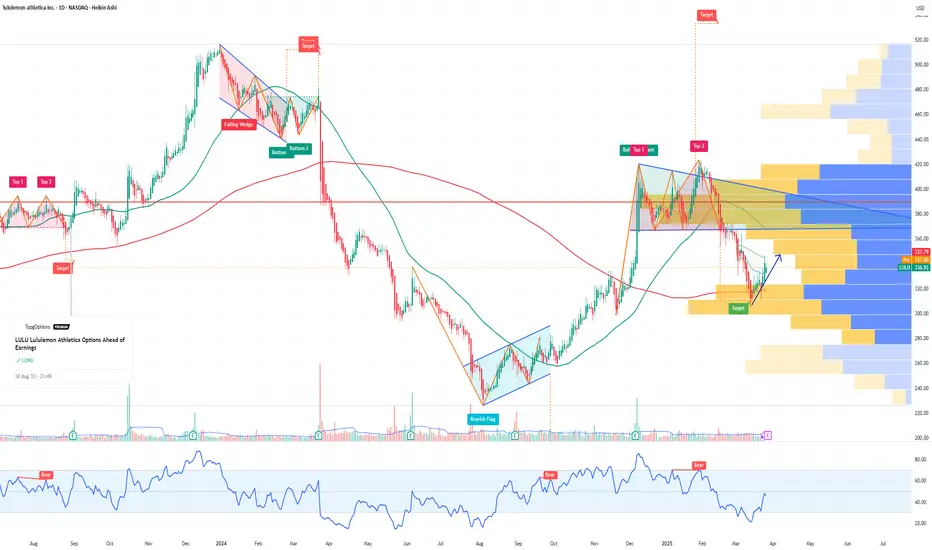
LULU Lululemon Athletica Options Ahead of EarningsIf you haven`t bought LULU before the previous rally:
Now analyzing the options chain and the chart patterns of LULU Lululemon Athletica prior to the earnings report this week,
I would consider purchasing the 337.5usd strike price Calls with
an expiration date of 2025-4-17,
for a premium of approximately $20.75.
If these options prove to be profitable prior to the earnings release, I would sell at least half of them.
Short Position Targeting Below $3,000🔍 Market Analysis After Durable Goods Orders Release
The latest Durable Goods Orders (MoM) for February 2025 were released today, showing a surprising 0.9% increase, while economists had expected a 1.0% decline. However, core capital goods orders fell by 0.3%, indicating weaker business investment.
These mixed figures create uncertainty in the markets. The strong durable goods orders support the U.S. dollar, while the drop in business investment may signal economic concerns. In the short term, the expectation that the Federal Reserve (Fed) will not rush to cut interest rates could put pressure on gold prices.
📉 Trading Idea: Short Gold from $3,025 to Below $3,000
Entry: $3,025 (already opened)
Gold is currently trading around $3,025, showing signs of weakness near resistance levels.
Why This Short Trade Makes Sense:
1️⃣ U.S. Economic Data Supports the Dollar
The unexpected rise in durable goods orders suggests economic resilience.
A stronger U.S. dollar typically weighs on gold prices.
2️⃣ Lower Expectations for Fed Rate Cuts
These data points may reduce expectations for imminent Fed rate cuts.
Higher rates increase the opportunity cost of holding gold, which is bearish for gold.
3️⃣ Technical Resistance & Downward Momentum
Gold has struggled to break above $3,025 - $3,035 multiple times.
If this level holds, we could see a drop below $3,000 soon.
📊 Price Targets & Stop-Loss
🎯 First Target: $3,000 (psychological support level)
🎯 Second Target: $2,985 - $2,975 (next key technical support zone)
📌 Risk-Reward Ratio (RRR):
Entry: $3,025
Target: at least $3,000
RRR = 1.66 : 1 – a solid setup for a short-term trade.
🧐 Potential Risks to the Trade
⚠ If the U.S. Dollar Weakens:
If markets interpret weak core capital goods orders as a sign of economic slowdown, the Fed might shift to a more dovish stance, weakening the dollar and boosting gold.
⚠ If Geopolitical Tensions Increase:
Rising geopolitical risks (e.g., China, Middle East) could drive safe-haven demand for gold, pushing prices higher.
📌 Conclusion: Bearish Setup for Gold
Today’s Durable Goods Orders release supports a stronger U.S. dollar, while gold is struggling to break resistance at $3,025 - $3,035. As long as this zone holds, the probability of a correction below $3,000 remains high.
🟢 Plan:
Short at $3,025 is active.
Target: Below $3,000.
Gold remains volatile – keep an eye on the U.S. dollar, Fed policy, and market sentiment for further confirmation! 🔥🚀
-------------------------------------------------------------------------
This is just my personal market idea and not financial advice! 📢 Trading gold and other financial instruments carries risks – only invest what you can afford to lose. Always do your own analysis, use solid risk management, and trade responsibly.
Good luck and safe trading! 🚀📊

FDX FedEx Corporation Options Ahead of EarningsIf you haven`t sold FDX before the previous earnings:
Now analyzing the options chain and the chart patterns of FDX FedEx Corporation prior to the earnings report this week,
I would consider purchasing the 240usd strike price Calls with
an expiration date of 2025-3-21,
for a premium of approximately $12.00.
If these options prove to be profitable prior to the earnings release, I would sell at least half of them.
