Bitcoin first daily close above the rangeYesterday bitcoin retested the 200D ema which is a very bullish sign.
But it didnt stop there, bitcoin pushed through and had it's first close above the previous range.
For us these are clearly very bullish signals and we are pretty positive for the upcoming months.
Rangebreakout

PYPL looking to break all-time-highs?PYPL made a new all-time-high in February of 2021 and now it's looking to make new all-time-highs.
Fundamentally:
* Sales growth quarter over quarter is more than 30%
* Earnings-per-share expected to grow +5% over the next year
Technically:
* Beta score of over 1
* General up-trend
* In rage from year-to-date
* Found new support at $289.46
* Steady volume as it makes new support
Trade Idea:
* Look for buying opportunities near its new support of $289.46
* A break below that, $277.87 should hold as support since it's acting a pivot
OR
* Wait for a weekly close above $309.14 to confirm the break

HCA pressuring to break all-time-highHCA is consolidating after a large move up.
Buying pressure came in on 25th of June 2021 and set $204 as support. Since then buying volume has decreased but not by a lot. That's why HCA is positioning it self for a breakout.
Looking at the longer time-frames, it's showing a clear up trend and it's also expected to grow its earnings-per-share over the coming year.
Looking at the price-action HCA may come back to retest the $212.50 to $214.30 region before making a move higher.
A break below $212.50 could send the price to retest the support of $200.
Final Thoughts:
* Good long term hold
* Pays dividends
* Buying pressure from June 25th, 2021 set $204 as a solid support pushing the price higher
Two things you can do from here if you want to trade this
* Look for buying opportunities around $212.50 and $214.30
* Wait for a clear break of $217.36
* A break and close below $212.50 may negate the immediate bullish outlook

DLong

V breakout following tonnes of buying pressureV (Visa) is making new all-time-highs following a tonne of buying volume that kicked in last week.
Looking at the weekly or even monthly chart, it's clear that V has been doing very well through the years.
This is definitely one to keep your eyes on and one to have in your long term portfolio as it pays out dividends as well.
Final thoughts:
* Look for buying opportunities around the $236.30 to $237.50 range

SYNH Broke out of after months of consolidationIt's been months since SYNH has been consolidating and it finally broke out today.
Tonnes of buying pressure came in early June that proved $80.30 as a solid support level. Since then SYNH has been heading up.
Looking at the weekly or even monthly charts you can see that the company's been doing really well with the stock showing a clear up trend.
With the stock making a new all-time-high and the company expected to well in the coming year, it's clear that the stock should continue to move higher.
Technicals
* Stock made a double bottom
* Confirmed the double bottom as it broke and closed above $89.95
* Measured objective for this pattern would be around $99.61
Final thoughts
* Breakout wasn't with a lot of volume so be on a look out for a retest of the broken level
* Look for buying opportunities around the breakout point between $88.90 and $90
SLong

TPX broke out after consolidationTPX broke out after consolidation that was followed by a massive up trend since the March 2020 crash.
* It has volume
* It's making all-time-highs
* It has momentum
I think this can come back to retest the 40.45 area or consolidate above the breakout for a bit before moving higher.
Final thoughts:
* Look for buying opportunities in the $40.45 to $41.04 area
* Great long term hold since it pays out dividends as well.

JINDALSAW - VERGE OF RANGE BOJINDALSAW - extremely at an interesting point.
Took a fake dip with dried volumes and the price is rising since then with great volume buildup.
- On the Verge of strong Range BO
- Bullish RSI levels
- Good volume profile.
One can go long above 103.5 with SL of 80-84 WCB
Targets of 125/160/200 look good.

GBPUSD - Trading the Break of Trendline and Mirror LevelHi Traders!
The market is moving after its fall-off in a Range.
It even made higher Highs and rejected the Break of the Support three times.
Beside the Resistance, we also have a Trendline which is coming from above.
The upper Resistance is also a Mirror Level, because it was a Support, too, before.
The target is the "Golden Zone" of the Fibonacci Retracement Tool, which is normally defined by the area between 50.0% and 61.8%.
The TP would be at the R2 from today's Pivot Points.
We recommend to trade the Retest of the Breakout!
Thanks and successful Trading :-)!

Hudco Buy ! We can expect 60-70 Levels in HUDCO ! If Sustain Above retest level with strong volume
do You research Before investing !

Reliance Industries Breakout Trade (RELIANCE 1D)Hello Guys,
Today I am Going To Share you one Breakout Idea of Reliance Industries .From the Date of 15 OCT 2020 we can see that the stock in was Range shown in the picture. Now The stock is holding in the upper side of the Range. The volumes is seen in Reliance In Past Few Trading Sessions. It is planning for giving a breakout. if Breakout happens it will be good trade for the market also. We Can expect Targets Of Reliance between 2550-2600.
please trade in reliance with suitable quantity for you. and take care of your Risk Management. Don't Jump Directly In it.
Keep An Eye On it Like Eagle.
Stock Name :RELIANCE
Current Price:2221.60 (17-JUN-2021 10:08AM)
Target Price:2550-2600
Stoploss:2050
RR Ratio : 1:2

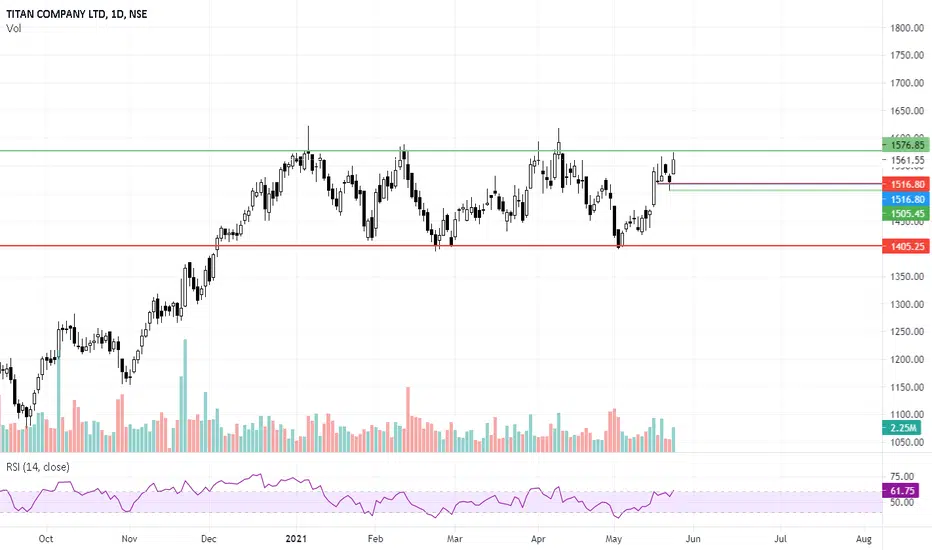
Keep Titan on Radar for Breakout TradeTitan is one such stock that has been trading in a range of about 15% for the past 5 months.
The Recent rally from range support ( the move I already captured - please refer to linked post ) looks quite good and the stock currently is trading at the range upper end, any breakout might bring a fresh buying in the stock and it can move
towards 1700 and 1750 levels.
DOT-USDT(Range Breakout)Polkadot facilitates cross-chain communication and interoperability among chains by connecting them into one unified network (Relay Chain).
In the month of April, DOT has given a Range Breakout , it is currently taking support from the upper band of the channel and is today forming a strong bullish candle.
Key Levels to watch out for-
The support to the lower side is present at ~$39.5 while may travel upside to the levels of ~$52 .

AVAX-USDT(Range Breakout)Avalanche aims to be the Internet of Finance. It is an open-source platform that allows it to deploy blockchains either public or private, launch smart contracts and create digital assets on its platform.
On March 9, 2021, AVAX gained ~34% and since then, it is trading in that range.
Currently, it has given a breakout from the range($24-$35) and is signaling strong strength to initiate a fresh bullish move to the upside.
Key levels to look out:-
The supports to the lower side are placed at ~$34.88 followed by ~$33.5 respectively.
The resistance to the higher side are placed at $42.5 and $47 respectively.

BNB-USDTBinance has been the talk of the town and has served cumulative monthly trading volumes worth ~$690 billion in the month of February. Also, DeFi protocols on Binance smart chain are also gaining a lot of traction, which is pushing the BNB price higher.
Binance has been trading in a Descending Channel and has given a fresh breakout from its channel resistance and is now confined in a tight range of $242.5 - $257 .
Key Levels to watch out:-
A breakout above the immediate resistance at $265 is most likely to trigger the prices higher to the first level of $295 followed by $330.
The support to the lower side are present at $240 and $225 respectively.

MATIC-USDT(Range Breakout)Matic, renamed Polygon, has been performing extraordinarily well. In the past 30 days, it has appreciated by more than 400%.
In the 1 Hr Time Frame, Matic has been trading in a range. It has given a Range breakout followed by the Retest as shown.
Key Levels to watch out:-
The support to the lower side is placed at $0.215 followed by $0.2 .
The resistance to the higher side is present at $0.275 and $0.29 .
MLong

XTZ-USDT: Consolidation Breakout(1 Hr TF)In the Daily TimeFrame, Tezos is trading in an Ascending Channel formation with an upper band and the lower band placed at $5.1 and $2 respectively.
In the Hourly Time Frame, Tezos has been in the accumulation phase and was trading in a range of $3.83 as the upper band and $3.22 as the lower band.
XTZUSDT has given a Range Breakout and is currently trading above the range.
Key Levels to Watch out:-
The resistance to the higher levels is placed at $4.4 followed by $5.1 respectively.
The supports to the lower side are placed at $3.5 and $3.2 respectively.

BTC breakout of 45k-51k Looking to long weekly open back up to 55k , 60k and eventually 75k as 'top' target.
giving the sl a bit more room under the low of the deviation.

KNR CONMULTIYEAR BREAKOUT ABOVE 350
FULL FORCE ABOVE THIS LEVEL.
TARGET 400, 535+++
SL: 315
RISK IS YOURS and Reward is too yours totally

SHOP Catching Support?After breaking its 5+ month range on 12/16, SHOP appears to be taking a breather onto support at the range high of 1112 level. Volume tapering off after the holidays. Waiting for confirmation of a bounce. Break of the upper trendline on price and/or RSI.
SLong

$ada possible range breakout Starting to gain some levels, needs to gain + hold 0.184~ for a trade to trigger imo.
Watching this for now, lets see


