lol imagine not buying as much shift as you can here....dumped to the bottom of a 6month + range over the course of 3 days with significant volume, worth the shot here, not to mention shift is actually good tech :)SLongby cryptokenneth2
USDCAD 4H LONG TRADESPair is in a range Price bounced off bottom Price may move through range and retest top of range Long Trade Buy Limit @ 1.3338 Buy Stop @ 1.3353 1st Buy Take Profit @ 1.3370 2nd Take profit @ 1.3399 3rd Buy Take Profit @ 1.3438 SL 10 pips below range bottom Watch Macd for direction Void trade if range bottom is broken Longby TradingstrategyguidesUpdated 7
GBPUSD - Rebound at Bottom of Ascending TriangleGBPUSD was seen rebounding off from the bottom of an ascending triangle within a demand zone. The price has retraced from the rebound was supported twice at 1.3030 and may be ready to take off very soon. Furthermore, GBPUSD is still experiencing the process of a ranging market and thus it makes sense to simply buy at the bottom.Longby AlgoVentureUpdated 7
USDJPY Range BoundUSDJPY trading range bound between about 109 and 114 over the last two years. The downside breakout that happened can most likely be attributed to the major market correction at the beginning of 2018. Even despite a 4Q 2018 that had a dismal December, it failed to break support. by pshootz3
ETHUSD 1H KELTNER BREAKOUT OR RANGE TRADE COMING?Look at current previous Keltner posts for breakout and range trading rules Keltner Channel is flattening out Breakout could be Bullish or Bearish Range trade - check 9 post ago - "Know what to look for in a Range Pattern" Leave your comments below what strategy your will use for this breakout or range trading setup.by TradingstrategyguidesUpdated 6
TRADING RANGING MARKETS WITH KELTNER BANDSTrading Ranging Markets with Keltner Channel It is said that the number one account killer in the market is a ranging market. Consolidations are very difficult to trade. However, you can take advantage of the difference in the way Keltner channel system can be used in combination with other technical indicators. The price won’t really touch the bands when it bounces between the upper and lower envelopes. When we’re in a ranging market, you’ll often see that the price will fail to touch the bands. The majority of the time the price will hug the middle band. This anomaly in price behavior requires us to use a secondary technical indicator to find profitable trades. Since the Forex market spends most of its time in consolidation, around 70% of the time, it’s mandatory to have a range trading strategy to survive in this market. For range trading we like to use Keltner Channel bands in combination with a 2-period RSI indicator. We tweaked the RSI settings so we can better identify tops and bottoms within a trading range. Note #3: For this Keltner trading strategy we use the 90-10 levels of overbought and oversold readings. Here are some rules that can guide you to make the best trading decisions: Keltner envelopes need to turn flat, to signal a consolidation. Price needs to break below the middle band. A buy order is triggered once the 2-period RSI goes below 10 indicating oversold conditions. The protective stop loss can be hidden on the other side of the Keltner band. For the long side take profit when the RSI reaches the 90 level.Educationby Tradingstrategyguides3
WABI/BTC - potential buy areaBlue triangle indicates the current range. Green box is buy. Red box is sell. Blue line indicates major resistance. WABI looks to be floating at the bottom of the range and presents a good opportunity for a long to the top of the range. A daily close outside of the range will indicate a breakout. Target 1: 0.00006700WLongby Halams5
TNTBTC - fresh chart after pumpBlue triangle indicates the current range. Green box is buy. Red box is sell. Blue line indicates major resistance. TNTBTC pumped earlier than expected and came to the top of the range where I decided to sell. I expect a close within the range and will be looking to buy back in at the two smaller green boxes.Tby Halams331
KNOW WHAT TO LOOK FOR IN A RANGE PATTERNThe market is working a range pattern the majority of the time which is good news if you know what to look for. Range patterns are full of information that will help you anticipate what comes next, so you can trade. Here are 3 examples that will make you chart smarter! The first chart is my personal favorite range pattern. When you see a well established range, watch for price to "overshoot" your expected high or low. When that happens, get ready! As soon as it goes past the expected high or low, place pending orders to sell from the top or buy from the bottom. If price comes back to the range, it will come back fast! The 2nd chart is an example of past performance predicting future price movement. During a range pattern, look back 15 bars from the middle of the range, and anticipate the market moving that far in the opposite direction. In this example, the solid arrow is predictive of the dashed arrow. The last chart is an example of how the typical slow or no momentum you would expect is happening in the middle third, shaded in orange. To and from the outer edges of the range, momentum shows up.Educationby Tradingstrategyguides5
EURUSD 4H BEARISH RANGE TRADEPair is in a range Price failed a bullish breakout attempt Watch Macd for confirmation of direction Short Trade Sell Stop @ 1.1327 1st Sell Take Profit @ 1.1295 2nd Sell Take profit @ 1.1255 Find your SLShortby TradingstrategyguidesUpdated 4
AUDCAD at Resistance - SELL - Range tradeAUDCAD is at major resistance Stop loss set above 0.9490 First level of take profit is at 0.9420 Stoch RSI signalling further downside Shortby ForexStoreau11
TIPS FOR RANGE TRADINGRanges contain elements of certainty which are rare in a speculative industry. With previously established highs and lows, you can anticipate where the market is likely to hold, change direction or stop all together. 5 interesting facts about range patterns when charting price action. 1 - The range pattern is good for traders who are terrible at cutting their losses. The nature of a range is to not make progress in one direction, so this is the best pattern to trade if you don’t like taking your stops. If the market moves against your open trade during a range, your patience may be rewarded, because chances are price will swing back in your direction. 2 - Ranges contain areas where you can expect momentum. That sounds like a contradiction, right? It's not. You can expect the typical slow market condition in a range, but only in the middle third of the range space. Count on momentum showing up when it runs to and from the outer edges of the range. 3 - Past performance predicts future movement. You’ve heard it - you’ve probably even said it - “Past performance is no guarantee of future results.” However, when it comes to range patterns, I keep track of where price has been in the past 15 bars. Do the math because that’s exactly how far you can expect price to move in the opposite direction in the next 15 bars. 4 - After a trend, it only takes 7 bars of time in the range pattern to tell me which direction is coming next. Add the 50 simple moving average to your chart. If price crosses that line and stays below it for more than 7 bars, it’s probably not going to return to the trend any time soon. 5 - The best range trades happen when your expected high or low is suddenly obliterated. Huh? It's true, and this is my secret weapon in trading. If price breaks out of a well established range pattern, immediately place pending orders to trade in the opposite direction. If price fails the breakout (which it usually does), it comes barreling back through the range pattern, and those trades move into profit very quickly. Educationby Tradingstrategyguides225
Range trading: Forex as for 15/03/2019 Under that heading we publish signals of the indicator called “Ranger” . It was developed by our experts for intraday trading purposes. This indicator is based on statistical analysis of the data and provides information about possible maximum/minimum values of the day (just right after the day has started) with certain probabilities. What does this information give to the trader? Actually, a lot. First of all, trading signals. For example, if during a day the price approaches the upper (lower) mark, it can be concluded that it will not go higher (lower) prescribed mark today with already known probability. So, you can open a position opposite to the current movement, knowing in advance that it will be profitable with a certain probability. EURUSD Long position 1 (The price today will not fall below this mark with a probability of 68%) 1.1271 Long position 2 (The price today will not fall below this mark with a probability of 95%) 1.1247 Long position 3 (The price today will not fall below this mark with a probability of 99%) 1.1223 Short position 1 (The price today will not rise above this mark with a probability of 68%) 1.1354 Short position 2 (The price today will not rise above this mark with a probability of 95%) 1.1378 Short position 3 (The price today will not rise above this mark with a probability of 99%) 1.1402 GBPUSD Long position 1 (The price today will not fall below this mark with a probability of 68%) 1.3129 Long position 2 (The price today will not fall below this mark with a probability of 95%) 1.3055 Long position 3 (The price today will not fall below this mark with a probability of 99%) 1.2982 Short position 1 (The price today will not rise above this mark with a probability of 68%) 1.3348 Short position 2 (The price today will not rise above this mark with a probability of 95%) 1.3422 Short position 3 (The price today will not rise above this mark with a probability of 99%) 1.3496 USDJPY Long position 1 (The price today will not fall below this mark with a probability of 68%) 111.38 Long position 2 (The price today will not fall below this mark with a probability of 95%) 111.19 Long position 3 (The price today will not fall below this mark with a probability of 99%) 110.99 Short position 1 (The price today will not rise above this mark with a probability of 68%) 112.00 Short position 2 (The price today will not rise above this mark with a probability of 95%) 112.20 Short position 3 (The price today will not rise above this mark with a probability of 99%) 112.39 Calculations are based on the historical data and history doesn’t necessarily repeat this particular day. Recall, that mentioned probabilities are not 100% and do not guarantee risk-free trading. by Trade24Fx1
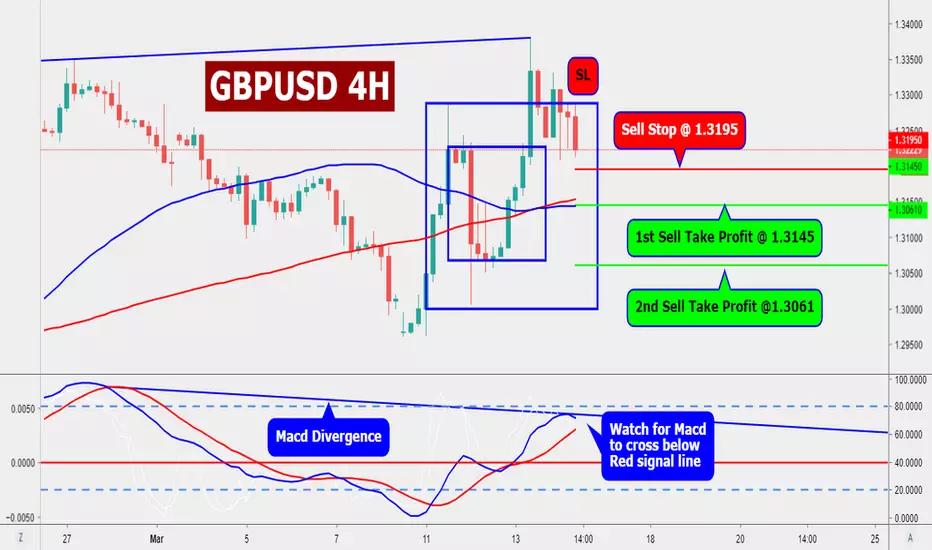
GBPUSD 4H SHORT TRADEMacd has divergence Watch for Macd to cross below Red signal line Short Trade Sell Stop @ 1.3195 1st Sell Take Profit @ 1.3145 2nd Sell Take Profit @ 1.3061 Find SL Shortby Tradingstrategyguides9
$AMZN Amazon Rangebound $1600 - $1720No telling direction as of yet, except for sideways...until Amazon shows otherwise.by currencyprinter0
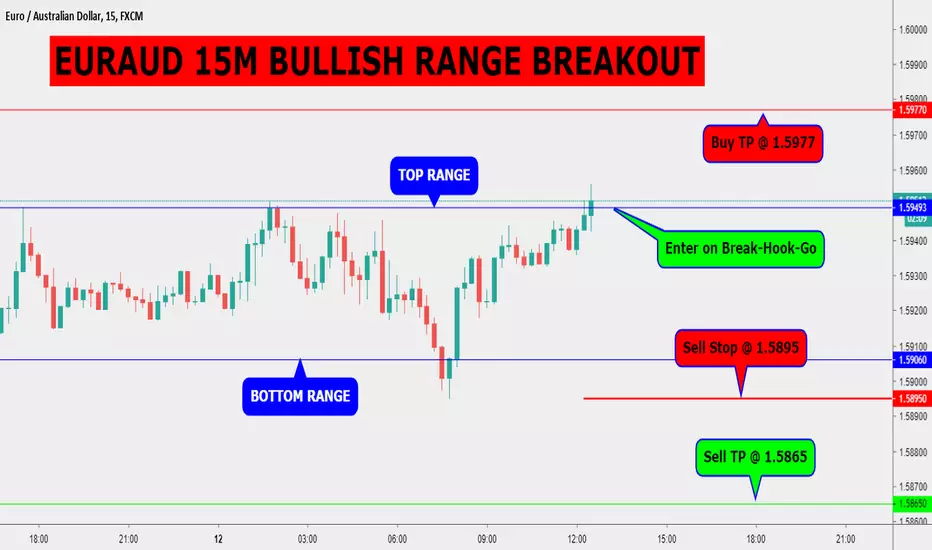
EURAUD 15M RANGE BREAKOUTPrice has been in a short range pattern Long Trade Enter on Break-Hook-Go @ 1.5949 Buy Take Profit @ 1.5947 Short Trade Sell Stop @ 1.5895 Sell Tke Profit @ 1.5865 SL 30 pips from entry priceby TradingstrategyguidesUpdated 5
WHAT'S UP WITH THE EURUSDWeekly Chart: Fib levels - Sup/Res - Trendline Daily Chart: Directional arrows 4H: Range levels 1H: Entry of breakout by TradingstrategyguidesUpdated 2
$TWTR #Twitter trading in a range with levels identified.Twitter, currently trading at $30.04, looks to be headed to support around $26.80, after which it should see a bounce, then decision time.by currencyprinter2
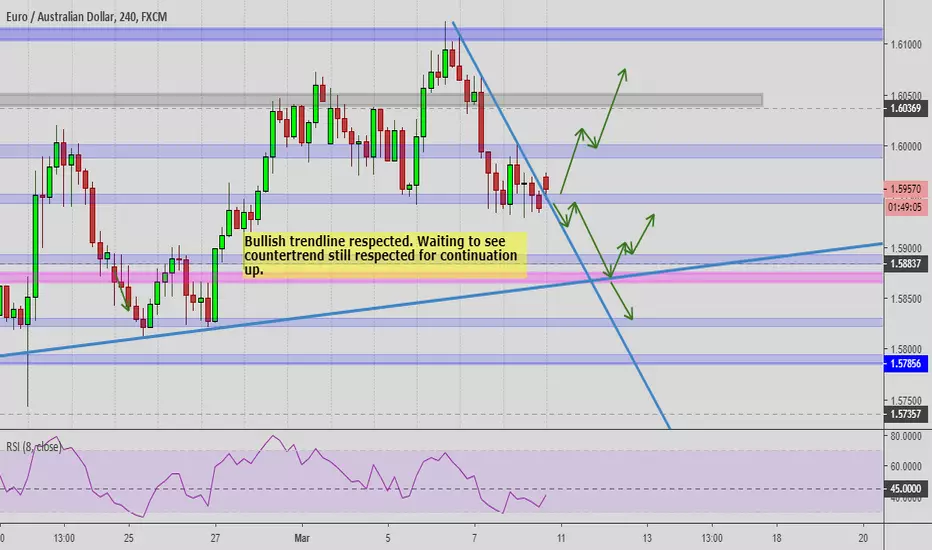
Confirmation From Countertrend For Possible Bull RunI really can't wait to get out of this zone. Bullish trendline is still respected to showing signs we're going up. Waiting to see if countertrend will still be respected for continuation or rejected for a bigger setup further down. Just have to wait and see. BULL TPs: If bounces off overall trendline - 1.59428 1.59880 1.60369 1.61046 BEAR TPs: 1.58922 1.58297by NikaJourney0
USDCAD 4H SHORT TRADEPair is in a range with a possible fake bullish breakout Price is at a resistance trendline may bounce bearish Short Trade Sell Stop @ 1.3295 Sell Take Profit @ 1.3236 Find SLShortby TradingstrategyguidesUpdated 4
BTCUSD DAY BREAKOUT1. Wait for the Daily candle to close outside of the consolidation trendline. 2. Be sure the close includes descend volume or pass on it. 3. Trade in the direction of the trade. 4. Set Stop Loss to 1.5x of ATR 5. Set you 1st Take Profit to 1x of ATR 6. Close 1/2 trade at 1st TP 7. Follow stops on second half to maximize profit. 8. Risk no more than 2% of your trade balance on this trade.by Tradingstrategyguides2
Possible Swing Trade Long on EURAUDEURAUD has been ranging for quite some time. It's been ranging for so long, that it created an ugly inverse head and shoulders patterns within it. This may be giving a possible indication where the market may move once the breakout begins. Since it's inching its way up, I'm looking to go long for the swing trade. A bearish harmonic was formed thanks to the news earlier last week causing a retracement to 1.58837. Price can either come back down to retest the trendline again to reconfirm bullish direction or just continue its move upward from the daily SR 1.58837 and make the attempt to break out of the range. If a buy, TPs are: 1.59452 1.59831 1.60369 (top of range) If breakout does occur, swing trade target TP is 1.61599. If a sell, it may be short term since it is still in the range. Has to break trendline and pass 1.58271 zone to be considered a decent trade. Possible TPS: 1.57856 1.57360Longby NikaJourneyUpdated 0