Gold softens after Fed minutes as smokestacks cap every rally Is there any way we can get a December rate cut now?
Gold has softened after the release of the minutes from the Federal Reserve's last interest rate decision.
The minutes show there’s no unified push toward cutting, which could make a December move unlikely.
Several Federal Reserve officials supported lowering rates in October, but others preferred keeping policy unchanged, and some pushed back firmly against easing.
Technically, XAUUSD continues to form smokestacks, printing repeated double-top structures. The price is now hovering around 4,070, sitting under possible short-term resistance at 4,150. XAUUSD losing the 50-day MA further could shift bias more decisively lower.
Ratecuts

Projecting Interest Rates Beyond the Current Fed RegimeCBOT: 10-Year T-Notes Futures ( CBOT:ZN1! )
Since hitting an all-time high (ATH) of 48,431 on November 12th, the Dow Jones Industrial Average lost 1,841 points, or -3.8%, to 46,590 on Monday.
Meanwhile, the Nasdaq Composite has lost over 1,300 points, or -5.5%, from its ATH of 24,020. The S&P 500 is down 250 points, or -3.6%, from 6,920. Both the Nasdaq and the S&P reached their ATH on October 29th.
Cryptocurrencies have been harder hit than stocks. Today, Bitcoin prices dropped below $90,000, a whopping 29% drawdown since the King of Crypto hit ATH of $126,080. An entire year of gains has been erased.
Two key market forces are driving the US stock market downtrend.
Firstly, Wall Street grew worried about the AI bubble bursting. Earlier this month, “Big Short” investor Michael Burry grabbed headlines after his Scion Investment’s 13F filing showed bearish bets on Nvidia (NVDA) and Palantir (PLTR). Last week, Softbank offloaded all 32.1 million shares of NVDA it held. This is followed by Peter Thiel’s hedge fund, which sold off all 537,742 shares of NVDA on Monday.
On my October 27th commentary, I discussed that heavy exposure in High Tech stocks (64%) made Nasdaq very venerable. The Dow could weather the downturn better with a lower weight (21%). The recent market trend resonates with my theory.
Secondly, the Federal Reserve has turned hawkish on monetary policy. The Fed made the last rate cut on October 29th, without the aid of updated economic data due to US government shutdown. Fed officials have warned that further rate cuts are not a sure thing if new data does not support policy easing.
On October 27th, the odds for a December cut were 98.5%, according to data from the CME FedWatch tool. Today, it went down sharply to just 57%. Not cutting has the same effect as raising expected interest rates, which tends to drive down stock valuation.
www.cmegroup.com
The Future is Less Uncertain than the Present
In my view, the market obsession with what the Fed Chair says day by day is overblown. Anybody remember a quote from Alan Greenspan? While modeling short-term decisions into long-term trends, we risk overlooking the impact from changing of guards at the Fed.
The current Fed Chair’s term will end in May 2026. Between now and then, there are four FOMC rate-setting meetings: December 9-10, 2025, January 27-28, March 17-18 and April 28-29 in 2026. What could possibly happen in four meetings:
• If the Fed is hawkish and refuses to cut rates, the policy Fed Funds rate could stay at the current 375-400 bp range.
• If the Fed turns dovish and cut 25bp every time, Fed Funds could be at 275-300 bp.
In recent meetings, the Fed no longer had consensus in its policy votes. Each decision is like a toss-up. If we only focus on the short term, trading results could be very volatile.
The next Fed Chair will be nominated by President Trump and confirmed by the Senate. We know for a fact that the President favors aggressive rate cuts to support the economy. Only someone who is 100% in agreement with the President could get nominated.
Latest news indicates that five candidates have made it to the final list to be considered for a Fed Chair nomination. They are Michelle Bowman, Christopher Waller, Kevin Warsh, Kevin Hassett and Rick Rieder.
If the Senate confirmation gets delayed, the President could pick a current Fed governor as Acting Chair. Whoever that may be, he or she will have to align with the President in terms of the direction of monetary policy. Gone with the independent central bank.
Even though we have no idea what happens next month, we could still form a good estimate of what the Fed will do in the next 2-1/2 years, starting in June 2026.
In my opinion, the expected policy rate will eventually go down to 1.0-1.5%, or even lower. This is not what the Fed currently says. Instead, I am forming an opinion based on a new Fed regime with a new Chair and multiple Fed governors supporting rate cuts.
With that in mind, we can now discuss trade strategies going beyond the next Fed meeting. We don’t have to wait a long time for everything to move in places. Once a new Fed Chair candidate is announced, the market will start pricing a different interest rate trajectory. Latest news suggests that the President may be meeting with three candidates after the Thanksgiving holiday.
Trading with 10 Year T-Notes Futures
As I mentioned earlier, US stocks have the risk of AI bubble bursting. We could wait a while to see how things play out. My trade idea today is a pure play on interest rates.
We know that Treasury prices are negatively correlated with interest rates. When rates go down, prices will likely go up. Our major chart illustrates this relationship.
CBOT 10-Year Treasury Notes Futures have a face value of $100,000 at maturity. The March 2026 contract (ZNH6) is currently quoting 112'240, equivalent to $112.75. Buying or selling one contract requires an initial margin of $1,875.
The 10Y futures are one of the most liquid futures contracts in the world. According to CME Group data, trade volume on November 17th was 1,779,688 contracts. Open Interest (OI) is 5,748,386 contracts at market close. OI is notional term is $574.8 billion.
In the next three FOMC meeting cycles, the contract prices could go either way depending on how the Fed votes. However, as soon as the President nominate his Fed Chair candidate, Treasury prices would get a big boost as the market will price in the new and lowered expected interest rates.
Hypothetically, if ZNH6 moves up 1% to $113.8775, the $1.1275 price gain would translate into $1,127.5 for a long futures position, given each dollar gain in price quotation equals $1,000 per contract. Using the initial margin of $1,875 as a cost base, the trade would produce a theoretical return of 60.1% (=1127.5/1875).
The long futures position will lose money if the Fed puts rate cuts on hold, and the new Fed Chair candidate is not announced in the next three months.
Happy Trading.
Disclaimers
*Trade ideas cited above are for illustration only, as an integral part of a case study to demonstrate the fundamental concepts in risk management under the market scenarios being discussed. They shall not be construed as investment recommendations or advice. Nor are they used to promote any specific products, or services.
CME Real-time Market Data help identify trading set-ups and express my market views. If you have futures in your trading portfolio, you can check out on CME Group data plans available that suit your trading needs www.tradingview.com

Bitcoin ($BTCUSD) Eyes Expansion as Liquidity Cycle Turn Risk-OnBitcoin ( BITSTAMP:BTCUSD ) surged above $106,000 this week, signaling renewed optimism as macro conditions hint at a liquidity-driven expansion phase. The crypto market is catching tailwinds from a wave of bullish catalysts, including the $2,000 U.S. stimulus rollout, the end of the government shutdown and a shift in Federal Reserve policy toward rate cuts after an extended period of tightening.
Quantitative tightening (QT) has officially ended, and Treasury liquidity injections are flooding markets with fresh capital, a backdrop that historically favors risk assets such as Bitcoin. Simultaneously, the long-awaited Clarity Act is expected to provide regulatory transparency for crypto assets, potentially unlocking institutional participation. With Altcoin ETFs reportedly in the pipeline following Bitcoin’s spot ETF success, the broader digital asset market is poised for a significant re-rating in valuation.
Technically, Bitcoin remains in a well-defined uptrend, respecting a long-term ascending trendline that dates back to mid-2024. Price has rebounded sharply from the $98K support area, aligning with the trendline that has held through multiple retests, and key weekly swing low. A clean break and close above the $110,000–$112,000 zone could trigger an accelerated move toward the $126,110 all-time high, which marks the next major supply level.
Conversely, a failure to maintain trendline support could invite a deeper pullback toward $95,000 or even the $75K region where stronger structural demand sits. However, momentum indicators such as RSI and volume suggest accumulation rather than exhaustion, implying that bulls remain in control as long as macro liquidity continues expanding. More so, the confluence of fundamentals indicate that BTC could be forming a new low that could surge to a new all-time high.
With fiscal easing, monetary support, and regulatory clarity converging, Bitcoin may be entering its next major expansion leg — positioning it once again as the bellwether for a renewed risk-on cycle.

GBPCAD daily 200SMA testPair is reaching the daily 200SMA (overlayed on this 4H chart). Looking for a bounce here into tomorrow morning, BoC announcing an expected rate cut, could send longs if forecast is met. Hourly RSI oversold, 4H RSI entering oversold territory. Simple play, tight SL.

Two-phase FOMC reaction on EURUSD explained: Where next?EURUSD experienced a classic "dovish-then-hawkish" whipsaw following the Fed's 25bp cut. The Initial dovish reaction saw the fibre surge above 1.19 to multi-year highs as the dot plot showed 50bp additional cuts vs expected 25bp in 2025. However, Powell's hawkish presser reversed gains within the hour, describing the cut as "risk management" rather than an aggressive easing cycle start.
EURSD is finding support at 1.1778 (previous high), with the price having taken out the 100% Fibonacci extension from August lows. Critical support sits at 1.1740, with a break below invalidating the bullish bias.
Bullish Scenario
Targets : 1.1830, 1.1866 (critical level), then 1.2000-1.2032
Triggers : Hold above 1.1778, break above 1.1866
Rationale : ECB-Fed divergence theme intact with ECB holding, while Fed cuts
Bearish Scenario (Potential Dead Cat Bounce)
Targets : 1.1750, 1.1730
Entry : Short at 61.8% Fibonacci retracement (~1.1832)
Stop : Above 1.1878
R:R Ratio : 3.38
Where next?
ECB pause vs Fed easing supports underlying bullish EUR/USD theme despite near-term volatility. But the next FOMC meetings are more critical as Powell emphasised a "meeting-by-meeting" approach. Current pullback is likely a retracement before a potential continuation higher, but watch for rejection at the weekly trendline resistance shy of 1.20.
This content is not directed to residents of the EU or UK. Any opinions, news, research, analyses, prices or other information contained on this website is provided as general market commentary and does not constitute investment advice. ThinkMarkets will not accept liability for any loss or damage including, without limitation, to any loss of profit which may arise directly or indirectly from use of or reliance on such information.

Dow at record highs, outperfoms peers! But are risks brewing?The Dow Jones DJIA surged to new record highs, driven by defensive sector strength and expectations of Fed rate cuts. Dow outperformed due to its heavier weighting in defensive sectors (industrials, financials, consumer staples), which are favoured during economic uncertainty and falling yields. Technical analysis suggests further upside potential, as investors seek stability and dividends in Dow components amid lingering recession risks. However, key support levels must hold to sustain the rally.
The Dow has completed a V-shaped recovery, breaking above previous double-top highs from 2024/2025 (45,150), now acting as support. An open triangle pattern was identified, with the current move likely the fifth wave to the upside. The index trades above all major moving averages, confirming bullish momentum, but RSI shows hidden bullish divergence, supporting the case for continued upside only if support holds after a pullback.
Dow has critical support at 45k, must hold to maintain bullish momentum. A drop below 45,581 could trigger a correction. Short-term upside shows 47k, with a major Fibonacci cluster and technical inflexion in focus. Intermediate levels sit at 46300/45900/45640, with important long-term Targets at 45k, 49500, 50k, 53k.
Risks & Potential Scenarios
Divergence: Despite strong momentum, technical divergence suggests a possible corrective move if the Dow falls below 45581.
Bullish : Holding above 45581 and 45k supports further upside toward 47k and beyond.
Bearish : A break below 45581 could trigger a deeper pullback before any renewed rally.
Market Sentiment :
The bond market’s caution contrasts with stock market optimism, so stay vigilant.
This content is not directed to residents of the EU or UK. Any opinions, news, research, analyses, prices or other information contained on this website is provided as general market commentary and does not constitute investment advice. ThinkMarkets will not accept liability for any loss or damage including, without limitation, to any loss of profit which may arise directly or indirectly from use of or reliance on such information.

THE 4-YEAR CYCLE WILL NEVER ENDTHE 4-YEAR CYCLE WILL NEVER END.
As I’ve said many times before, I now think this cycle will push into late January / February 2026, similar to 2017.
As I’ve written extensively about, the macro setup is nearly identical to 2017.
Read that here.
The funny thing is, when we do push into early Q1 ‘26, all your favorite “influencers” will proclaim “this time is different”, because most weren’t here during the 2017 cycle or before.
There is ZERO EVIDENCE that the 4-year cycle is dead.
Since the GFC in 2008, the Fed was redesigned for these boom and bust cycles to counter inflation and unemployment.
At this point, unless the US completely dismantles the Fed, the 4-year cycle will live on in perpetuity. We see the effect of this on TradFi as well.
See the comparison here.
The Fed is set to cut interest rates for the first time in a year at tomorrow’s FOMC. This is a liquidity positive catalyst for markets.
The next ISM PMI print on October 1st should be ~50, which will be the start of the business cycle.
That would give us ~5 months of a surging business cycle, which will pump risk assets to VALHALLA.

Gold hits record highs ahead of FOMC! Tech SetupGold reached fresh all-time highs near $3690 ahead of Wednesday's FOMC meeting. Its rally reflects a perfect storm of Fed dovishness and geopolitical tensions, but technical divergences suggest positioning carefully ahead of Powell's decision. The 100% Fib extension and double divergence setup makes any hawkish surprise particularly dangerous for leveraged longs.
CATALYSTS DRIVING THE RALLY:
Fed rate cut fully priced in (25bps expected, some 50bps speculation)
US-China tensions escalate (Nvidia antitrust accusations)
Stephen Miron confirmed to Fed Board of Governors (dovish member)
Dollar weakness supporting precious metals
Surprising correlation: Nasdaq & S&P 500 also hit records alongside gold
TECHNICAL LEVELS:
Resistance :
$3,700 - Key psychological level
$3,750 - Next major target
$3,800 - Extended upside if dovish
Support :
$3,660 - First support for entries
$3,610 - Major support level
Previous swing lows - Stop loss reference
WARNINGS:
Double divergence on 4H & 1H timeframes
100% Fibonacci extension reached
RSI overbought conditions
Momentum diverging from price action
FOMC SCENARIOS:
Bullish Case : Dovish 25bps + accommodative guidance → Target $3,750-$3,800
Risk Case : Hawkish surprise or even neutral tone → Profit-taking toward $3,600-$3,500
KEY RISKS:
Powell emphasising inflation persistence
Resistance to aggressive cutting cycle
Hawkish dot plot projections
Any break below $3,660 signals deeper correction potential
This content is not directed to residents of the EU or UK. Any opinions, news, research, analyses, prices or other information contained on this website is provided as general market commentary and does not constitute investment advice. ThinkMarkets will not accept liability for any loss or damage including, without limitation, to any loss of profit which may arise directly or indirectly from use of or reliance on such information.

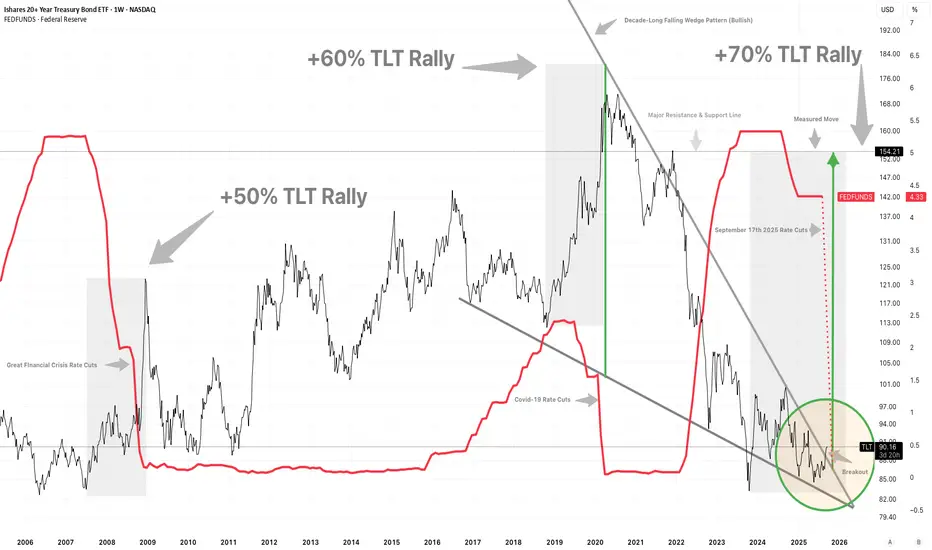
TLT TimeRate cuts start this Wednesday, September17th, 2025.
Polymarket odds are now strongly in favor of 3 rate cuts in 2025. CME Fedwatch probability is now at 70% for 3 cuts by December 10th.
Economic data, especially employment, has strongly confirmed the start of a full rate-cutting cycle beginning in 1.5 days.
Historically this set of circumstance has coincided with large or even historic bond rallies.
Will this time be different?
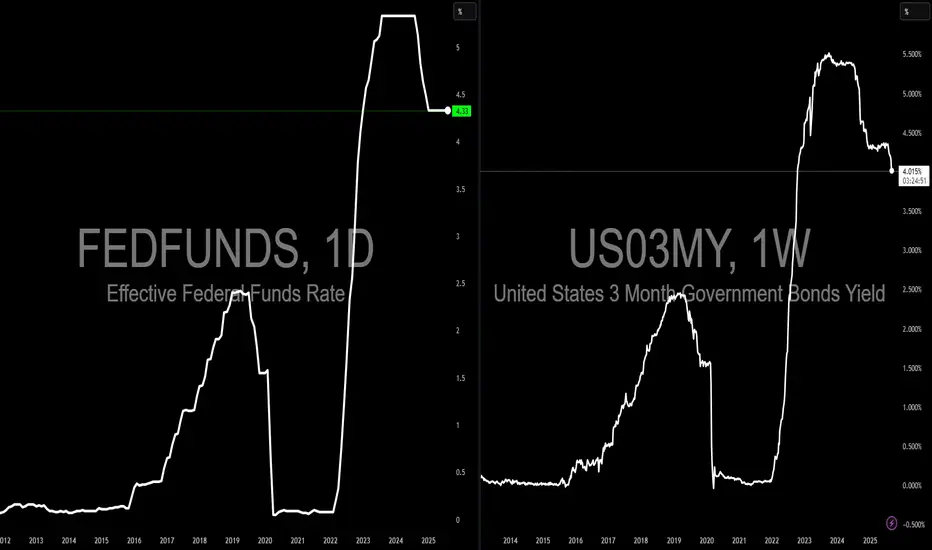
Cut the Noise: The Fed Is on Track for a September Rate CutI’m seeing a lot of wild takes floating around right now, things like a surprise rate hike or claims that QE is driving us into a crash. That’s pure noise, and complete nonsense. The facts are straightforward: QT is still ongoing, the Fed’s balance sheet has been unwound (anyone can fact-check that), and a rate cut on 9/17 is almost certain, most likely 25 bps, which would mark the start of a new easing cycle. The dot plots already show the range, and if you look at the chart comparing fed funds to the 3-month yield, it’s clear the Fed is actually late to cutting. JP had also hinted that the easing would have already begun had the Tariffs (taxes) not kicked off. I will not torture you readers with more tariff information but let's also be clear, tariffs are simply a tax. They are transitory by nature, now uncertain , and already priced in. “Liberation day” is behind us, and those expecting some massive equity washout because of tariffs are months late. Even Powell himself hinted that easing would have begun earlier if not for the tariff overhang. I’ll spare you a deep dive into tariff mechanics, but the bottom line is they are temporary tax distortions, not permanent anchors on growth. Likewise they are not permanent catalysts of inflation. We likewise know tariffs were impacting select products like apparel, textiles, automobile parts and some technology significantly more than other sectors & products.
On top of that, we’ve had bearish ISM manufacturing data , the transportation sector showing the weakest $/mile in memory (related to the cost variables), and consecutive soft jobs numbers. Those arguing that inflation is resurging are ignoring the Fed’s dual mandate: employment and inflation. Right now, employment stress is outweighing inflation risks, and Main Street is hurting. The market, being forward-looking , knows this.
In a K-shaped recession, debt-dependent sectors are under real strain, while high-margin, scalable sectors like technology continue to grow and deliver true earnings. That’s why the bull market in equities, crypto, and gold is still intact and mainstreet remains suffering.
We will get out of the recession and back into growth mode, and other sectors will see earnings improvement. All the while, crypto is an emerging market and will most likely rise a great deal, and Gold will still continue to pump. Briefly I will mention that I recently saw a bloomberg chart exhibiting central banks now holding more gold than US Treasuries - and we must realize this is yet another sign that most likely Treasury yield will be dropping. This is coupled with a weak dollar which was no surprise as the dollar was so weak in the initial trump administration as well. The logic someone could argue is that weaker dollars leads to more exports, less imports.
Gold Watching 3,360 Support as Powell Dovish Tone Weighs on USDHey Traders, in tomorrow's trading session we are monitoring Gold for a buying opportunity around 3,360 zone, Gold (XAUUSD) recently broke above the 3,360 resistance, turning it into an important support level to watch on any pullback. A retracement into this zone could help determine whether the breakout has strength to extend toward higher levels.
On the fundamental side, Fed Chair Powell struck a dovish tone, signaling support for a potential September rate cut, citing lower inflation pressures and risks in the labor market. This backdrop keeps USD under pressure and maintains a bullish bias for Gold in the near term.
Monitoring price action around 3,360 to assess whether buyers defend this level or if deeper consolidation unfolds.
Trade safe, Joe.

Good setup to short USDJPYRecently the risk emotions caused by the White House and inflation worries it produced drives long term US Treasury yields rising, with 20-yr yield cross up to 5% once again.
Yet, you can see that the yield difference are still at a dropping trend. Moreover, the Fed is expected to cut 125 bps in the next 15 months according to the swap market.
Combined with the techincal levels, it's a good price to get into a short position of USDJPY. I don't know about you guys. I'm in

UCAD Bears Ready to Break 2 Month Long Falling Support??OANDA:USDCAD has been supported by a Falling Support Trend line since August 14th and here soon Price could potentially give us a Bearish Break to that Trend line!
Once a Breakout is validated, we could look for a Retest Set-Up for some Short Opportunities to take Price down to the Support Zone created by the August and September 2024 Lows.
An interesting fact to point out is if you observe the reaction of Price when it tests the Falling Support, we can see Price arc and the following reactions arc smaller, suggesting Bulls are losing strength on the push off of the Falling Support!
Price Action is being heavily driven by Fundamentals in the markets this week:
-USD-
ADP Non-Farm Employment - Previous 60K / Forecast 111K / Actual 37K
ISM Services PMI - Previous 51.6 / Forecast 52 / Actual 49.9
ISM Manufacturing PMI - Previous 48.7 / Forecast 49.3 / Actual 48.5
ISM Manufacturing Prices - Previous 69.8 / Forecast 70.2 / Actual 48.5
Unemployment Claims - Previous 239K / Forecast 236K / Actual 247K
*Average Hourly Earnings, Non-Farm Employment and Unemployment Rate are to be released tomorrow
-CAD-
BOC held Interest Rates @ 2.75%
Ivey PMI - Previous 47.9 / Forecast 48.3 / Actual 48.9
*Employment Change and Unemployment are to be released tomorrow
With BOC holding Interest Rates and the Federal Reserve possibly looking to cut rates because of a "softening labor market", this could fuel CAD to overcome the pair and put Bears in control to pull Prices lower!
www.tradingview.com

The Fed Cuts Balance Sheet Runoff by 80% - BULLISH!RISK-ON 🚨
I’m seeing so many people incorrectly analyzing the September 2019 emergency repo OMOs, which were short-term liquidity injections from the Fed, and then comparing it to the price of BTC going down, before QE officially started in March 2020 because of the pandemic.
Here’s what really happened.
September 15, 2019 was a tax deadline, pulling ~$100B out of markets as large corporations paid the IRS and funds flew into the TGA.
Meanwhile, the Treasury issued new T-Bills to rebuild cash reserves following the post-debt ceiling resolution in August, draining another $50-100B as big banks and institutions absorbed the securities.
During this time, the Fed continued reducing its balance sheet (QT) down to $3.76T, but the balance sheet did not leave enough slack for unexpected cash drains to the system, such as corporate taxes and Treasury issuance.
Unfortunately, the Fed was flying blind and did not have a hard number estimate for “ample reserves” in the banking system.
These reserves were largely hoarded by a few of the larger banking institutions due to Liquidity Coverage Ratio (LCR) rules and a higher IOER at 2.1% vs the ON RRP rate of 1.7% - a 40 bp spread.
This caused a liquidity crisis in the US repo market because bank reserves held at the Fed ($1.36T) were too low and repo lending dried up. Banks weren’t able to access each other’s reserves to fund daily operations.
SOUND FAMILIAR !?
The US just resolved its CR to avoid a government shutdown, and they will be refilling the TGA by issuing new T-Bills. The reverse repo facility is also nearly drained.
Today, we heard the Fed will be reducing its securities runoff from $25B - SEED_TVCODER77_ETHBTCDATA:5B on April 1st, an 80% adjustment.
One of the main drivers is they wanted to get ahead of another 2019-style repo crisis (although they won’t say this), rather than being reactive and having to perform emergency OMOs once again.
Now to go back to my original point with people saying the Fed reducing its balance sheet runoff is a big nothingburger based on BTC price action in 2019.
BTC dumped because of the repo crisis, NOT because markets needed QE.
By early 2020, the liquidity crisis was resolved, and BTC pumped ~45% before the pandemic hit in March and nuked the chart.
Proof is in the pudding - just look at the 2017 bull market.
QT started in October 2017, and the market ripped until early 2018.
The Fed reducing its balance sheet runoff by 80% is definitely a signal of risk-on for educated market participants, as it leaves more reserves in the financial system, which gives banks more liquidity to loan the market.
i.e. M2 go up.
But keep listening to your favorite large accounts who are all of a sudden macro gurus, what do I know 🤓

Rising from the Ashes: EURO's Path to RecoveryGood day traders,
Trust we all profited from the FOMC report of yesterday.
Please take a moment to go through my outlook and expectation on Euro in the coming weeks into the new year.
Overview
EUR/USD appears to be rebounding after a sharp decline triggered by yesterday's FOMC report, where the FED delivered a hawkish 25bps cut, which drove higher market-driven borrowing costs, a stronger dollar and a sharp drop in stocks. From the start of the week EURUSD had previously been consolidating, during which weak buyers (traders) were caught off guard by a false breakout to the upside, reaching a weekly high of 1.05342 on Tuesday.
Idea
The subsequent sell-off drove the pair to a four-week low of 1.03439, just above the November 22nd low of 1.03324. This drop aligns with a key Fibonacci reversal pattern under Elliott Wave theory, suggesting the potential for a significant rally. If this pattern holds, EUR/USD could gain approximately 400 pips (1.08150) in the coming weeks, with the recovery likely extending into the new year.
Conclusion
The recent low is expected to act as a firm support level, and a breach of the November low appears unlikely. This anticipated rally could mark the beginning of a period of recovery and optimism for the euro.
Cheers! Merry Christmas and Happy New Year in advance.

USD/JPY price action: breakout rally after hawkish FedThe USD/JPY pair has surged over 2% to reach 157.51, marking the yen's weakest level in four months. This significant rally follows recent interest rate decisions by the Federal Reserve and the Bank of Japan. Despite the Fed's 25bps rate cut, the US dollar has gained strength due to the market's anticipation of only two rate cuts in 2025, contrasting with earlier expectations of four. This decision maintains the interest rate differential between the US and Japan, benefiting carry trade strategies. Meanwhile, the BoJ has kept its short-term rate steady at 0.25%, its highest since 2008, with potential rate hikes forecasted if economic conditions align. The US's optimistic economic projections, with rising GDP, inflation, and job growth, further bolster the dollar's appeal. As global economic uncertainties and political changes unfold, traders should monitor central bank signals to navigate the USD/JPY's trajectory and carry trade opportunities.

$USDT Dominance Critical Level₿itcoin should rip in the next couple days with when the FOMC announces this next round of Rate Cuts.
CRYPTOCAP:USDT Dominance is sitting at a critical inflection point however.
The trendline from 2017 puts a local top in February.
Something to watch 👀

$BTC Has Another Bullish Weekly Close to Confirm New TrendCRYPTOCAP:BTC confirmed new bull market structure closing outside of the pennant 🐂
Should rip after Trump is announced POTUS and new round of rate cuts this week 🚀

BTC breaks above 65,000On the back of a larger than expected FED rate cut of .50 risk assets breathe a sigh of relief long held in since the rate cut rumors of Q2 2024. The gains were cemented by a cooler than expected PCE of .1% as opposed to the expected .2% this is the FED’s preferred measure of inflation putting some level of ease to risk asset investor that the FED may turn face on the easing of monetary policies. If this continues a fear people have a of 70’s style inflation issue will be put to rest. China also joined the party will an AGGRESSIVE stimulus packages direct to the people and promises to do more if need be. They also encouraged stock buy backs, if you know anything about the investment market in China the options for quality investment are very limited as the Real Estate market was the main choice but since the Evergrande collapse Chinese investor have had little to no choice. This makes a scenario for crypto investment as an alternative to stocks but the CCP obviously like control so we will if that plays out.
How this affect Crypto bros the short of it is when global liquidity goes up so do assets especially when people get cash in hand example 2020-2021 when everyone and their dog was investing. Now while stimulus direct to consumers is like throwing gas on the fire the FED rate cuts are like throwing a log on embers. The rate cuts take about a year to affect the general economy but the immediate effect is bank to bank loan rate i.e it’s cheaper to take on debt. Now with the rise of NASDAQ:MSTR strategy with other companies this will make it cheaper for companies to take on debt so companies like Metaplanet and other yet to disclose will find the “BTC Yield” more significant to offset loan cost. And lastly all risk assets benefit from low rate environments.
In sum NFA but I would buy CRYPTOCAP:BTC as always and load up on alts while BTC out perform my mix ideally 75% BTC 15% alts and 10% cash for dippy dips

M2K: SmallCap May Get a Big Lift with Rate Cuts UnderwayCME: Micro E-Mini Russell 2000 Futures ( GETTEX:M2K )
Global financial market orbits around Federal Reserve’s interest rate decisions. Hiking interest rates means monetary tightening while cutting them signals easing.
In the past three years, we have witnessed a full cycle of Fed hikes and now its reversal.
• In March 2022, as inflation rose rapidly, the Fed started a series of rate increases, pushing the Fed Funds rate up by 525 basis points from 0-0.25% to 5.25-5.50%.
• In September 2023, after 11 consecutive rate hikes, the Fed put the brake on. It kept the Fed Funds unchanged for a full year in eight FOMC meetings.
• Last Wednesday, the Fed finally entered the long-awaited rate cut cycle. It slashed interest rates by a supersized half point, or 50 basis points, in its first cut since 2020.
According to the Bureau of Labor Statistics (BLS), the latest reading of headline CPI is 2.5% in August, down 6.6% from its peak in July 2022. We may conclude that the Fed has largely completed its mission of combating inflation.
The BLS data shows that the U.S. unemployment rate has risen to 4.2% in August 2024 from 3.6% two years ago in August 2022. Fed’s easing signals its pivot to the second mandate, to support full employment. Lowering interest rates could reduce borrowing costs, and in return help business expansion and employment.
Russell 2000: SmallCap may get the biggest Boost
The discounted cash flow (DCF) model estimates the present value of an investment based on its expected future cash flows. A lower cost of capital (CoC) shall cause the price of the investment to go up, other things equal.
Small companies would gain the most compared to larger corporations. In the preceding rate hike cycle, they were hit hard as credit standards got tightened and credit spreads expanded. We will now see the reversal.
Russell 2000 is the benchmark stock market index for US small companies. CME Micro E-mini Russell 2000 futures ( GETTEX:M2K ) were settled at 2,252.6 on Friday, up 10.05% year-to-date.
For a comparison, the S&P 500 gained 19.50% YTD as of Friday, while the Nasdaq 100 was up 17.59%. In my opinion, the major stock indexes rose on the back of the AI-driven technological breakthroughs, where Big Tech dominated but few Small Cap companies could benefit. In this new cycle, lowered borrowing costs and the abundance of credit could help small businesses improve their balance sheets.
The Fed is expected to continue cutting rates in the next two years. Corporate bond yields could likely return to the 2-3% range. The credit spreads, including Baa-Bbb, Baa-Bb, and Baa-Ccc, would likely get smaller. This could bring further boost to the Russell index.
Could we quantify the impact of rate cuts? Let’s illustrate this with a $1 million payment, to be received in five years.
• Applying the BBB corporate bond yield of 4.88% as the CoC, present value of $1 million will be $788,019.
• If the CoC moves down by 250 bps to 2.38%, the PV will be increased to $889,046.
• This shows that a 2.5% reduction in CoC could boost the PV by 12.8%.
The same concept would work on the Russell index. CoC could drop either due to interest rate decrease or because of the narrowing of credit spread, which favors smaller companies. The result would be an increase in the market value of Russell component companies.
For someone with a bullish view of the Russell 2000, he could establish a long position in CME Micro E-mini Russell 2000 futures. The contract has a notional value at $5 times the index. At Friday closing price of 2,252.6, each December contract (M2KZ4) is worth $11,263. CME Group requires an initial margin of $760 for each M2K contract, long or short.
The Fed will next convene on November 5th-6th and meet one last time in 2024 on December 17th-18th. In my opinion, if the Fed continues lowering rates in these two meetings, Russell 2000 could likely move up further.
Hypothetically, if the Russell is 5% higher by December, the 113-point increase would translate into $563 (=2252.6*0.05*$5) gain per contract for the long holder.
The risk of long futures is the index going down. If inflation spikes unexpectedly, the Fed could possibly pause its rate cuts, casting doubt on the future rate trajectory. For more experienced traders, put options on the E-Mini Russell 2000 futures could be deployed to hedge the downside risk.
Happy Trading.
Disclaimers
*Trade ideas cited above are for illustration only, as an integral part of a case study to demonstrate the fundamental concepts in risk management under the market scenarios being discussed. They shall not be construed as investment recommendations or advice. Nor are they used to promote any specific products, or services.
CME Real-time Market Data help identify trading set-ups and express my market views. If you have futures in your trading portfolio, you can check out on CME Group data plans available that suit your trading needs www.tradingview.com

Clean Break To The UpsideFalling Wedge Pattern
Success rate : Falling wedge statistics - In 82% of cases, the exit is bullish. - In 55% of cases, a falling wedge is a reversal pattern. - In 63% of cases, the pattern's price objective is achieved when the resistance line is broken.
Why should you buy into bonds after a rate cut?
HERE ARE 5 REASONS...
When a central bank cuts interest rates, bonds can become more attractive for several reasons:
1: Bond Prices Tend to Rise: When interest rates fall, the yield on new bonds is lower, making existing bonds with higher yields more attractive. As a result, the price of existing bonds rises, which benefits those who already own them or buy in anticipation of further price increases.
2: Fixed Returns Become More Attractive: After a rate cut, returns from savings accounts and other short-term investments decline. Bonds, offering a fixed rate of return, become more appealing, especially for income-focused investors looking for stability in a low-rate environment.
3: Lower Future Borrowing Costs: A rate cut often signals that borrowing costs will stay low, benefiting businesses and governments that issue bonds. This may lead to more bond issuances, and investors can capitalize on buying bonds before yields drop further.
4: Hedge Against Economic Uncertainty: Rate cuts often occur during economic slowdowns or periods of uncertainty. Bonds, particularly government or high-quality corporate bonds, are seen as safer investments compared to stocks, making them attractive for risk-averse investors.
5: Capital Gains Potential: As bond prices increase with falling rates, there is an opportunity for capital gains. Investors can potentially sell bonds at a higher price than they were purchased for, profiting from the price appreciation.
In short, buying bonds after a rate cut can offer both income stability and the potential for price gains, especially in a low-interest-rate environment.

Fed's Bold Rate Cut Raises Stakes for BoE and BoJ Both the Bank of England (BoE) and Bank of Japan (BoJ) are not expected to cut interest rates at their respective meetings today and tomorrow.
The US Federal Reserve just chose to cut its own rate by 50 basis points. So, how might the BoE and BoJ decisions be affected?
Bank of America projects the BoE will leave its Bank Rate at 5.0%, with the pound potentially gaining. However, gains could be capped if policymakers lean dovish. Additionally, a currency strategy note from HSBC says that the sharp appreciation of the British pound against the U.S. dollar may be nearing its limits.
Masamichi Adachi, chief Japan economist at UBS Securities, cautioned that if the BoJ raises rates Friday, just days after the Fed's rate cut, “markets would likely face increased turbulence.”

Crypto $TOTAL Market Cap Sell The News Event IncomingSOUR GRAPES
Markets barely budge after the Fed cuts a massive 50 bps.
This is due to uncertainty with participants feeling there is something “broken” in the system.
However, long-term this is BULLISH.
The Crypto CRYPTOCAP:TOTAL Market Cap could see another small pump leading into the weekend to test its downtrend line, but I expect next week for the markets to “sell the news” pretty hard.
Should retest the lower order block ~$1.77T next.
