XRP is Bullish Until Proven OtherwiseHolding the 2021 highs has been the saving grace for XRP. In my opinion this negates the negative price action we have seen as of late, especially with taking the positive macro environment.
Rectangle

Selena | BTC/USD – Trend Channel + Strong Demand ReactionBITSTAMP:BTCUSD
Bitcoin is trading inside a rising parallel channel, with price recently reacting cleanly from the strong demand zone at 90,200–90,700, aligning with channel support. Liquidity was taken below the lows, signalling possible continuation to the upside.
🔼 Bullish Scenario
If BTC holds above 90,200, we may see upside continuation:
🎯 Target 1 → 94,200 – BSL zone
🎯 Target 2 → 96,800 – 97,900 top resistance zone
🎯 Target 3 (Breakout case) → 98,500+
A sweep of intra-day liquidity followed by bullish BOS can provide confirmation.
🔽 Bearish Risk / Invalidation
Break & close below 89,900 could open deeper flow into liquidity below:
⚠️ Downside levels → 88,000 → 86,500 → 81,000 support base
⚠️ This chart is for educational purposes only — not financial advice.

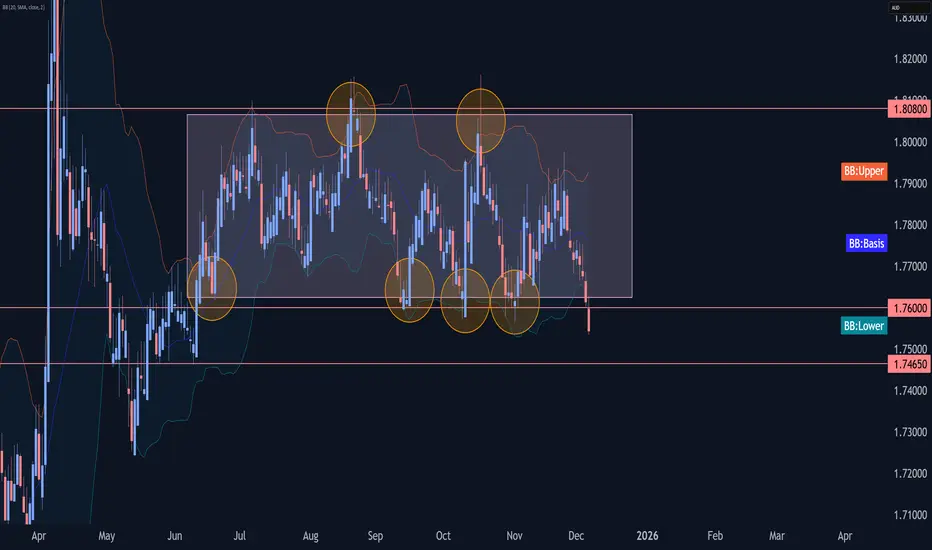
EURAUD Wave Analysis – 5 December 2025
- EURAUD broke the support level 1.7600
- Likely to fall to support level 1.7465
EURAUD currency pair recently broke the support level 1.7600 (which is the lower boundary of the sideways price range inside which the pair has been trading from June).
The breakout of the support level 1.7600 accelerated the active short-term correction ii from the end of November.
Given the strongly bullish Australian dollar sentiment seen today, EURAUD currency pair can be expected to fall to the next support level 1.7465 (former monthly low from June).
SILVER (XAGUSD): Consolidation & Trading Plan
Silver keep coiling within a narrow range on a daily.
Depending on the side of its breakout, I expect 2
potential scenarios.
If the market breaks and closes above 59.0 - the resistance
of the range, expect a bullish continuation to 60.0 level.
If the market breaks and closes below 56.2 - the support
of the range, expect a down movement to 54.5
Alternatively, keep trading the market within the range,
buying from the support and selling from the resistance.
❤️Please, support my work with like, thank you!❤️
I am part of Trade Nation's Influencer program and receive a monthly fee for using their TradingView charts in my analysis.

From Analysis to Execution — A Full Live Trade Breakdown.Yesterday I shared a full analysis and the exact plan for today’s trade.
Today, I executed that plan — live, with full transparency.
In this video:
- Live price action explanation (no hindsight, real-time logic)
- Entry exactly as planned in yesterday’s analysis
- Position tool ON — showing the actual live trade I am in
- Real-time trade management (what I’m thinking, why I’m holding, when I cut)
- Psychology breakdown — how emotions behave inside a running trade
- Structure, candles, liquidity, decision-making explained as they happen
No random drawings.
No after the fact stories.
This is real time execution and honest trade management exactly as the market unfolds.
If I book profits you’ll see it.
If I don’t you’ll see that too.
This video is all about transparency, discipline, and pure price action work.
Watch this trade unfold from plan → entry → management → outcome.
Let me know your thoughts, and if you want more live breakdowns like this.

Nifty Price Action explained for 5th December, 2025.On a 15 minute time frame, nifty has become range bound either side breakout of the range may lead to a good opportunity. There is a shift in structure. No new lower low is formed. Nifty has formed a higher low after making a higher high. On a higher time frame. We have an up sloping trend line which the price has respected nifty is in a crucial price range where a good move is being loaded.
If you like the video, you can let me know. I will post more videos like this.

Selena | XAUUSD – 4H | Bullish Continuation Setup 4400$ WaitingFOREXCOM:XAUUSD
Gold continues to build bullish structure after forming accumulation in the previous range zone. The market broke out, retested demand, and maintained higher-lows inside the ascending channel. Current pullback into the Entry Zone (4122–4140) aligns with channel support + demand, suggesting potential continuation toward the upper boundary and major resistance around 4380–4410.
Key Scenarios
✅ Bullish Case 🚀
Hold above demand zone + channel support:
🎯 Target 1: 4320
🎯 Target 2: 4380
🎯 Target 3: 4410 (final top channel line)
Trigger: bullish rejection or bullish engulfing from 4122–4140.
❌ Bearish Case 📉 (Invalidation)
Break and 4H close below 4052 (Invalid zone):
🎯 Downside Target: 3990 → 3920 strong support
Current Levels to Watch
Resistance 🔴: 4320 / 4380 / 4410
Support 🟢: 4140 / 4122 (Entry Zone)
Invalidation: 4052
⚠️ Disclaimer: This analysis is for educational purposes only. Not financial advice.

KOTAK BANKKotak Mahindra Bank Ltd., incorporated in the year 1985, is a banking company (having a market cap of Rs 4,26,771.84 Crore).
Kotak Mahindra Bank Ltd. key Products/Revenue Segments include Interest & Discount on Advances & Bills, Income From Investment, Interest On Balances with RBI and Other Inter-Bank Funds and Interest for the year ending 31-Mar-2025.
The Bank has reported Standalone Non Performing Assets (Gross NPAs) at .00 % of total assets and Standalone Net Non Performing Assets (Net NPAs) at .00% of total assets for the quarter ending 30-09-2025.
For the quarter ended 30-09-2025, the company has reported a Consolidated Total Income of Rs 24,901.39 Crore, down 6.75 % from last quarter Total Income of Rs 26,703.92 Crore and down 7.36 % from last year same quarter Total Income of Rs 26,880.02 Crore. The bank has reported net profit after tax of Rs 4,468.27 Crore in latest quarter.
The bank’s top management includes Mr.C S Rajan, Mr.Ashok Vaswani, Ms.Shanti Ekambaram, Mr.Jaideep Hansraj, Mr.Amit Desai, Mr.Uday Kotak, Dr.Ashok Gulati, Ms.Ashu Suyash, Mr.Eli Leenaars, Mr.Ketaki Bhagwati, Mr.Uday Shankar, Mr.Devang Gheewalla, Mr.Avan Doomasia. It has Deloitte Haskins & Sells as its auditoRs As on 30-09-2025, the company has a total of 198.86 Crore shares outstanding.

GBPUSD 4H — Short Setup Near Premium ZoneFX:GBPUSD
Price is approaching a high-value supply zone where previous rejections occurred. Structure remains bearish with lower highs and lower lows, suggesting continuation unless price breaks above the invalidation level.
A rejection from the 1.3300–1.3350 zone gives a high-probability short opportunity toward the next major liquidity level.
Key Scenarios
❌ Bearish Case (Primary Bias) 📉
Entry Zone: 1.3300 – 1.3350
🎯 Target: 1.3020 – 1.2950
🛑 Stop Loss: Above 1.3461 (Invalidation Zone)
Confirmation Improvement:
• Rejection wicks
• Bearish engulfing
• Break and retest of minor support
Important Levels
Type Level
Entry Zone 📍 1.3300–1.3350
Target 🎯 1.3020 → 1.2950
Stoploss ❌ 1.3461
Invalid Zone ⚠️ Above 1.3461
⚠️ This analysis is for educational purposes only — not financial advice.

Side way Breaks to new all time high Hello Traders,
i can see big volume compared to the monthly trading at the ending of side way markets which will lead for a continuation for the bullish trend targets is already mentioned and it depends what you are investing for short intermediate long if we break the discount area we well go for big correction advice to sell with the retest however if we breaks the discount area huge profits coming. if you like the idea kindly show your support for more ideas to come good day.

NEW BREAKOUT - NZDUSDHello traders,
the NZDUSD price has formed a rectangle pattern.
Currently, the resistance level is broken!
So, I expect a bullish move from this breakout.
🎯 TARGET: 0.57770

Unlocking Potential: Power Finance Corporation Analysis! 💼📈Traders, let's delve into Power Finance Corporation today ! 🌟 In the daily timeframe, we're witnessing a range-bound movement, with the price testing previous swing highs. 🔄 Anticipate a breakout above this level(red box), potentially targeting Rs. 450 and beyond. But before that it may come around at Rs.400 to go up further. PFC appears poised for bullish action! 🚀 Options traders, explore 400 CE or below 400 CE options with ample liquidity. Let's capitalize on this opportunity! 💼📊
Thank you. See you again in the next post!
Best regards,
Alpha Trading Station

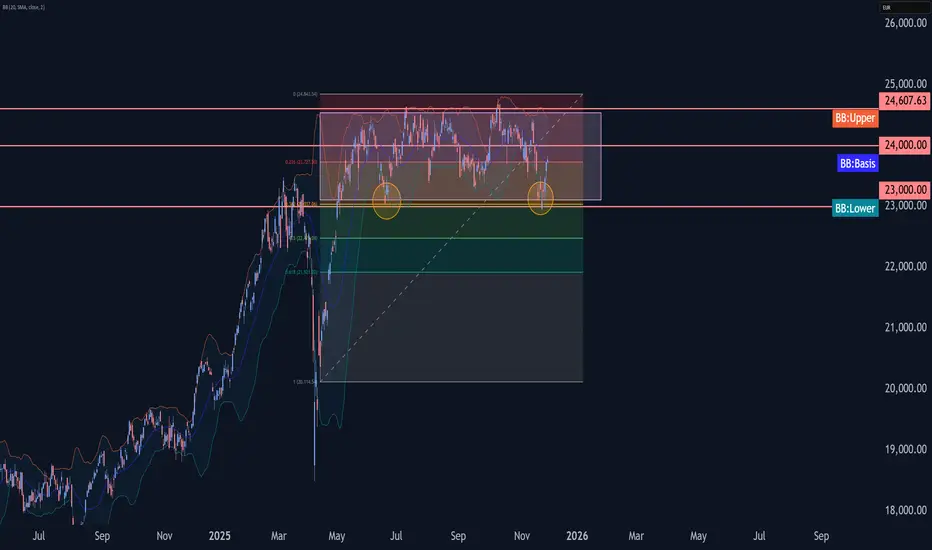
DAX Wave Analysis – 27 November 2025- DAX reversed from support area
- Likely to rise to resistance level 24000.00
DAX index recently reversed from support area between the support level 23000.00 (lower border of the sideways price range inside which the price has been moving from June) and the lower daily Bollinger Band.
The upward reversal from this support area stopped the previous minor impulse wave C of the intermediate ABC correction (4) from July.
Given the clear daily uptrend, DAX index can be expected to rise to the next resistance level 24000.00.
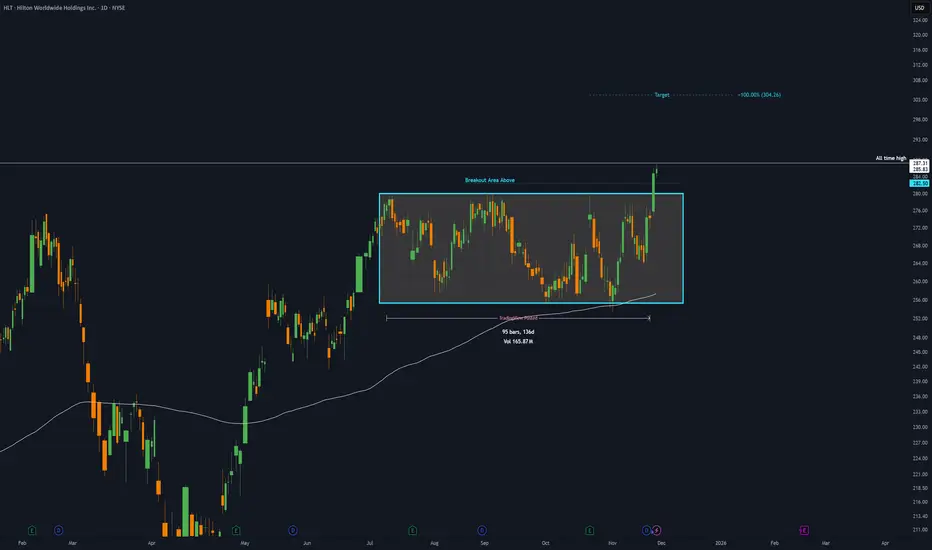
HLT - 4 months RECTANGLE══════════════════════════════
Since 2014, my markets approach is to spot
trading opportunities based solely on the
development of
CLASSICAL CHART PATTERNS
🤝Let’s learn and grow together 🤝
══════════════════════════════
Hello Traders ✌
After a careful consideration I came to the conclusion that:
- it is crucial to be quick in alerting you with all the opportunities I spot and often I don't post a good pattern because I don't have the opportunity to write down a proper didactical comment;
- since my parameters to identify a Classical Pattern and its scenario are very well defined, many of my comments were and would be redundant;
- the information that I think is important is very simple and can easily be understood just by looking at charts;
For these reasons and hoping to give you a better help, I decided to write comments only when something very specific or interesting shows up, otherwise all the information is shown on the chart.
Thank you all for your support
🔎🔎🔎 ALWAYS REMEMBER
"A pattern IS NOT a Pattern until the breakout is completed. Before that moment it is just a bunch of colorful candlesticks on a chart of your watchlist"
═════════════════════════════
⚠ DISCLAIMER ⚠
The content is The Art Of Charting's personal opinion and it is posted purely for educational purpose and therefore it must not be taken as a direct or indirect investing recommendations or advices. Any action taken upon these information is at your own risk.
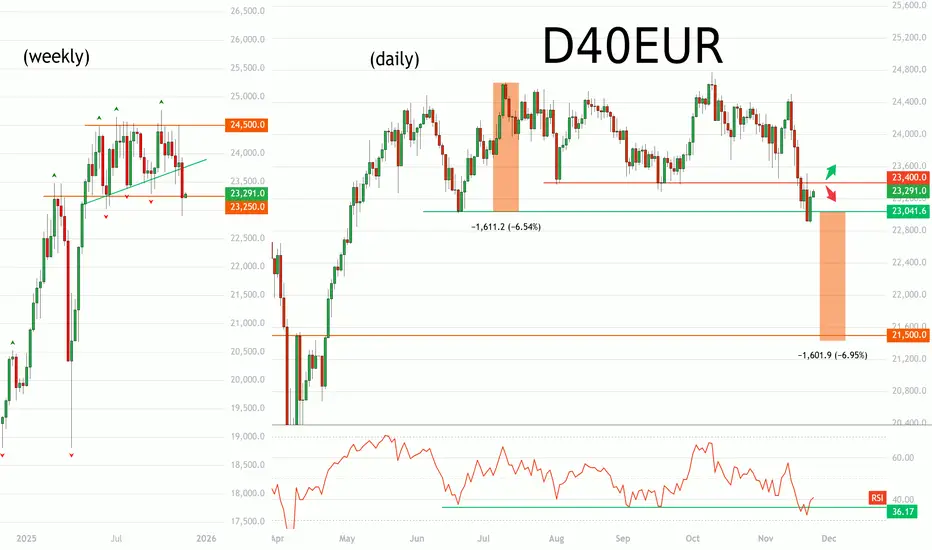
German stocks about to drop 7%? (DAX 40)Setup
Breakdown from horizontal range
Lowest weekly close since June
Breakdown below ‘green’ weekly trendline
RSI back at 35-40 support
Commentary
The DAX is sitting right on the support level of its long term range. The index could rally back into its range, offering reversal setups to go long, or it could continue to breakdown. Should it be the latter, projecting the height of the range lower would target 21500 - a demand area preceding the April rally.
Strategy
Option 2: Sell rebound towards 48,000 supply zone
Option 1: Sell the breakdown below 23,000
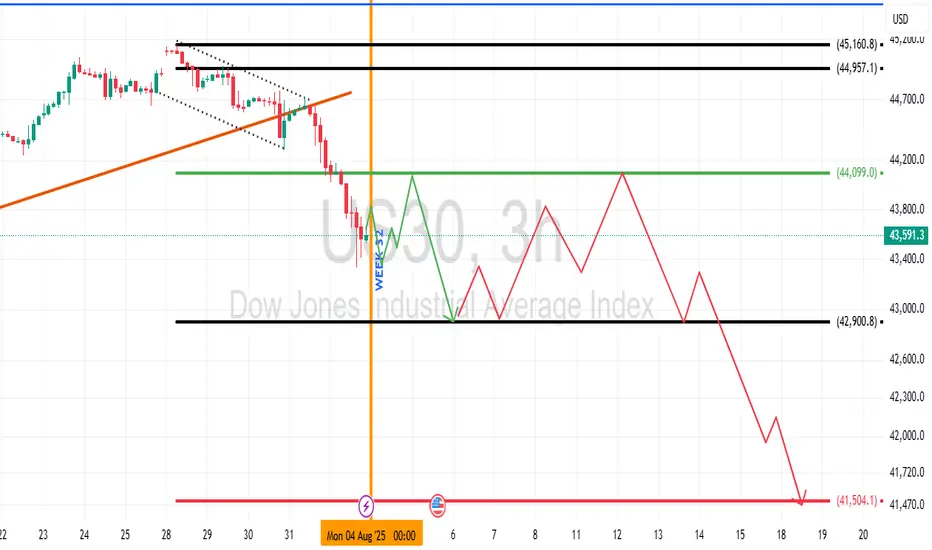
US 30 Dow Jones Industrial Average Week 32 OutlookUS 30, along with related indices, is likely to range for most of the week with early sells to confirm the support of interest. Best interest is in the bearish sentiment right now.
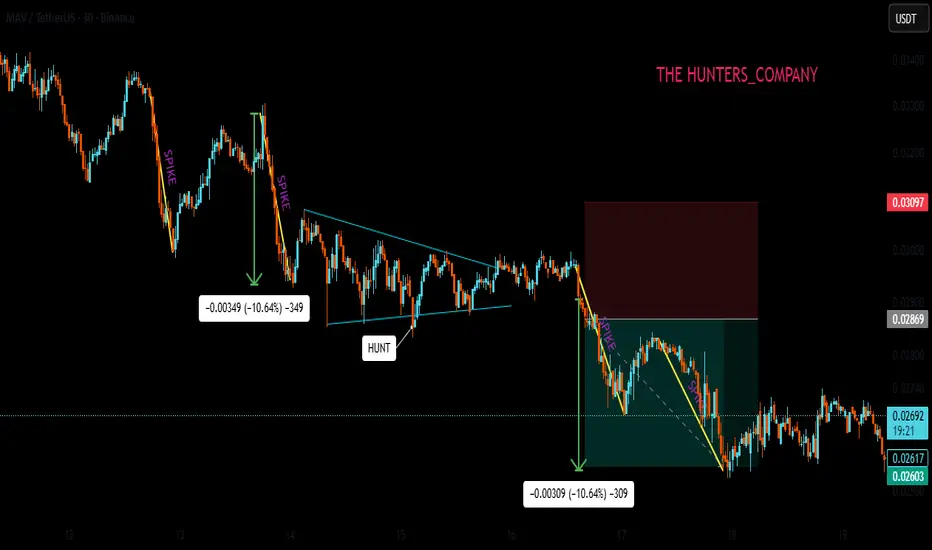
Continuing Triangle PatternHello friends
we are here with a simple strategy tutorial that is a model, but it also requires practice.
Well, whenever we have a structure, whether it is bullish or bearish, it doesn't matter. Now in this example, our structure is bearish and you can see how sharp the spikes that the sellers make are and at one point the price compresses and forms a triangle. Here, considering the bearish structure we have and the strength of the sellers that you see, we expect a decline if the triangle breaks.
Which is the continuation of our downward trend or structure, which we call a continuation triangle, meaning the price continues its previous structure.
The way to trade it is also simple. Just wait for a strong break of the triangle, and when the break is valid and the bottom of the triangle closes, we can enter with a stop loss above the ceiling and a target equal to the previous drop of the triangle, which is the trend move.
Be sure to follow risk and capital management.
*Trade safely with us*
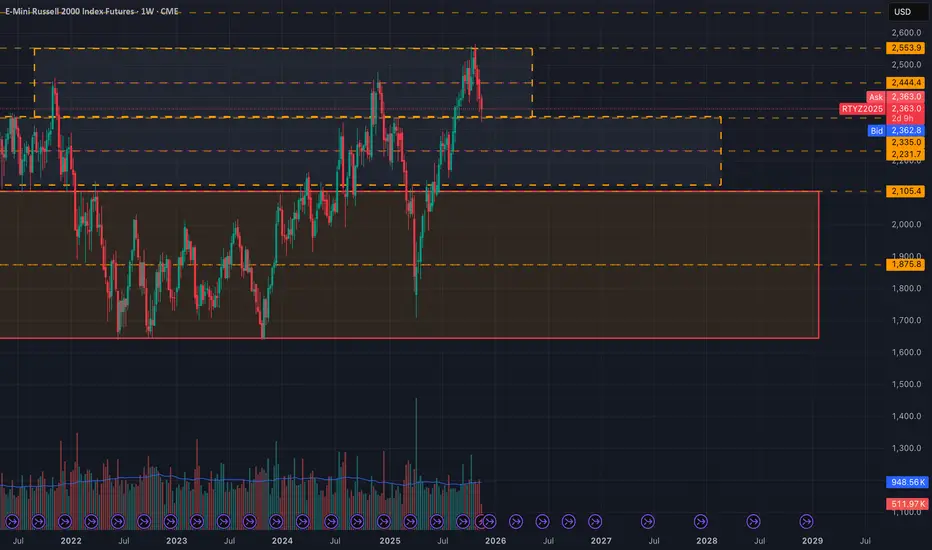
RTY Box LevelsI've taken some time to chart the Russell 200, and I have to say the box is looking quite excellent.
Nice and clean levels, makes a fella wanna put a bid in.
I am not used to trading this name(literally traded it the first time on Monday), but it seems like a good time so far.
I'll be on the look out for LBAFs and LAAFs, no directional bias just trading what is seen atm.
If a look below and fail occurs and is sustained at the upper box, then it is objectively a long (especially if we trade lower first w/a failure to go lower), otherwise if we trade through the level w/ continuation or trade higher first and fail, then a LAAF would take us within the middle box's range.
Trading higher first and failing is more bearish than trading lower first.
Trading lower first and failing to go lower is more bullish than trading higher first.
I like to keep these concepts in mind as I wait for the opening and initial balance ranges to form intraday, and from there, I can form an opinion and initiate a trade.
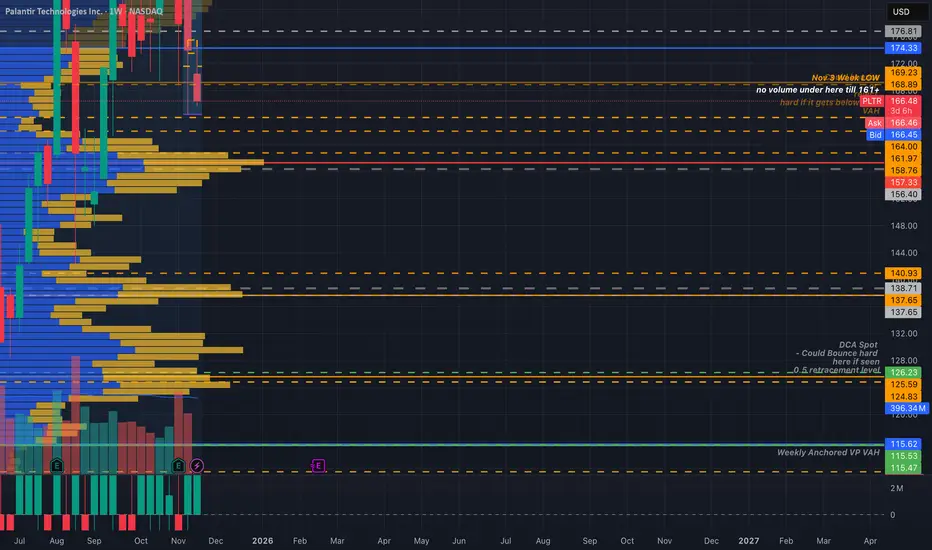
Huntin Wabbits 2.0 - The Doc Sees What's UpPalantir is coming into that death zone if the market doesn't see a recovery soon. If seen, the PA at 161-157(VPOC) will let us know if we dip to $126-$124 again.
Taking a look at this weekly volume profile, the most value for buyers would be at the $115 area.
I'd sell my wife and kids to buy that dip. Jk, I'm single ladies ;).
If price falls and is maintained below the VPOC this simply means that sellers have taken control. Continuation below there and the stock gets Burry'd.
BTC BOX 2.0 - Additional LevelsSharing my updated BTC levels.
If I were you I'd slap a volume profile onto your own charts and examine the weekly levels here for yourself. If 94-95k isn't reclaimed and we fail the bottom of this box BTC will be going much lower.

AVHOL/USDTRY 90% potentialreversal from bottom of the range. on the watch for conservative entry on the downtrend resistance retest. no entry unless the reversal is confirmed 🚫.
stop below daily region close
take profits at upper range & stops to entry.
close position at rectangle target.
⚠️ not a financial advice - DYOR

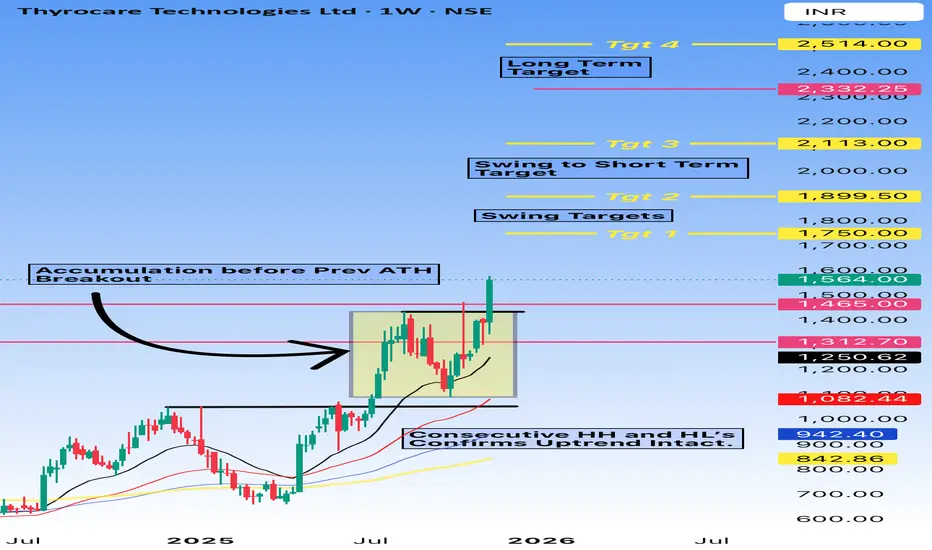
Thyrocare Long - ATH BreakoutThe Chart says it all.
Thyrocare is displaying strong #bullish #momentum, breaking out confidently after a solid period of #accumulation.
The structure is clean—consecutive higher highs and higher lows keep the #uptrend firmly intact.
Price has surged above key resistance levels, turning them into support, and is now marching toward multiple #swing and long-term #targets.
Overall, the chart reflects renewed strength, buyer dominance, and clear upside potential as the trend continues to build. 🚀📈
Levels and Targets in chart.
Disclaimer:
I am not a SEBI-registered advisor. The analysis shared is purely for educational and informational purposes and should not be considered investment or trading advice. Please consult a SEBI-registered financial advisor before making any investment decisions.
Trading and investing in the markets involve risk; you should perform your own research and due diligence.
BULLISH ON XAUUSDBullish Momentum Ahead.
-Touch/Retest on the previous support.
-Im still expecting a drop before or after highlighted move (later on in the day if not week)
-With that being said im still expecting crazy market movement (fake outs;wicks etc)
-Bullish Confirmations:
4HR TF touch on rectangle support zone.
1HR TF new buy candle formed & closed above.
15MTF continuation flag.
-Anything can still happen; hence im expecting to types of entries.
Lets see....
