GAL on Triangular BreakoutGhandhara Automobiles Limited (GAL) is consolidating in a descending / symmetrical triangle near 530–535 after a correction. Bullish RSI divergence suggests selling pressure is easing. A break above 538 should open the door for a move higher, while strength above 562 may accelerate momentum.
Stop-loss: 520 on hourly close.
🎯 T1: 570 (R:R ~1:3)
🎯 T2: 630 (R:R ~1:6)
Upside favored on a decisive triangle breakout.
Resistance_level

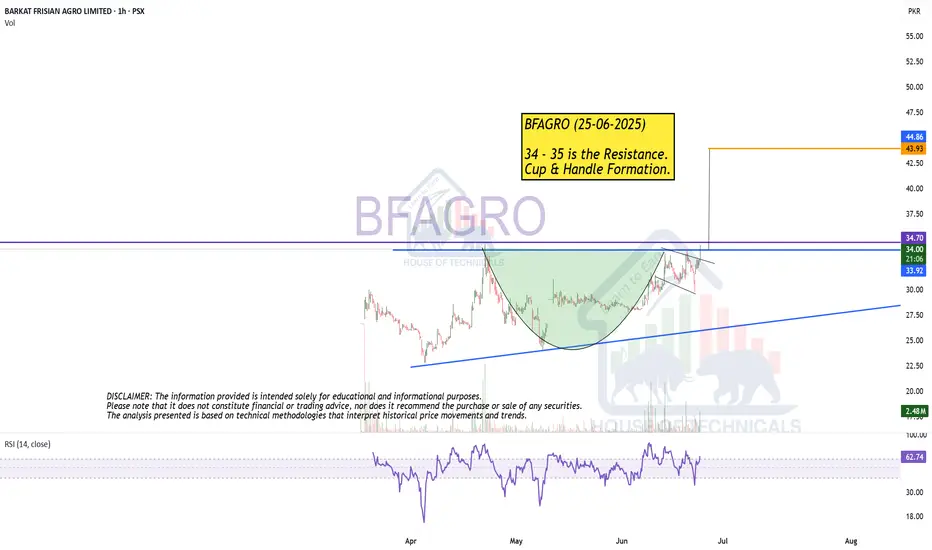
Getting Bullish but..4013 Analysis
Closed at 267 (22-01-2026)
Getting Bullish.
Immediate Resistance is around 270 - 271
Crossing & Sustaining this level may lead it
towards 285 - 286 & then around 296 - 298.
However, breaking 258 this time, may take
the price towards 245 - 248.

Recently made HHFFL Analysis
CMP 22.84 (23-01-2026)
Recently made HH & at rejected from Strong Resistance level around 23 - 24.
Bullish on Bigger time frames.
Now monthly closing above 23.50 would be a positive sign.
Important Support seems to be around 20 - 22
Breaking 18 this time may bring more selling pressure.

MSTR Trade Setup – BTC Correlation PlayMicroStrategy NASDAQ:MSTR caught a strong bid in yesterday’s session, driven by upward momentum in Bitcoin (BTC). With MSTR’s heavy BTC exposure, it often mirrors crypto market trends—and right now, it’s pressing against a key resistance zone.
🟢 Setup:
We're watching the $173.00 resistance level for a potential breakout and clean retest. A successful confirmation above this zone would trigger a long spot entry. Volume confirmation and BTC’s price action will be critical for conviction.
🎯 Targets & Risk:
TP Zones: $200–$230, then $280–$320
Stop Loss: Below $155
This is a momentum-based setup tied closely to BTC’s direction. Monitoring both charts is essential for trade management.

Support and resistance key guide (Volume, Trendlines, FVG, MA)Support and resistance key guide (Volume, Trendlines, FVG, MA)
1️⃣ Importance of Support and Resistance in Highly Volatile Crypto Markets
The cryptocurrency market operates 24/7/365, exhibiting far greater volatility than traditional financial markets. This volatility presents substantial profit opportunities, but it also triggers intense fear and greed among investors, creating significant psychological stress.
Support and resistance serve as key milestones in this chaos, signaling zones where price reactions are likely. Beyond mere technical analysis, they reflect the collective psychology of countless traders. Understanding them is essential for success in crypto trading.
2️⃣ The Nature of Support and Resistance and Their Psychological Basis
Support and resistance occur where buying and selling pressures strongly collide, slowing or halting price movement.
Support:
At this level, buyers see the asset as "cheap enough!" and stand ready, forming a psychological and physical barrier against further decline. Additionally, traders previously trapped in losing positions may sell at breakeven, adding resistance against further drops.
Resistance:
At this level, sellers perceive the asset as "expensive enough!" and offload positions, while traders previously trapped at highs may sell with a "better late than never" mindset, limiting upward movement.
※ Meaning of Support/Resistance Breakouts and “Fakeouts”:
When a support level is breached, existing buyers may panic and trigger stop-loss selling. Conversely, breaking resistance may prompt buyers to enter, accelerating the trend.
However, some breakouts can be “fakeouts,” designed to exploit trader psychology. Premature chasing of such moves should be avoided.
3️⃣ Key Support and Resistance Pattern Analysis
📈 Trendlines and Consolidation Zones: The Psychology Behind Market Order
Trendlines: Trendlines visually represent the shared expectation among traders that price will move in a certain direction. Touching an upward trendline triggers “buy at a bargain” psychology, while touching a downward trendline triggers “it can’t go higher” sentiment.
Consolidation Zones (Boxes): These are zones where buying and selling pressures balance each other. Traders plan trades around these zones, dominated by the “waiting for breakout” psychology to capture significant moves.
📈 FVG (Fair Value Gap): Market Inefficiency and Smart Money Footprints
FVGs occur when the market moves too rapidly through a price range, leaving a “price gap.” They often reflect sudden activity by smart money (institutions, whales).
Gap Filling:
Markets instinctively avoid leaving incomplete states (FVGs) unaddressed. When price re-enters an FVG zone, the players who drove the prior rapid move may close or re-enter positions, forming support/resistance. Beginners can treat FVGs as smart money footprints and follow their activity strategically.
📈 Moving Averages (MA): Collective Psychology and Trend Direction
Moving averages reflect the average price perceived by the market over a period. Being widely monitored, they act as psychological support/resistance levels.
Short-term MA (e.g., 50MA): Reflects short-term trader sentiment. Price below it can trigger “short-term trend broken?” anxiety, while above it fosters optimism.
Long-term MA (e.g., 200MA): Represents long-term trader psychology and trend direction. Price below 200MA creates fear of a long-term downtrend, while above inspires hope of a sustained uptrend. When acting as support/resistance, MAs carry strong psychological consensus as a widely observed benchmark.
📈 POC (Point Of Control) Volume Profile: Market Consensus and the Power of Volume
POC is the price level with the highest traded volume over a period. It indicates market agreement on price, with substantial volume concentrated there.
Price below POC: POC becomes strong resistance. Buyers trapped in losing positions may sell at breakeven, and sellers actively resist upward moves.
Price above POC: POC acts as strong support. Buyers believe “price won’t fall below this level,” and prior sellers may switch to buying.
POC represents the market’s “expected price” and the zone where loss-aversion psychology is strongest.
📈 Fibonacci: Natural Order and Human Expectation
Fibonacci retracements apply golden ratio mathematics to charts, reflecting the expectation that price will reverse at certain levels, forming support/resistance.
These levels are not coincidental; many traders plan trades around them, causing real market reactions.
Levels like 0.5 (50%) and 0.618 (61.8%) are psychologically significant, viewed by traders as buying or selling opportunities. Support/resistance forms through “herd psychology,” as many act in unison.
📈 CME Gap: Institutional Moves and Market Regression Instinct
CME gaps occur in Bitcoin futures dominated by institutional investors. They happen when the spot market moves over weekends while futures are closed, and the market tends to “fill the gap.”
Gap Filling: CME gaps represent periods without institutional activity, prompting the market to normalize these “abnormal” price zones.
Traders anticipate “the gap will eventually be filled,” making these zones potential strong support/resistance, reflecting future-oriented market psychology.
4️⃣ Managing Trading Psychology Using Support and Resistance
Even the best tools are ineffective without psychological discipline.
Confirmation bias and stop-loss discipline: Ignoring losses due to selective perception leads to ruin. When support breaks, acknowledge your prediction was wrong and act decisively to exit.
Overbought/oversold psychology and FOMO:
Avoid chasing price surges out of fear of missing out (“everyone else is profiting, why not me?”).
During crashes, resist panic selling at the bottom. Base trades on your rules derived from support and resistance.
Partial trading for risk management:
Avoid buying all at support or selling all at resistance at once. Splitting trades across multiple support/resistance levels provides psychological stability and reduces the impact of wrong predictions.
5️⃣ Comprehensive Strategy Formation and Practical Application Tips
Multi-level Support/Resistance Confluence: Overlapping zones (e.g., Fibonacci 0.618 + 200MA + POC + FVG bottom) create very strong support/resistance. These reflect collective trader agreement and can be traded with higher confidence.
Volume Analysis and Support/Resistance Strength: High volume at a zone confirms its significance. Reliable breakouts require strong volume, showing market participation and intent.
Develop Your Own Trading Plan: Don’t blindly follow all patterns. Choose indicators and methods that suit you to establish personal trading rules. Adhering to these rules maintains psychological stability and long-term success.
If you found this content helpful, please show your support with a Boost (🚀) and a comment (💬)! Your encouragement is a great motivation for us to create better analyses and content. You can also follow us to receive notifications about new posts.
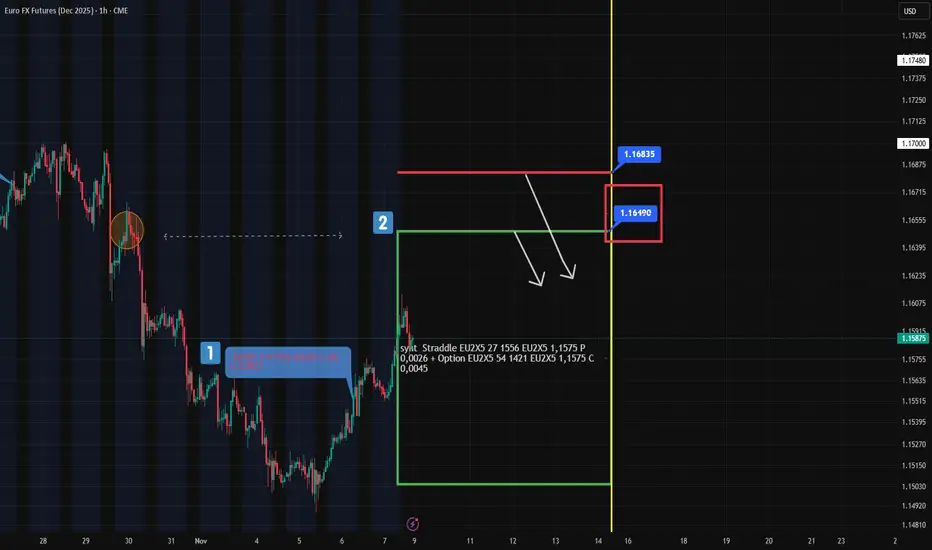
Euro Sentiment: What’s Ahead in the Next Few DaysRetail positioning tells a clear story:
70% short / 30% long on EUR/USD
→ That’s a textbook setup for a long .
The crowd is bearish — but structure favors bulls.
From a technical standpoint, we’re seeing a solid corrective move up from 1.15, with even a mini-higher high – higher low pattern forming — yes, like the ones in classic TA textbooks.
It looks not just logical… but inviting.
Now let’s look at the options market:
There’s real bullish momentum building:
1. Naked calls being bought
2. Call spreads actively traded
My focus is on two key structures:
First, the call at 1.165, entered on November 6 — now already in the money (#1 at chart)
Friday’s straddle at 1.1575 — its upper boundary aligns perfectly with the trigger level from October 29 (#2 at chart)
🎯 Confluence? Yes.
🔍 Putting It All Together:
We have fuel for further upside in EUR:
Retail overcrowded short
Technical structure improving
Options flow turning bullish
But resistance looms ahead:
1.1649 and up to 1.1683 (futures prices) are strong zones
These levels could cap the upside move and offer high-probability short setups
👉 In particular, 1.1649 stands out as an ideal zone to consider a short.
On Monday, I’ll calculate the Expected Range (ER) levels — and if it aligns with this resistance, I’ll definitely place a limit order here.
Not using ER levels yet?
Spend one minute learning them — and gain the edge most traders overlook.
Bitcoin Cycle Repeat, taking into account Base 10 LevelsTo see the cycle repeat, it is critical to account for the build up of pressure and defense of the 1k 10k and 100k levels, then everything else follows the same extension and fib pullbacks.

Resistance retest complete?This retest represents a retracement back to the previous lower high — a key structural point in the trend. Given the current market momentum and weakening reaction at that level, there’s a strong likelihood that this lower high will be broken, potentially signaling a shift in trend or continuation of bullish pressure beyond that point.

TSLA Support & Resistance Lines for September Month 2025TSLA’s September map uses the same monthly bands. Expect faster moves and occasional overshoots; size accordingly.
30-minute for 2–3-day swings
Longs
Rejection at lower band: Buy back toward half-step; add on clean midline reclaim.
Acceptance + retest: Hold above a line and retest from the top → ride to next line.
Shorts (when price trades above lines)
Volatility fade: TSLA often overshoots the upper band. If a 30-min prints a wicky close back inside, short the fade.
- Targets: Nearest half-step, then midline.
- Stop: Above the overshoot high (give TSLA a bit of air).
UTAD-style failure: If TSLA holds above a band briefly but fails the retest (can’t sustain closes above, sellers reclaim), short on the first failed retest.
- Targets: Half-step → next line down.
- Invalidation: Clean 30-min close back above the failed line.
Management
Scale at each line; go flat if a 30-min close invalidates your level. Trail quickly after TP1—TSLA snaps.
1–3 hour for weekly swings
Bias
Acceptance above midline → continuation to the next band.
Rejection at upper band → path back to midline more likely.
Shorts
1–3h exhaustion above band: Bodies compress, momentum fades, then a close back inside → short toward the half-step/midline.
Break-and-fail sequence: Close above a band → lose it → retest from below fails → short continuation lower.
Risk: Stop just above the lost line; tighten on first target tag.

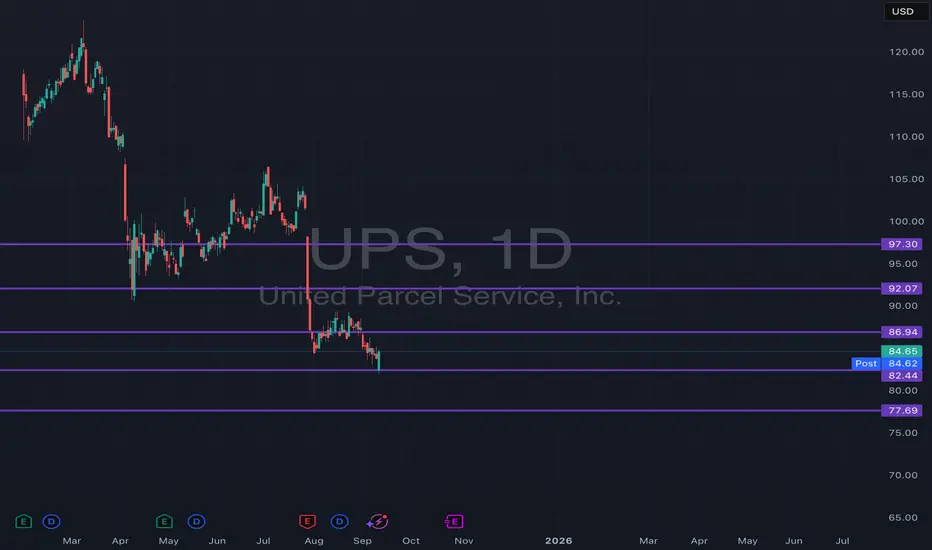
UPS Support & Resistance Lines for September Month 2025This chart highlights September’s monthly support and resistance bands for UPS, built as “guardrails” around the month's price action. The outer bands mark the expected extremes, while the inner (half-step) lines act as intermediate pivot zones where price often pauses, flips, or accelerates. Think of them as a pre-mapped playbook for the month: upper band = supply, lower band = demand, with the midlines guiding targets and risk.
How I trade it
30-minute for 2–3 day swings
Setup: I wait for a 30-min close into a band (upper or lower) plus a clear reaction (wick rejection, momentum fade, or structure break).
Entry: Fade the move back toward the nearest midline when the reaction confirms; or ride a continuation if price accepts above/below a band and retests it from the other side.
Targets: First target is the nearest half-step line, second is the opposite half-step, final is the far band if momentum persists.
Risk: Stop goes just outside the band (for fades) or just back inside the band (for breakouts). If the 30-min closes back through my line, I’m out—no questions asked.
Management: Scale out at each line; move stops to break-even after TP1.
1–3 hour for weekly swings
Bias: I align 1h/2h/3h trend with where price sits relative to the monthly bands. Acceptance above a midline favors continuation to the next line; rejection at a band favors a mean-revert path.
Entry: Use a retest of the broken line on 1–3h candles for confirmation (close-through → retest → resume).
Targets: Next line on the map; let winners run to the next higher-timeframe band if structure holds.
Risk: Stop beyond the reclaimed line; I tighten weekly as soon as we tag the first target zone.
Playbook cues
Rejection at outer band → look for fades back to midline.
Acceptance and hold beyond a band → trade continuation into the next zone.
Stalls at half-step → take partials or tighten stops; these levels often “decide” the next leg.
Use the bands to plan entries, exits, and invalidations before the move. No predictions—just rules around predefined levels for September.
DXY countertrend play | 9 SEPT📌 Key Observations:
Asian session highs swept ➡️ liquidity grab complete.
Price reacted from resistance zone (97.470 – 97.576) 🟦.
Minor LQC marked — a close below this level confirms bearish continuation.
🎯 Targets:
First downside target: 97.300 (intra-day liquidity pocket).
Main target: 97.100 🔽.
⛔ Invalidation:
A clean break & hold above 97.576 would shift bias back to bullish intraday.
⚡ Trade Summary:
Looking for short opportunities after this liquidity sweep, aligned with overall bearish momentum. A confirmed rejection from resistance strengthens the short setup. Patience is key — wait for candlestick confirmation before entry.

XAUUSD Update – Resistance Rejection and Market Structure Shift"XAUUSD Update – Resistance Rejection and Market Structure Shift
Price Action: Gold has recently tested the 3550 – 3600 resistance zone, where the market showed signs of rejection. This level represents a significant supply area formed by previous liquidity grabs.
Market Structure: After a strong bullish impulse, the current price behavior suggests a possible correction phase. The rally left behind areas of imbalance that could attract price back downward.
Key Observation:
The first reaction zone sits around 3480, which aligns with a structural support level from past consolidation.
A deeper correction may extend toward the 3330 – 3320 support region, a critical level where historical demand has been observed.
Context: Liquidity above recent highs has been taken, and the chart now shows potential for retracement to restore balance before determining the next directional move.

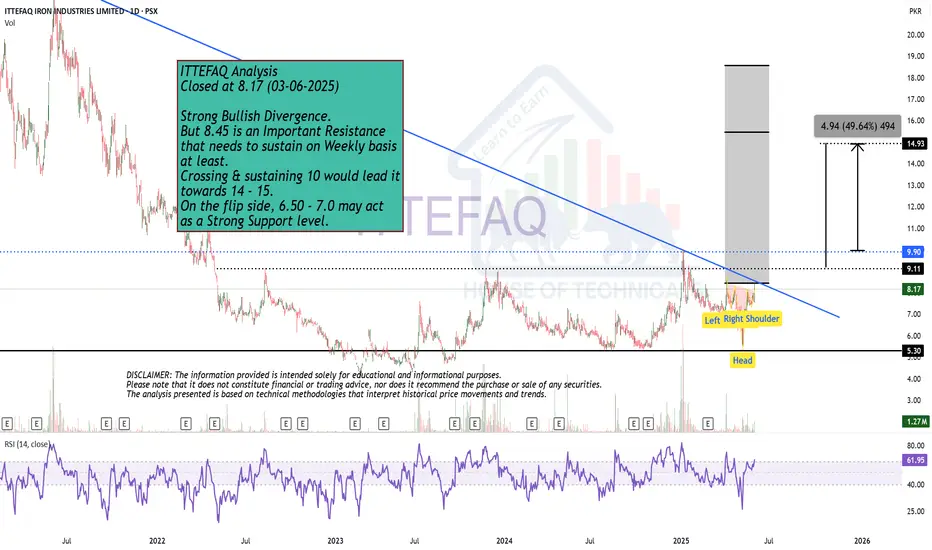
Strong Bullish Divergence. Closed at 8.17 (03-06-2025)
Strong Bullish Divergence.
But 8.45 is an Important Resistance
that needs to sustain on Weekly basis
at least.
Crossing & sustaining 10 would lead it
towards 14 - 15.
On the flip side, 6.50 - 7.0 may act
as a Strong Support level.
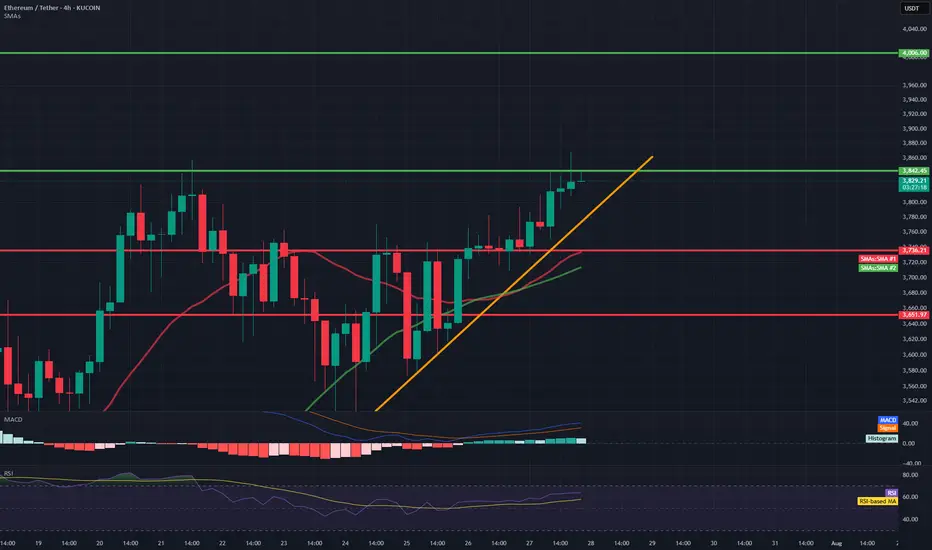
ETH/USDT 4H Chart📊 General Context
Ethereum is rising in a strong short-term uptrend, supported by a rising trendline (orange).
Current price: 3831 USDT
We are approaching a significant resistance level around 3842–3850 USDT (green line).
Technical support is located around 3760 USDT (previous consolidation level and 50/200 SMA).
🔍 Technical Levels
Resistance:
3842–3850 USDT – local high, currently being tested.
4006 USDT – key psychological level and the last local high on the chart.
Support:
3762 USDT – previous resistance, currently turned into support (may be tested in a correction).
3650 USDT – strong technical support, confirmed several times in the past.
SMA50 and SMA200 – currently just below the price, also acting as dynamic support.
📈 Technical Indicators
MACD:
The histogram is rising and positive → bullish momentum.
The MACD line crosses the signal line from below → a buy signal.
RSI (14):
Currently: around 64 → not yet overbought, but close to the overbought zone.
Slightly rising trend, but may suggest impending market overheating with further gains.
🧭 Trend
Short-term: strong uptrend (trend line, green candles, breakout from consolidation).
Medium-term: higher lows and higher highs – the uptrend is maintained.
The price is holding above the 50 and 200 SMAs – confirming bullish sentiment.
⚠️ What to watch next?
A 4-hour candle close above 3842 USDT → confirmation of a breakout, a potential attack on 4000–4010 USDT.
A break of the trend line (orange) → a possible correction to 3760 or even 3650 USDT is possible.
An RSI rise above 70 → an overbought signal, a possible pullback or consolidation.
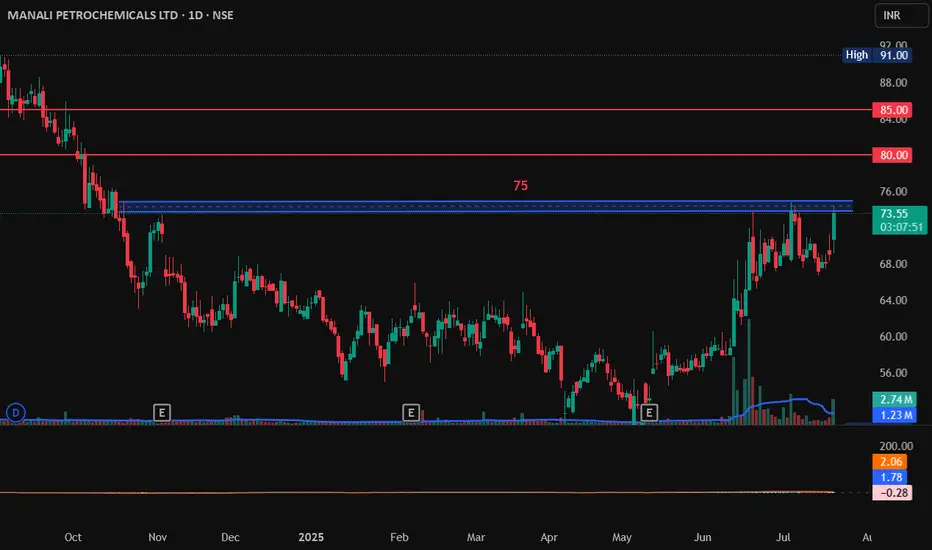
MANALI PETROCHEMICALS LTD, Breakout, LongMANALI PETROCHEMICALS LTD has raised 6% today and its near the resistance zone of 75. If it breaks this 75 and sustain it with Bullish candlestick patterns like Bullish Engulfing, Hammer & Inverted Hammer, Piercing Line, Morning Star, Three White Soldiers, Tweezer Bottoms or Bullish Harami.
Entry on Bullish pattern: 75
Target1: 80
Target2: 85.
SL: 70.
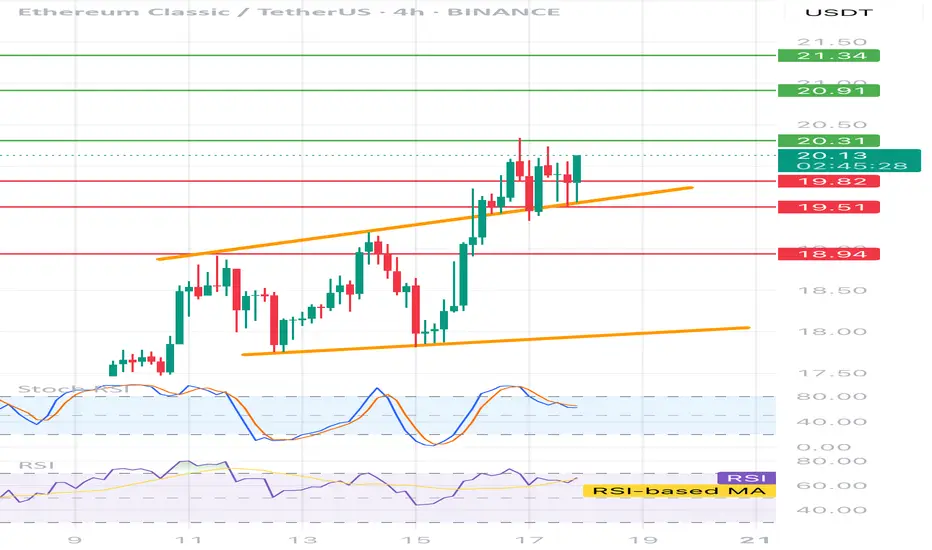
ETCUSDT 4H📊 Price:
Currently around 20.05 USDT
⸻
🔶 Technical formation:
• Ascending channel - clearly marked with two orange trend lines.
• The price is currently testing the upper edge of the channel - it is possible to break or correction.
⸻
📉 Support and resistance:
• ✅ Support:
• 19.73 (local, on the closure of the candles)
• 19.51 (technical, tested several times)
• 18.94 (stronger, historical)
• 🚫 resistance:
• 20.31 - the closest local resistance
• 20.91 - key level
• 21.34 - strong resistance from higher intervals
⸻
🔄 oscillators:
• STOCHASTIC RSI - in the inheritance phase (descent from buying), possible local decline / correction.
• RSI (14) - approx. 60, slightly positive trend, but without exaggeration - no purchase, place for further increases.
📌 Fast strategy:
• 🟢 Long: After breaking and Retescia 20.31 → TP 20.91 / 21.34
• 🔴 Short: after rejection 20.31 or the upper line of the channel → TP 19.73 / 19.51
• 📉 SL: In both cases, it is best 0.3–0.4% above the last high/low
Big Week for Markets: U.S. CPI Tomorrow – What It Means for GoldThis week is packed with news, but the main focus is the U.S. CPI report dropping tomorrow.
🗓 Key Event: U.S. CPI Report
📍 July 15, 2025 | 12:30 p.m. UTC
The CPI report measures inflation and heavily influences the Fed’s rate decisions. Last month’s CPI came in at 2.4% vs. 2.5% expected, following 2.3% vs. 2.4% in April. While it seems inflation is rising, the bigger picture shows stable annual inflation in the 2.3%–3.0% range, keeping things under control—likely the reason Trump is pressuring Powell to cut rates.
Market expects June CPI to be 2.7%.
🤔 Possible Scenarios:
1️⃣ CPI > 2.7%: Bullish for DXY 📈. The stronger the print, the bigger the spike, but I see this scenario as less probable.
2️⃣ CPI < 2.7%: Bearish for DXY 📉. We may see a USD dump, though likely shallow since CPI could still be higher than previous months.
✨ What About Gold?
I don’t expect a major reaction in gold:
✅ Higher CPI? Gold often benefits as an inflation hedge.
✅ Lower CPI? Also supportive for gold as it weighs on the USD.
🔍 Technical Outlook:
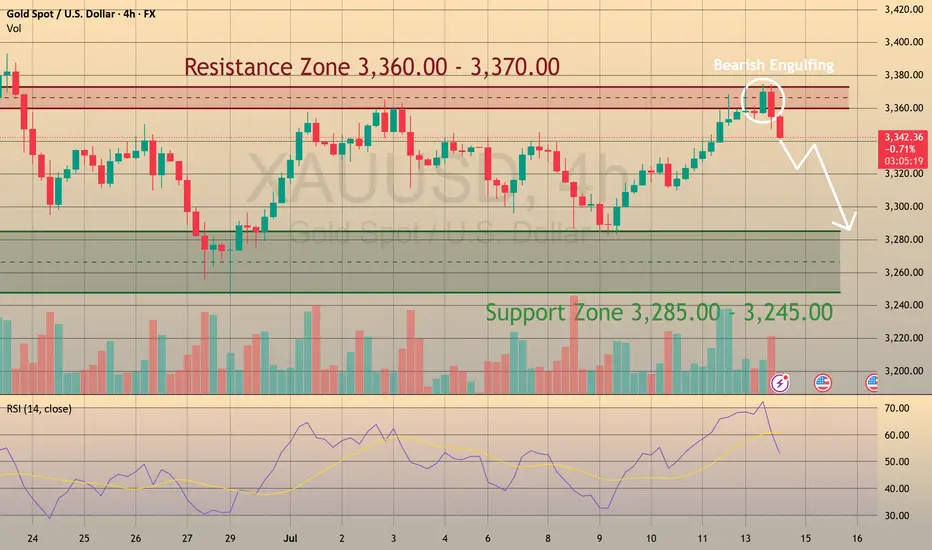
Gold has been trading within a triangle since April 22, forming lower highs and higher lows. We may currently be in Wave D (Elliott Wave), aiming toward the triangle’s upper boundary slightly above $3,400 resistance. After that, Wave E may develop – but that’s a story for another post.
SOl on Resistance level. If this area is broken and retested I will buy otherwise will wait to buy the low around 126$

ETH on resistance.Ethereum 2 possible probabilities. 1 shows back demand level around 2100$ the other is a break of 2500$ and retest.

Bitcoin on Resistance levelMy current view. I am sitting mostly in cash waiting for a breakout or fall to buy the dip NFA

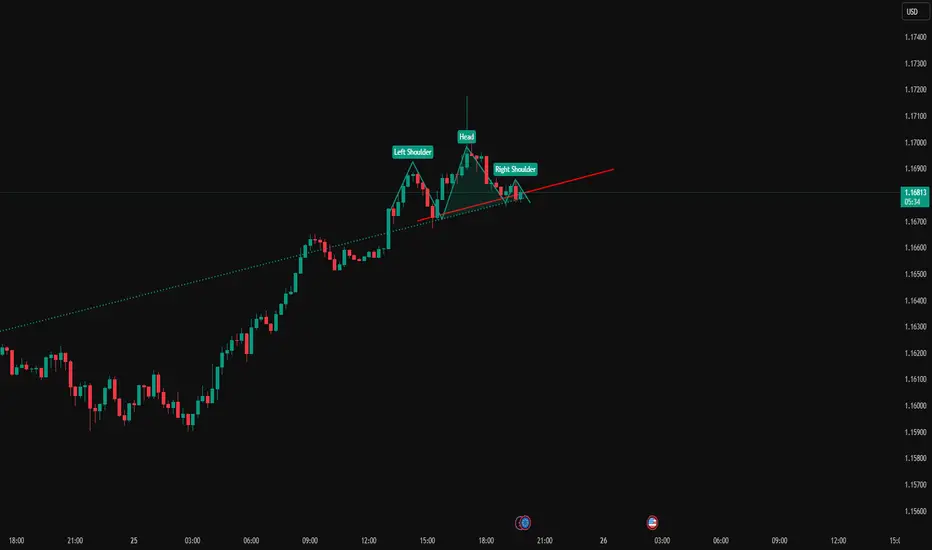
EURUSD Head And ShouldersEURUSD has created a normal head and shoulders pattern while reaching a HTF resistance on the weekly/daily. I expect this pattern to be a catalyst to a bearish movement.
MUTHOOT FINANCE at Best Resistance !! This is the Daily Chart of MUTHOOT FINANCE .
MUTHOOTFIN is currently trading near its resistance range around the 2700 range.
MUTHOOTFIN has completed its upward move as per its natural price behavior, with the rise reaching up to the 2700 range.
If This level is sustain , then we may see lower prices in MUTHOOTFIN.
Thank You !!
