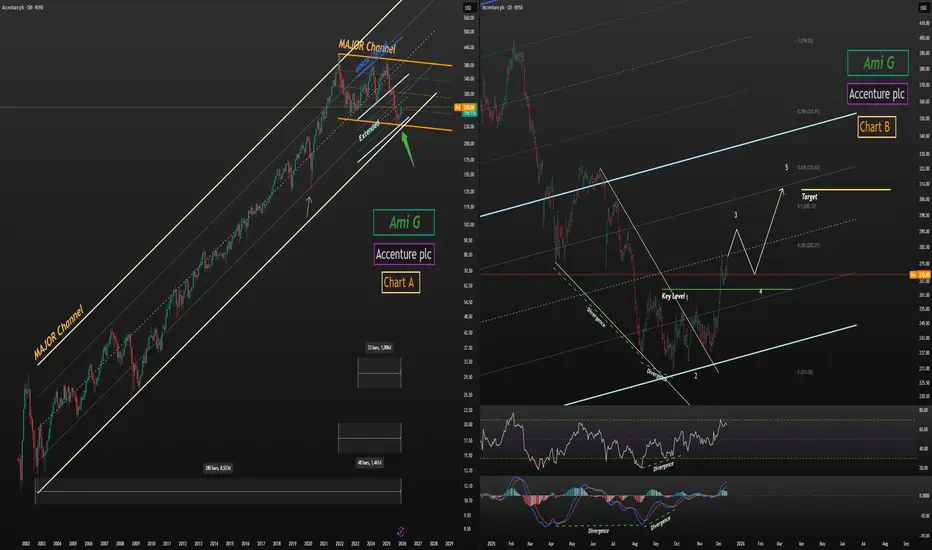
Accenture plc ACN Multi Timeframe Channel AnalysisAccenture plc (ACN) Multi Timeframe Channel Analysis
1. Long-Term Structure
This analysis is built on three major structural channels:
24-year channel
5-year channel
3-year extended channel
Price is currently positioned at a rare triple confluence zone, touching:
The bottom of the 24-year channel
The bottom of the 5-year channel
The extended lower boundary of the 3-year channel
This alignment significantly strengthens the probability of a medium-term bullish reversal.
2. Reversal Signals
At the channel confluence, price completed a clean Ending Diagonal pattern and reacted strongly, showing:
Powerful bullish divergences on momentum indicators
A decisive breakout from the diagonal structure
These signals collectively confirm a strong demand zone and a potential macro reversal.
3. Wave Count and Bullish Scenario
Following the breakout, price has started to build a five-wave impulsive structure.
After breaking its key level, ACN is now positioned in wave 3 of 3, which is typically the strongest part of the move.
Minimum upside target:
310
This level aligns with structural resistance and wave projections.
4. Final Notes
This is my personal analysis I’d be glad to hear your views.
For more detailed breakdowns and live swing trades on stocks, feel free to follow me on TradingView.
Reverse
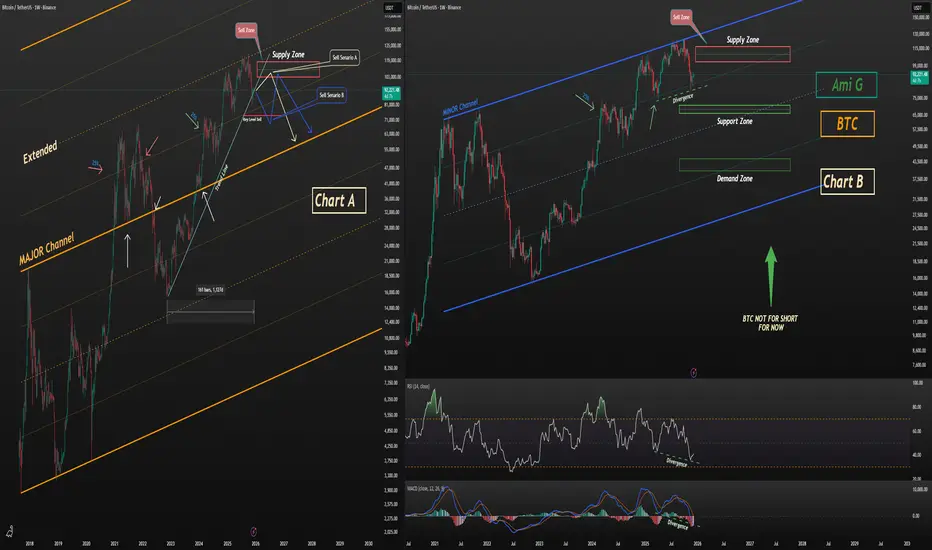
Bitcoin Short Setup – Why It’s Still Early📝 Bitcoin BINANCE:BTCUSDT Short Setup – Why It’s Still Early
At the moment, opening a short position on Bitcoin is premature.
This does not signal a buying opportunity here — it simply highlights that short positions (especially with leverage) carry high risk from this zone.
📊 Chart A – Major Channel Structure
Bitcoin is trading inside a major channel.
After breaking out of this structure and extending beyond it, price has shown clean and consistent reactions to the extended boundaries.
The latest rejection from the upper zone also aligns with the 50% mid-line, further confirming the significance of this major channel.
📊 Chart B – Short-Term Channel
The shorter-term channel also justifies the recent top.
However, shorting from the current zone is still too early, and here’s why:
Price has reached the 25% reaction zone on both charts
This level has repeatedly acted as a sensitive reaction point across multiple timeframes
Bitcoin is sitting on its 160-week trendline
Clear bullish divergence appears on both MACD and RSI
Given these factors, initiating a short here is high-risk and not technically justified yet.
📉 Short Scenarios (Only If Confirmed)
Scenario A — Chart A
Wait for price to revisit the marked supply zone, then short only with a clear trigger.
Scenario B — Chart B
A short becomes valid after breaking the key level, followed by a pullback into the supply zone.
📌 Outlook
My base view: Bitcoin is likely to correct toward the demand zone shown on Chart B.
📣 Final Note
Stay safe, trade smart.
Follow the profile so you don’t miss the daily live swing trades and day-trading setups shared here on TradingView.
Relative analysis of Bitcoin vs. Gold and Total CryptoOn the BINANCE:BTCUSDT / TVC:GOLD ratio chart, price attempted to re-enter the primary channel after the initial breakout, aiming to push back toward the channel’s upper boundary. However, despite (105) days of upward attempts, the ratio consistently struggled with the dynamic resistance area.
After the breakdown, price extended toward the lower boundary of the extended channel, where it showed a strong and precise reaction.
From here, the structure suggests a potential bullish corrective move toward the resistance zone, supported by:
bullish divergence between price and MACD,
clear weekly rejection candles,
and price interaction at the channel’s lower boundary.
This scenario is further reinforced by the Crypto Market Cap (excluding Bitcoin) CRYPTOCAP:TOTAL2 vs. Gold TVC:GOLD ratio. This chart has also reached the bottom of its (180-week) channel, formed a weekly bullish divergence, and has now returned back inside the channel.
As shown on the chart, the TOTAL crypto channel exhibits cleaner and more consistent reactions compared to the Bitcoin channel.
If our key level is broken, the bullish scenario becomes invalid, and price is likely to move toward the support zones. This analysis will be updated accordingly.
BINANCE:BTCUSDT
TVC:GOLD
CRYPTOCAP:TOTAL2

YYAI RS, 949M outstanding shares, extremely overvaluedToday YYAI announced a RS of 50 to 1. At current outstanding shares, 949 million, the company market cap is approximately $100 million. The company is, at best, worth $30 million in SOL (which is less than $30 million today). Short the hell out of it down to $0.03 or below. Can't lose.

Wedge pattern formationWe are anticipating Reversal just after breaking the high of previous week high. First we grab liquidity above the previous week high

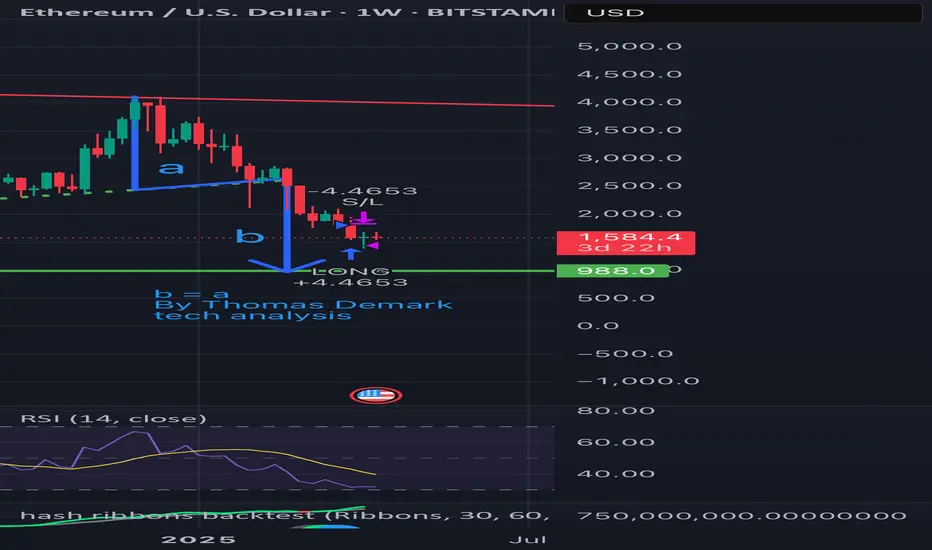
ETH is falling per Demark’s technical analysis: Target at $988?According to Thomas Demark’s method — when b = a, the next target for ETH is around $988.
📉 Price broke the ascending support
🔻 Wave “a” from $4000 to $2500 has already played out
📏 Wave “b” is projected downward — target aligns with a strong historical support zone
📊 Weekly RSI is nearing oversold territory
Conclusion: The $988 area is critical. A reversal may occur there if selling pressure weakens.
Stay sharp.
#ETH #Demark #CryptoAnalysis #TechnicalAnalysis #Ethereum
A poem of the marketIn the financial markets, the Pin Bar candle is like a poem silently composed within the charts, a poem that tells the tale of the battle between buyers and sellers. This candle, with its long shadow, narrates the story of effort and defeat, as if one side sought to conquer the sky or split the earth, but in the end, was pushed back, leaving only a shadow of its aspirations.
**The Bullish Pin Bar** is like a poet who, in the darkness of night, sees a star and, with hope for light, draws its long shadow toward the earth. It says, "The sellers tried to pull me down, but I, with the light of hope, rose again and conquered the sky."
**The Bearish Pin Bar** is like a poet who, at the peak of day, sees a dark cloud and, with fear of darkness, casts its long shadow toward the sky. It says, "The buyers tried to lift me up, but I, with the force of reality, returned to the ground and embraced the darkness."
The Pin Bar candle, with its small body and long shadow, is like a poem that encapsulates all the emotions of the market in a single moment. This candle, in its simplicity and beauty, reminds us that sometimes efforts do not yield results, and sometimes, turning back is the only way forward. Within this candle lies the story of hope and despair, effort and defeat, light and darkness—a story that repeats itself every day in the financial markets, each time narrated in a new language.
"Taken from artificial intelligence."

MSTR Daily ShortHere's a daily view of MSTR.
I expect a classical Trend-Barrier Reversal.
Let's see how this plays out.
Happy Christmas all §8-)

JIN, weekly setup, waiting for confirmationJIN update, due to a false alarm triggering on the 1H because trendline was too close.
JIN had a strong impulse move this morning 1315 to 1360, it did not BO of descending wedge, no action.
Weekly at horizontal and channel support.
Daily under the downtrend line, hourly under the downtrend line.... sorry for wasting your time 😛

Reverse Stock Split for Nasdaq: ATPC? What’s the Impact to ShareAgape ATP Corporation (ATPC) is set to implement a 20:1 reverse stock split, a very good move designed to consolidate the company’s shares and potentially improve its market positioning.
What are the impacts from the reverse stock split?
Enhanced Stock Price. The reverse split will increase the share price proportionally, making ATPC’s stock more attractive to institutional and retail investors who often avoid lower-priced stocks.
Nasdaq Compliance. By increasing the share price, ATPC ensures continued compliance with Nasdaq’s listing requirements, particularly the minimum bid price, which is crucial for maintaining their listing status.
Better Market Perception. A higher stock price can improve investor perception, potentially attracting a broader base of investors who prefer higher-priced stocks for their perceived stability and prestige.
Liquidity and Volatility. While the number of outstanding shares will decrease, which might reduce liquidity slightly, the split could also reduce volatility as the stock price stabilises at a higher level. Overall, it is more of a net neutral impact on the trading liquidity.
Positioning for Growth. With a stronger presence on Nasdaq post-split, ATPC is better positioned to capitalise on future growth opportunities, whether through attracting more substantial investments, mergers, or acquisitions.
Overall, better visibility in the Nasdaq market.
Post-split, ATPC is expected to project a stronger image on Nasdaq. This move aligns with the company’s broader goals of becoming a major player in the renewable energy sector. The reverse split is not just about compliance; it’s about setting the stage for ATPC’s next phase of growth, where they aim to leverage their innovative projects and strategic partnerships to gain market share and investor confidence.
Investors should keep an eye on ATPC as the reverse split could mark a significant turning point, potentially driving long-term value as the company continues to expand its footprint in the green energy market.

NVIDIA: Time for a breather 😮💨Let's take a closer look at Nvidia NASDAQ:NVDA – a stock generating a lot of buzz.
On the two-day chart, we observe a potential completion of Waves (3) and (4) between November 2021 and October 2022. As an alternative, we could see Waves (1) and (2), leading to the upcoming Wave (3). The targets are ambitious, and time will reveal the accuracy of these projections.
Following Wave (4) or alt. (2), we've formed a 1, 2, 3, and 4 pattern. Now, Wave 5 is on the horizon, and our price target is positioned at the 161.8 % fibonacci extension.
Zooming in, since our sub-wave 4 in red, we've constructed a Wave ((i)) and ((ii)) at $450. We're now in the process of building Wave ((iii)). A brief corrective move may follow before reaching the circled Wave ((iii)) at 161.8, around $662.
After we reach our targets, we'll be on the lookout for an entry point for the next big Wave 5 movement.

Reversal channel breakout Potential price breakout of a reversal channel towards a key support area.
Counter movement: If price breaks current resistance area upwards, retrace and form new support area; then price will potentially move towards a key area (previous lower high on the daily timeframe). Place pending orders above and below resistance area and let the price play out.

3M READY FOR LONG.3M is ready to reverse.
A head and shoulders appeared on the 4-hour time frame.
I think now is a good time to trade long term.
Target 110 -120 USD
If we will above to 150-160 USD.

SELL OPPORTUNITY ON AUDUSD On AUDUSD Price is currently trading within a well-defined ascending channel on 1HTF, inside a 4HTF ascending (reversal pattern) this gives an additional confluence.
Waiting for price to test the upper dynamic trendline that serves as my support before going short.
If you found this helpful, please support your fellow trader with a like.

Resistance Ahead | Short BiasOn week chart
$4 is the strong resistance zone for this bullish
If RNDR can break and close above $4, the next target around ATH $8
Otherwise, RNDR will accumulating in range $2-3 a while before massive move will happen
Time will tell

REVERSE ON $0.90We have explained to you the extremely important price levels and told you which areas are important with detailed explanations and indicator confirmations and price action confirmations.
So definitely from this analysis.

NZDCHF I Potential short-term buyWelcome back! Let me know your thoughts in the comments!
** NZDCHF Analysis - Listen to video!
We recommend that you keep this pair on your watchlist and enter when the entry criteria of your strategy is met.
Please support this idea with a LIKE and COMMENT if you find it useful and Click "Follow" on our profile if you'd like these trade ideas delivered straight to your email in the future.
Thanks for your continued support!

SNP 500 Corrective Price ActionThe SNP 500 $SPY is in a corrective pattern which in EW is called an open diagonal where each subwave of 1-5 subdivides as either 5-3-5-3-5 or 3-3-3-3-3. In this chart, I've counted the diagonal as 3-3-3-3-3. Currently, the SNP 500 is making a zig-zag in (b) before continuing in five waves down to complete ((v)) of A. Currently expecting the SNP500 to go to around 300 before turning up and beginning the B wave. I don't expect to see any corrective rally's until after mid term elections in the US.

Do you remember Yahoo!? 📈It's been a long time ago, that Yahoo had any value in browsing the internet. I don't think they are really "up to date", but from a pure technical view this long setup could work.
We've established on the weekly timeframe a clear higher low - waiting for the higher high now.

EURCAD I Approaching resistance zone Welcome back! Let me know your thoughts in the comments!
** EURCAD Analysis - Listen to video!
We recommend that you keep this pair on your watchlist and enter when the entry criteria of your strategy is met.
Please support this idea with a LIKE and COMMENT if you find it useful and Click "Follow" on our profile if you'd like these trade ideas delivered straight to your email in the future.
Thanks for your continued support!

TSLA set for 300 TPTSLA surpassed analysts estimates for EPS and Reveneus.
40% growth with double digits operational margin speak for itself. Moreover, TSLA was the main driver for the last 2 mini-rallies of the entire NASDAQ Index.
Look for upside to 300, watch your stops and size accordingly.

8035 longAs you can see on the chart - I'm feeling bullish. Entering with a tight SL. Let's see how this trade plays out.

TMV TEAMVIEWER has the potential for a 50% upsideTMV Teamviewer had its good momentum in 2020 and thereafter fell of from the traders radars. In the meantime the company has proved that it should not be mixed up as another "Zoom" company as it targets institutional accounts through its AR platform.
The recovery should be underway and a 23 eur PT could be realistic.
Watch to stop if the stock drops below 11 eur.
