High-Risk Long on Sentinel One Inc. (Ticker S)
NYSE:S
4h - 1D timeframe
Technicals:
- strong recovery to bottom zone of 3-Y horizontal channel
- support on 14.45 activated after stop-loss orders collection
- 14.59 - 14.53 zone gap can be still closed
- 2 bars close above 15.45 opens upswing to 19.00 - 20.00 resistance zone
- on the way to 19 the 200-day moving average at around 16.80 novadays may challenge the price movement
- scenario invalidated of no 2 bar close above ressistance on 15.45
- close below 14.20 opens short to 12.76, which due to long-term bearish trend is quite realistic
Fundamentals:
- company specializes in cloud cybersecurity and data protection, ensuring demand for its product suite
- there are concerns regarding the company's profitability, despite the corrective growth, as the company is still unprofitable
- due to the company's youth, risks are high, but so is the growth potential
- last but not least - a key driver for recent upswing: Citron Research issued a bullish report on Jan 28, calling S a "coiled spring" and citing its AI security edge
Conclusion:
- In the short-to-medium term, while following risk management, I place a speculative bet on a technical rebound
- breaking $15.45 could trigger a short squeeze toward $17.00, in best case $19.00
- failure to break $15.45 suggests a return to the $13.46 lows or your $12.76 target
# - - - - -
⚠️ Signal - (HIGH RISK) Buy ⬆️
✅ Entry Point Term - 15.11
# - - - - -
🛑 SL - 14.12
🤑 TP 1 at 16.75 - 17.00 if squeeze, TP All - 19.06,
⚙️ Risk/Reward - 1 : 4.1 👌
⌛️ Timeframe - 5 months 🗓
# - - - - -
Good Luck! ☺️
DISCLAIMER: Not financial advice. Everyone must make trading decisions at their own risk, guided only by their own criteria and strategy for opening or not opening a trade.
Risk

Is Salesforce Now a Defense Contractor?Salesforce has reached a defining inflection point that fundamentally transforms its corporate identity. The company, historically known as a commercial software provider, has secured a massive $5.64 billion contract with the U.S. Army extending through 2035. For the first time, the tech giant is positioning itself as a "defense prime contractor" and embracing the Trump administration's provocative rebranding of the Department of Defense as the "Department of War." This move not only stabilizes the company's revenue stream with a long-term, firm-fixed-price agreement but also places it at the center of U.S.-China geopolitical competition and brings it closer to the traditional defense industrial base.
The market has responded with enthusiasm - analysts have raised price targets above $320 per share, and investors view the contract as a bond-like guarantee of stable cash flow. The company's stock surged to the $257 range in early 2026, reflecting Wall Street's revaluation of Salesforce as critical national infrastructure rather than as a volatile SaaS business. However, the pivot carries significant risks. It jeopardizes Salesforce's operations in China, where it has operated for years through local partnerships, and raises serious questions about data sovereignty in Europe, particularly given the U.S. CLOUD Act. With 20% of revenues coming from Europe, Salesforce is entering direct conflict with the digital sovereignty demands of leaders like Macron and Scholz.
The technological dimension is equally compelling: Salesforce is aggressively investing in Agentforce, its autonomous AI agent platform, competing directly with Palantir for dominance in the government software market. The technology promises radical automation of military logistics and personnel management, leveraging Salesforce's enormous advantage in commercial customer data across millions of users. CEO Marc Benioff has emphasized their pricing advantage, undercutting competitors by amortizing R&D costs across their massive commercial base. Yet questions remain: can this pivot deliver long-term returns, or will the company find itself caught in trade wars, sanctions, and regulatory restrictions that undermine future profitability? The transformation from SaaS giant to defense contractor represents either a brilliant strategic repositioning or a dangerous entanglement with geopolitical risk.

Silver have more room to surgeSilver briefly surged to a new record high, exceeding 116 USD/ounce, before consolidating around 110 USD/ounce, propelled by escalating geopolitical tensions initiated by the US. Markets anticipate a "polycrisis" as the new paradigm, disrupting the post-World War II global order. Consequently, investors are diversifying away from Gold into other precious metals, such as Silver and Palladium.
The Gold/Silver ratio collapsed from a peak of 110 to 46, trending toward the 2011 low of 32. Persistent geopolitical risks could drive prices to the 160–200 USD/ounce range. Silver maintains a high correlation with Gold but exhibits a higher standard deviation, which may amplify price gains—particularly as supply deficits loom due to surging demand from the energy transition and AI infrastructure.
Technically, XAGUSD retreated to test the EMA21 before rebounding above both expanding EMAs, signaling a continued uptrend.
If price surpasses the recent swing high, XAGUSD could target the 227.2% Fibonacci extension at 131.
Conversely, failure to sustain levels above the EMA21 may trigger a retest of the lower trendline boundary.
By Van Ha Trinh - Financial Market Strategist at Exness

Is NVIDIA’s AI Boom Hitting a Wall?NVIDIA is the engine behind the global AI boom. From data centers to gaming and high-performance computing, its chips power the most advanced technology on the planet. Over the last two years, NVDA became the market’s biggest winner. Now, it has suddenly slowed down, and investors are asking why.
The stock is down about 12 percent from its all-time high of 212 dollars and closed at 186.23 dollars on January 27, 2026. Even after the pullback, NVIDIA is valued at an eye-watering 4.53 trillion dollars and trades at a P/E ratio of 46. That valuation assumes near-perfect execution, and the market is no longer willing to blindly chase it. After one of the strongest rallies in tech history, NVDA has spent months moving sideways. On the chart, the price is trapped inside a symmetrical triangle, a classic sign of indecision. It is not breaking higher, and it is not breaking lower. Everyone is waiting for something to give.
The biggest reason for this pause is geopolitical, not technical. NVIDIA appeared to secure a massive win with reported orders for more than two million H200 chips from Chinese tech companies, potentially worth around 54 billion dollars. At roughly 27,000 dollars per chip, this deal could have pushed the stock into a new valuation zone. But reality hit fast. Chinese customs blocked H200 shipments just days after the U.S. approved exports under a 25 percent tariff. According to industry sources, the message from Beijing was severe enough to feel like a temporary ban. NVIDIA’s suppliers have already slowed production, and that massive opportunity could disappear almost overnight.
Even if China eventually allows the chips, the math is no longer attractive. A 25 percent tariff means NVIDIA would lose a large chunk of revenue to the U.S. government. Higher prices also make Chinese buyers less enthusiastic, especially as Beijing pushes companies toward domestic alternatives from players like Huawei. This situation risks accelerating China’s long-term shift away from U.S. technology, threatening a market worth tens of billions of dollars every year.
Despite these risks, Wall Street remains optimistic. Analysts still rate NVDA a Strong Buy, with an average price target near 259 dollars, implying roughly 36 percent upside. Some firms, including Evercore ISI, see far higher levels if execution stays flawless. Confidence was also reinforced after CEO Jensen Huang called AI the largest infrastructure buildout in human history and backed that view with a 2 billion dollar investment in CoreWeave to expand AI data centers.
The outlook is clear but tense. NVIDIA is not broken. It is dominant, expensive, and stuck between massive opportunity and serious geopolitical risk. The long consolidation suggests the next move could be powerful. Whether it breaks higher or resets lower will depend less on charts and more on politics, pricing, and how much perfection the market is still willing to pay for.

Gold vs Bitcoin: Safety or Asymmetry?Every few years, the same question comes back.
Gold or Bitcoin?
But the chart above tells a more interesting story.
Not about competition... but about role.
Gold: The Anchor
Gold doesn’t chase excitement.
It absorbs fear.
Through uncertainty, inflation scares, and macro stress, Gold keeps doing what it has done for centuries:
protect purchasing power.
Its moves are steadier.
Its drawdowns are shallower.
Its purpose is stability.
Gold isn’t here to impress you.
It’s here to hold the line.
Bitcoin: The Asymmetry
Bitcoin is different.
It doesn’t move quietly... it moves decisively.
Long consolidations.
Deep corrections.
Then explosive expansions.
Bitcoin rewards patience, not comfort.
It offers upside, not calm.
It’s volatile by design; and that volatility is the cost of exponential potential.
Two Assets. Two Jobs.
Look at the cycles.
Gold rises when confidence fades.
Bitcoin accelerates when confidence returns.
One absorbs shock.
The other compounds growth.
This is why the real conversation isn’t which one is better.
It’s why they belong together.
The Real Strategy
This isn’t about timing tops.
Or picking winners.
It’s about:
DCA
Long-term holding
Letting time do the heavy lifting
"Gold for safety.
Bitcoin for upside."
"In times of fear, Gold is what you go to.
Bitcoin is what you go through."
And over time, that combination doesn’t just protect capital, it grows it.
Question for you:
If you zoom out 10 years from now, which matters more: picking one, or holding both?
⚠️ Disclaimer: This is not financial advice. Always do your own research and manage risk properly.
📚 Stick to your trading plan regarding entries, risk, and management.
Good luck! 🍀
All Strategies Are Good; If Managed Properly!
~ Richard Nasr

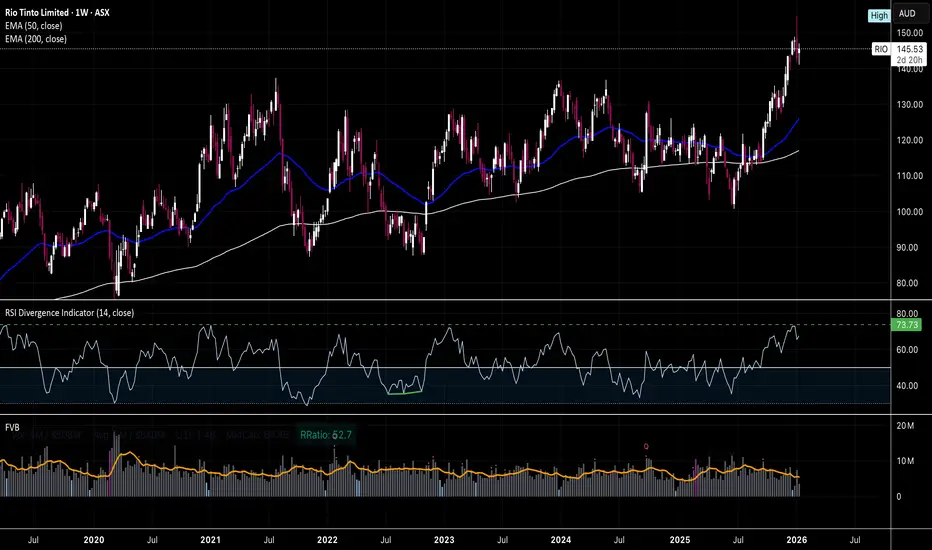
Here is an Aussie signal of China's reemergence I recently wrote about Sky Metals ASX and what the chart was telling me. I said, "multi 10X gains, its a smaller miner, now RIO climbs at ATH''s and the tapping ema tells me everything I need to know.
Why brokers maybe don't like how I interpret charts.
I said AUDUSD is also in a massive push higher and I wrote on trading view about how I was seeing China on excessive need for resources in the next few years and how a push to 0.78 could occur with bullish patterns on higher time frames.
Anyways, Sky Metal's should be there from me I publicised in the TV ideas about 2 or 3 weeks ago and my case for AUDUSD sitting on a bullish monthly pattern. MusicalNightz.
Before I made the claim for AUDUSD to flip risk assets including Bitcoin (usually breaks out first as a market indicator and would be the beneficiary when and if the EUR takes the upper hand on a pullback from DXY (EURUSD is 80% of the index) and naturally moving in tandem other Crypto's.
much higher (BTCUSD usually moves first), I made the case for EURUSD breaking out above 1.1920, I said a fake breakout of the dollar index could occur first and that the dollar won't continue higher like its run on President Trumps vote back into power.
What is a Sortino Ratio?The sortino ratio is a way of gauging the performance of a portfolio relative to the amount of risk taken. The sortino ratio is a variation of the sharpe ratio, but only penalises the downside volatility, not total volatility (like a sharpe does).
To properly understand the sortino ratio we first need to understand the sharpe ratio.
📌 What is the Sharpe Ratio?
The Sharpe ratio is a performance metric that measures how much excess return an investment generates for each unit of total risk taken.
📍 The sharpe ratio looks like this: (AvgReturn - MAR) / StDev
It is calculated by subtracting the MAR (Minimum acceptable return) which is usually 0 or a risk free rate (A percent you can make without risking anything (usually a government bond)) from the portfolio’s average return and dividing the result by the portfolio’s standard deviation, which represents volatility and fluctuations of profit.
A higher Sharpe ratio indicates that returns are being achieved more efficiently relative to the amount of risk, while a lower ratio suggests that returns may be driven more by volatility than by any skill or edge.
📌 What is the Sortino Ratio?
The Sortino ratio is very similar but refines the sharpe by focusing exclusively on downside risk rather than total volatility. Instead of using standard deviation, it replaces it with downside deviation, which measures only the volatility of returns that fall below the minimum acceptable return. By doing so, the Sortino ratio penalizes harmful volatility while ignoring upside fluctuations, making it particularly useful for evaluating strategies that exhibit asymmetric return profiles or frequent positive volatility.
📍 What is downside deviation?
Downside deviation measures how much returns fall below your minimum acceptable return. You calculate it by looking only at the periods where performance is worse than your target, squaring those shortfalls, averaging them, and then taking the square root. Any return above the target is ignored, because it does not represent risk from a downside perspective.
📌 The Sharpe ratio is used more to evaluate low-volatility investment portfolios, and the Sortino variation is used more to evaluate high-volatility portfolios.
Overall, the Sharpe ratio measures risk-adjusted returns using total volatility, while the Sortino ratio focuses only on downside risk, ignoring upside swings. Together, they provide complementary insights, with Sharpe giving a broad view of efficiency and Sortino highlighting potential losses relative to a target return.

How Intermarket Signals Could Help to Avoid Major CrashesThree Crashes, One Pattern
I've been testing whether intermarket analysis can help avoid major drawdowns when selling weekly puts. Here's what the data shows across three very different market crashes:
COVID Crash (Feb-Mar 2020)
Drop: -914.75 points (-22.87%)
Duration: 29 bars, 41 days
Signal: BEAR fired in mid-February, BEFORE the crash
The macro composite dropped sharply as bonds rallied (flight to safety), credit weakened, and VIX exploded. The signal went red weeks before the worst of the selling.
2022 Bear Market (Jan-Jul 2022)
Drop: -837.25 points (-15.25%)
Duration: 137 bars, 199 days
Signal: BEAR fired in early January, stayed red through most of the decline
This was a slow grind lower as the Fed tightened. The indicator stayed in BEAR mode for most of the year, keeping me flat during the worst of it. Notice how the red background covers almost the entire decline.
April 2025 Tariff Crash
Drop: -770.25 points (-13.35%)
Duration: 6 bars, 10 days
Signal: BEAR fired in late March, BEFORE the drop
The fastest of the three crashes - just 10 days. But the macro signals still deteriorated first. Credit (JNK) weakened, volatility spiked, and the composite crossed below its signal line before price collapsed.
The Pattern
Three different causes (pandemic, Fed tightening, tariffs). Three different timeframes (41 days, 199 days, 10 days). But in each case, the macro signals deteriorated BEFORE equities fell hard.
The Core Idea
Markets don't move in isolation. Before major equity drawdowns, stress often appears first in:
TLT (Bonds) - Flight to safety begins
JNK (Credit) - High-yield weakens as credit risk gets priced
DXY (Dollar) - Strengthens as risk-off flows accelerate
VIX (Volatility) - Fear builds in the options market
The indicator normalizes each market using z-scores (standard deviations from 1-year average), then combines them:
Macro Score = (TLT + JNK) - (DXY + VIX)
When this composite trends down and crosses its signal line, conditions favor caution. When it trends up and crosses above, conditions favor risk.
Why This Matters for Put Sellers
Selling weekly puts has attractive math: 90%+ win rate, consistent premium. But the losses when they come are brutal (600% stop loss). One bad week can erase months of gains.
The question isn't IF a crash will happen. It's whether you're holding short puts when it does.
My 5-year backtest on ES 7DTE puts - using TastyTrades backtester:
Without Macro Filter:
357 trades | 96.1% win rate
Total P/L: +$63,492
Max Drawdown: 10.30%
Profit Factor: 2.90
With Macro Filter:
200 trades | 96.0% win rate
Total P/L: +$33,636
Max Drawdown: 2.91%
Profit Factor: 3.51
Key finding: 72% reduction in maximum drawdown.
Yes, fewer trades means less total profit. But avoiding the tail risk changes everything about position sizing and sleep quality.
Current Status: A Challenging Environment
Right now (January 2026), we're in a consolidation range. The macro score is hovering near flat, and with the 7-day EMA setting, signals are flipping almost weekly.
This is exactly the environment where the indicator struggles:
Range-bound price action
No clear macro trend
Frequent signal changes (whipsaws)
Difficult to follow systematically
I'm being transparent about this because it's real. The indicator seems to work well for catching major regime shifts but generates noise during consolidation phases.
Work in Progress
This is not a finished system. It's a research framework I'm actively developing. Areas I'm exploring:
Signal method variations - The indicator offers 7 different methods (EMA Cross, Slope, Momentum, Multi-Confirm, etc.). Some may handle consolidation better.
Longer smoothing periods - The current 7-day EMA is responsive but whipsaw-prone. Testing longer periods for range markets.
Regime detection - Adding logic to identify trending vs ranging environments and adjust sensitivity.
Combining with price filters - Using EMA20 or other price-based filters as secondary confirmation.
The goal is to reduce false signals during consolidation while maintaining the ability to catch major turns.
What It Catches vs. What It Doesn't
Works well for:
Major regime shifts with clear macro deterioration
Gradual credit/bond stress building over days or weeks
Events like COVID, 2022 bear market, April 2025 tariff crash
Struggles with:
Range-bound, choppy markets (like now)
Overnight gaps from surprise news
Idiosyncratic moves unrelated to macro
Short-term whipsaws in flat macro environments
How I'm Using It (Current Approach)
1. Check the indicator before opening new put positions
2. Clear RISK-ON (green, rising): Full position size
3. Clear RISK-OFF (red, falling): No new positions or reduce exposition
The "flat/choppy" category is new - I'm adding nuance rather than treating it as binary. When macro is unclear, I'd rather miss premium than get caught in a whipsaw.
The Honest Tradeoff
What you give up:
Fewer trades = less total premium
False signals in consolidation
Missed rallies when flat
Requires discipline to follow
What you gain:
Avoided COVID crash: -22.87%
Avoided 2022 bear: -15.25%
Avoided April 2025: -13.35%
Significantly better risk-adjusted returns
Ability to size up when conditions are clearly favorable
For me, avoiding those three crashes was worth the whipsaws in between. Your risk tolerance may differ.
Try It Yourself
I've published the indicator with multiple signal methods so you can test what works for your approach:
EMA Cross (what I use) - Classic crossover
Slope - Simple trend direction
Momentum - Rate of change threshold
Multi-Confirm - Requires 4+ methods to agree (more conservative)
Indicator in related ideas below.
What's Next
I'll continue refining this approach and will share updates as I find improvements. Specific things I'm testing:
Longer EMA periods for the signal line
Adding a "flat zone" where macro is inconclusive
Combining macro with price structure (above/below key MAs)
Different parameter sets for trending vs ranging markets
If you have ideas or are working on something similar, drop a comment. This is open research, not a black box.
Final Thought
Three crashes. Three different causes. Three times the macro signals warned before price collapsed.
Is it perfect? No - the current consolidation proves that. But when the big moves come, they tend to show up in credit, bonds, and volatility first.
I'd rather deal with some whipsaws during flat markets than be holding short puts when the next -15% hits.
---
What macro signals do you watch? How do you handle range-bound environments? Let me know in the comments.

How to audit your own trades like a risk manager would Auditing your trades is not about replaying charts to confirm whether you were right or wrong. A risk manager audits to protect capital durability, reduce mistake frequency, and identify exposures created by process, not emotion. When you adopt this mindset, performance leaks become easy to detect and easier to correct.
A professional audit begins with environment classification. Every trade is labeled by the market phase it was executed in. Volatility is assessed as expanding or compressing. Liquidity incentives are identified before execution, not after it. For example, BTCUSDT and SOLUSDT produce wider candle ranges during expansion and thinner order books when liquidity drains. These are high-invalidation conditions. If you increased size here, you paid an execution tax without a volatility reason. A risk manager never scales into widening ranges. They scale into tightening ranges.
The second step is measuring invalidation distance. Risk officers place stops beyond structure, not arbitrary percentages. A stop below a random 1% or 2% rule means nothing if the structure required 3.5% distance to invalidate the narrative. Your stop must sit beyond the point where the market proves the opposite story. If your invalidation distance widens while volatility expands, that is alignment. If it widens while volatility contracts, that is a process breach.
Next comes execution quality scoring. Professionals deconstruct execution into sequence components: liquidity sweep first, micro-structure break second, displacement third, retest respected fourth, impulse continuation fifth. A trade that triggered on the first touch of a level without displacement is not a good fill. It is the fill the market used for liquidity. Score execution quality based on whether the sequence completed before entry, not whether the P&L was positive.
The fourth layer is correlation risk. Risk auditors measure how many positions were open simultaneously on the same asset or narrative theme. One trade rarely kills a small account. Correlated trades during the same thesis do. Mistake correlation compounds drawdown faster than strategy flaws ever could. Limit correlation by design, not hindsight.
Finally, audit outcomes against process wins. A trade that worked without a reason is not audit approval. A trade that worked because it followed a reasoned sequence is. When you measure behavior instead of candles, you gain intervention points. Intervention points protect capital. Reflection points identify capital already lost.
Small accounts scale when traders audit like capital protection matters more than capturing the entire move. Your audit should produce fewer open questions and more closed rules. The goal is not to defend the trade. The goal is to defend the account.

RSI Is Not a SignalRSI is one of the most widely used tools in trading, yet it is also one of the most misunderstood. Many traders approach it as a switch. When the line reaches a certain level, they expect price to react. When it does not, frustration follows. The issue is not the indicator itself, but the expectations placed on it.
RSI reflects how aggressively price has been moving over a recent period. It gives insight into pressure, participation, and pacing. What it does not do is decide when price should reverse or continue. Markets can remain stretched far longer than most traders anticipate, especially during strong trends. When that happens, RSI staying elevated or depressed is a sign of persistence rather than exhaustion.
Context changes everything. In a clearly trending market, RSI often settles into a higher or lower band and fluctuates within it. Pullbacks that look extreme on the oscillator are often normal pauses in price rather than warnings of a reversal. Traders who react to those readings without considering structure often find themselves trading against the dominant flow.
Range-bound conditions tell a different story. When price rotates between defined highs and lows, momentum naturally fades near the edges. In those environments, RSI extremes tend to align more closely with short-term turning points. The same indicator behaves differently because the market itself is behaving differently.
Another source of confusion comes from fixed thresholds. Levels such as 30 and 70 are treated as universal rules, even though they were never meant to apply across all instruments and conditions. Some markets trend with RSI rarely dropping below 40. Others rotate for weeks without ever reaching classical extremes. Blindly applying static levels removes nuance from decision-making.
RSI becomes useful when it is read as part of a broader process. Structure, liquidity, and location should come first. Momentum then helps assess whether price behavior supports the idea or raises caution. When used this way, RSI adds clarity instead of pressure.
Traders who struggle with RSI are often searching for certainty. RSI does not provide certainty. It provides information. Those who learn to interpret that information within market context stop forcing trades and start aligning with what price is actually doing.

The one thing that destroys tradersEmotional inflation is a measurable drag on trading performance, particularly in crypto where momentum cycles are short, liquidity is thin, and feedback loops are fast. After a trader strings together strong wins, confidence often expands faster than process. The trader begins to treat recent outcomes as a new baseline for risk. This leads to size increases, earlier entries, or skipping structural confirmation because the mind assumes the market will continue to cooperate. It feels logical in the moment, but it is not rooted in market behavior. The market eventually tests this inflated confidence through liquidity sweeps, compressed volatility, or reclaiming defensive structure. The result is capital giveback, distorted expectations, and emotional volatility that exceeds price volatility.
The cost of emotional inflation is not that it creates bad trades. The cost is that it removes the conditions that made your best trades possible. When confidence accelerates exposure before the market proves continuation through structure and liquidity, you are no longer trading opportunity. You are trading assumption. Crypto punishes assumption faster than most markets because liquidity leaves quickly, bid depth changes abruptly, and breakout traders provide easy fuel for counter moves.
Inflation becomes visible in three repeatable behaviors: increasing size during expansion phases instead of compression phases, entering at the first touch of a level instead of after a structural transition, and treating recent wins as proof of future market cooperation. These behaviors are not personality flaws. They are pattern loops that can be corrected with objective rules and sequencing.
To counter emotional inflation, you need guardrails that do not depend on feelings. The first guardrail is a fixed sizing model tied to volatility conditions, not P&L conditions. Size should increase only when volatility tightens, liquidity aligns cleanly, and structure confirms control. In expansion phases, size must stay anchored to predefined limits because invalidation distance widens when liquidity thins. This keeps risk mathematically stable while confidence psychologically fluctuates.
The second guardrail is daily narrative rebuilding. Bias is constructed from the higher timeframe story, not the previous trade’s outcome. If the weekly and daily structure have not changed, your job is to wait for liquidity incentives and micro-structural permission before expanding exposure. A trader who rebuilds bias every session stays psychologically neutral when the market is structurally neutral.
The third guardrail is retest discipline. A retest is not a candle. It is acceptance. The retest validates participation, reduces invalidation distance, and reveals whether the market internalized the structural break or sweep. Entering before the retest is entering during the liquidity hunt. Entering after the retest is entering after participation is proven. This is where professionals position, not because they are late, but because they are validated. Retests compress emotional cycles because they remove the need to hope a level will hold.
The fourth guardrail is execution quality scoring.
Track trades by sequence: liquidity taken first, structure broken second, displacement confirmed third, retest respected fourth. Grade your execution on fill precision, conditional sizing, and narrative alignment. This shifts confidence from results to behavior, which compounds careers instead of compressing them.
A journal becomes a solution only when it measures variables that lead to intervention, not reflection. Measure session volatility, invalidation distance, average R:R delivered, liquidity incentives present, and whether the entry occurred inside premium or discount relative to equilibrium. This reveals inflation risks before they hit your equity curve.
Emotional inflation loses its power when you treat streaks as feedback, not permission. The best funded crypto traders do not compound because they avoid risk. They compound because they only expand risk when the market contracts volatility, aligns liquidity, and confirms structure. Confidence should drive preparation, not replace it.
Calibration compounds. Inflation decays. Careers are built by traders who stay calibrated longer than they stay confident temporarily.

Can Mobileye Turn a 19M-Unit Win Into Market Dominance?Mobileye Global Inc. has secured a transformative 19-million-unit pipeline through two major deals: 9 million EyeQ6H chips for a top-10 US automaker's next-generation ADAS and a previous Volkswagen commitment. This achievement comes during a challenging period marked by a 50% stock decline in 2025, yet it signals a fundamental shift in the company's business model. The transition from selling basic safety chips at $40–$50 per unit to offering a comprehensive "Surround ADAS" platform at $150–$200 per vehicle represents a tripling of revenue potential, establishing Mobileye as a software-centric platform provider rather than merely a component supplier.
The technical foundation of this strategy rests on the EyeQ6H chip, a 7nm processor capable of handling data from 11 sensors, while deliberately excluding the more expensive LiDAR technology. This cost-conscious design enables hands-free highway driving up to 130 km/h for mass-market vehicles, consolidating multiple functions into a single ECU and simplifying automaker production. The company's proprietary Road Experience Management (REM™) technology, which crowdsources data from millions of vehicles to create high-definition maps, provides a substantial intellectual property moat against competitors like Tesla and Nvidia. Over-the-air update capabilities ensure the platform remains current throughout a vehicle's lifecycle.
However, Mobileye faces significant headwinds that temper investor enthusiasm. With 3,000 of 4,300 employees based in Israel, geopolitical uncertainty affects valuation and operations, prompting a recent 5% workforce reduction of 200 employees. Competition from Chinese rivals like Huawei and Xpeng, who are developing in-house solutions, represents an existential threat to market share. The company characterizes 2025 as a "transition year" plagued by inventory challenges, but the massive order pipeline and improved revenue model position 2026 as potentially pivotal. Success hinges on flawless execution of product launches and the ability to maintain technological leadership while navigating both geopolitical tensions and intensifying competition in the autonomous driving space.

Risk Management: The Art of Long-Term Survival
Risk Management
Imagine a hero standing at a crossroads with three paths.
If he takes the road to the right, he will face a serious challenge with a difficulty level of 100. At the end of this path, however, he will be rewarded with five gold bars.
The middle road leads to ten gold bars, but the hero will encounter not one, but three challenges along the way. Each of them is no less difficult than the one on the right-hand road. Taken together, their total difficulty amounts to 300.
The left road involves a less demanding challenge with a difficulty of 60, but the reward is modest — only one gold bar.
Which path would you choose if you were in the hero’s place?
Now suppose the hero chose a balanced level of risk, but along the way he was bitten by a snake and never even reached the challenge.
This is exactly what risk-taking in financial markets looks like.
In the real world, risk is first and foremost the probability of loss.
Risk is an inevitable consequence of the fact that the future is unknown. At any given moment, there are far more possible outcomes than those that ultimately materialize. It is precisely this gap — between the range of potential outcomes and the single realized result — that gives rise to risk. The future cannot be viewed as a predetermined or predictable script; it is a spectrum of possibilities that includes both favorable and unfavorable outcomes.
An investor may estimate the range of the most likely scenarios and base their expectations of the future on them. However, even the most probable event offers no guarantee that it will actually occur.
Risk comes in many forms, and the probability of loss is only one of them. Another important type is the risk of missed opportunities — the risk of taking too little risk. Staying on the sidelines can cause an investor to miss a recovery or a growth phase and ultimately drop out of the investment process altogether.
Particularly destructive is the risk of selling at the bottom. In this case, the investor not only locks in losses but also forfeits the chance to participate in the subsequent recovery, which often leads to a permanent exit from the market.
There are also risks associated with rare but catastrophic events. These risks may remain hidden for a long time, creating the illusion that a strategy is safe — until they suddenly materialize with severe consequences, as in the example of the hero and the snake.
Risk has a contradictory and deceptive nature. It depends not only on the asset or the market itself, but also on the behavior of market participants. When people feel safe and confident, they tend to act less cautiously, and actual risk increases.
Conversely, when risk is recognized and perceived as high, behavior becomes more restrained, and risk may decrease.
Paradoxically, rising prices often increase risk, while falling prices can make an asset safer — even though most people intuitively perceive the opposite.
Risk management is not a one-time action or a reaction to a crisis; it is a continuous process.
Since it is impossible to know in advance when adverse events will occur, risk control must be present at all times, not only during periods of obvious threat.
The essence of a sound approach is not the complete avoidance of risk, but its conscious acceptance, analysis, and limitation. An investor takes on risks they understand, can diversify, and are adequately compensated for.
Ultimately, the investor’s task is to build an asymmetric outcome profile: to participate in upside when events unfold favorably, and to lose less when negative scenarios materialize.
Such asymmetry is a hallmark of true skill and reflects a deep understanding of probability distributions, hidden risks, and acceptable loss limits.
How to Form Your Own Risk Assessment in a Specific Situation
To address this question, it is useful to turn to the work of Ed Seykota. One of his core ideas can be summarized as follows:
Risk is not the size of a potential loss in itself, but the probability of that loss occurring given the current market structure.
An important implication follows from this:
The profit-to-loss ratio (risk/reward) is not an independent criterion of trade quality.
The risk of a specific trade is determined by two key factors:
the market environment,
the distribution of profits and losses.
However, the decisive element is not the absolute size of the potential profit, but the probability of achieving it, as defined by the market context
Consider a situation where the potential profit is relatively small compared to the possible loss. From a formal risk/reward perspective, such a trade appears unattractive. But if the market conditions suggest that the probability of a positive outcome is high — for example, around 90% — the risk no longer appears unreasonable. In this case, the trade is justified not by the magnitude of the payoff, but by the stability of the probabilistic edge.
An individual trade, taken in isolation, is meaningless. What matters is how similar situations play out over a large sample size.
Even with a very high probability of success, risk becomes unjustified if:
a negative scenario is capable of destroying a significant portion of the capital;
or a single rare loss outweighs the cumulative result of many successful trades.
This is why, within any robust system, probability and loss control must always go hand in hand. High probability without loss limitation is not trading — it is gambling.
Unjustified Risk
Suppose a trader manages to earn 5% on their account over the course of a month , while the benchmark — for example, the Nasdaq — delivers a return of 8% over the same period. What does this imply?
To answer this, we turn to the concept of alpha .
Alpha is a metric that measures how much a strategy’s or trader’s performance deviates from the benchmark return, after accounting for the level of market risk taken.
If a trader engages in active intraday trading — assuming operational, market, behavioral, and tail risks — yet achieves a return lower than that of the benchmark, this indicates that risk was taken without adequate compensation . The critical issue is not the mere presence of risk, but the relationship between risk and outcome.
By its nature, intraday trading involves high engagement, frequent decision-making, exposure to market noise, commissions, slippage, and psychological pressure. All of these factors increase the strategy’s total risk profile. If, despite this, the final result underperforms a passive benchmark, alpha becomes negative. This means that each unit of risk taken was not only unrewarded, but actually worsened the overall financial outcome.
In such a case, alpha does more than simply indicate “underperformance relative to the market.” It highlights the inefficiency of the risk taken . The trader is effectively performing a more complex and uncertain task while achieving a result that could have been matched — or exceeded — through passive exposure, without active trading and its associated risks.
This is precisely what constitutes unjustified risk: risk that does not increase expected returns and does not improve the distribution of outcomes.
Thus, intraday trading with returns below the benchmark is an example of risk-taking without economic rationale. Alpha here serves not as a goal, but as a diagnostic tool. If alpha is negative, it indicates that the trading risk is not merely unjustified — it is value-destructive relative to a passive alternative.
Integration into Trading
1. Market Context Comes Before the Trade
In real trading, the first object of analysis is not the entry, not the stop, and not the take-profit — it is the state of the market itself.
The key question you must answer is:
Is there a recurring market situation here that historically shifts the probability in my favor?
If the situation is not repeatable and lacks a clear internal logic, the trade is not considered at all — regardless of how attractive the risk/reward ratio may look.
2. Probability Matters More Than Potential Profit
Once the situation has been identified, the focus shifts not to profit, but to the probability of the scenario playing out.
In practical terms, this means:
You must understand why the market is more likely to continue the move rather than reverse.
The reason for entry should explain why continuation is more probable, based on the logic of market participants’ behavior — not merely be the result of a formal signal.
Even if the potential profit is relatively small, a trade may still be justified if:
The probability of success is consistently above random;
The situation is reproducible over a large sample size.
3. Loss Is Defined in Advance — and Rigidly
A loss is not something to “figure out along the way.”
It is defined before entering the trade and is not revised in the hope that the market will “come back.”
The core integration rule is simple:
No single loss should be capable of damaging the integrity of the system
This implies:
Strictly limited risk per trade;
No scenarios in which one unfavorable outcome wipes out the results of many successful trades.
4. Serial Thinking Instead of Evaluating Individual Trades
True integration happens at the mental level. You stop evaluating trades in terms of “profit or loss.”
Each trade is viewed as:
One element within a series;
One roll of the dice with a known probability bias.
In practice, this leads to:
No emotional reaction to a single loss;
No euphoria from a single winning trade.
5. Trade Selection Instead of Increased Activity
Integrating this approach almost always reduces the number of trades.
You enter the market only when:
The market provides a readable context;
The scenario has a statistical edge;
The risk is clearly defined in advance.
If the market does not offer these conditions, you do not “look for trades” — you wait.
6. Evaluating Results by Process, Not by Money
In real trading, success is not measured by daily PnL, but by:
Adherence to the logic of situation selection;
Discipline in loss limitation;
Consistency of execution.
A losing day can be a perfect day if all decisions were made within the framework of the system.
Risk Management Framework in Investing
Risk should be distributed not only across trading instruments, but also across sources of returns.
A portfolio composed of assets dependent on a single growth scenario creates an illusion of diversification while remaining structurally fragile. True diversification implies exposure to different sectors, asset classes, and underlying economic processes.
An important element of risk management is time diversification. Entering positions in stages reduces the risk of poor timing and mitigates the impact of short-term market fluctuations. Investing the full amount at a single price point turns an investment into a timing bet rather than a conviction in the underlying idea.
Liquidity risk must also be taken into account. An asset that cannot be sold without a significant discount carries hidden danger. Liquidity matters not during calm periods, but during times of stress, when exiting a position may become critically important.
Diversification also means being willing to keep part of the capital out of the market. Holding free liquidity reduces decision-making pressure and allows the investor to respond to opportunities that arise during periods of panic. Full capital deployment increases the risk of forced actions.
Risk reduction becomes necessary when uncertainty rises. Increasing correlations between assets, changes in macroeconomic conditions, growing leverage, or excessive market optimism are signals to reassess portfolio structure. In such periods, capital preservation takes precedence over returns.
An increase in investment risk is acceptable only when there is a sufficient margin of safety. Expanding exposure to higher-risk assets is justified when capital is growing, the investment horizon is long, and acceptable losses are clearly defined. An investor does not increase risk in an attempt to “catch up with the market.”
Portfolio structure should reflect not only the investor’s expectations, but also their ability to withstand unfavorable periods. There is no universal allocation; however, practical guidelines help keep risk within manageable limits.
Portfolio Structure Guidelines
Low-risk allocation serves as the foundation and stabilizer of the portfolio.
Typically, it represents 50–70% of total capital . This segment includes highly liquid assets with relatively predictable behavior. Its purpose is not to maximize returns, but to preserve capital and reduce overall portfolio volatility.
Moderate-risk allocation usually accounts for 20–40% of the portfolio. These are assets with growth potential but without critical dependence on a single scenario. They generate the core long-term returns and absorb part of the market’s fluctuations.
High-risk allocation is limited to 5–15% of capital. This segment includes assets with high volatility, asymmetric payoff potential, and an elevated probability of deep drawdowns. Losses in this zone must never threaten the integrity of the entire portfolio. If an asset can go to zero, its position size must be small enough for that outcome to be non-critical.
Rebalancing and Capital Discipline
Rebalancing is a mandatory component of risk management. As high-risk assets appreciate, their weight increases automatically, and part of the gains should be reallocated toward more stable segments. During market declines, the portfolio structure is reviewed based on changing conditions rather than emotional reactions.
Increasing exposure to high-risk assets is appropriate only when capital is growing, the investment horizon is long, and potential losses are clearly understood. Reducing exposure becomes necessary during periods of heightened uncertainty, macroeconomic shifts, or declining personal risk tolerance.
A portion of the portfolio should be held in cash. Cash is not inactivity or a missed opportunity — it is an asset that serves both defensive and strategic functions.
Typically, cash represents 10–30% of the portfolio , depending on market conditions and uncertainty. During stable growth phases, it may sit near the lower end of this range. In periods of elevated volatility, uncertainty, or after prolonged market rallies, increasing the cash allocation becomes prudent.
A cash position reduces overall portfolio risk and alleviates psychological pressure.
Free liquidity allows decisions to be made calmly, without the need to sell assets under unfavorable conditions.
The key principle lies not in finding the perfect percentage, but in maintaining the chosen structure . Discipline in risk allocation is more important than precision in initial calculations.
A Risk Management Framework in Trading
Risk management in trading does not begin with entering a trade; it begins with accepting the fact that any trade can end in a loss. A trader who is not internally aligned with this reality will inevitably violate their own rules. Accepting losses as a legitimate outcome is a fundamental condition for survival in the market.
Position sizing is more important than the entry point. Even a strong idea loses its value if its size is disproportionate to potential adverse scenarios. A trader is not required to predict direction perfectly, but they are obligated to control the consequences of being wrong.
Every trade must be “paid for” in advance. The potential loss must be known and psychologically accepted before entry. For one trader, an acceptable risk may be one percent of capital; for another, five percent. These figures are not universal truths — they reflect individual tolerance for uncertainty, trading style, and time horizon. What matters is not the number itself, but strict adherence to it.
For a beginner trader, an acceptable risk per trade is typically a loss of no more than one to two percent of the account. This level of risk allows the trader to endure a series of losing trades without causing critical damage to capital and, just as importantly, to psychological stability. Under these conditions, the risk-to-reward ratio should be no less than 1:2 and, in more favorable setups, should approach 1:3. This means that the potential profit of a trade should be at least twice, and preferably three times, greater than the potential loss. With such an approach, a trader maintains a positive mathematical expectancy even when a portion of trades ends in losses.
No single trade is decisive. The market is a sequence of attempts, not a single trial. Focusing on the outcome of an individual trade undermines discipline and distorts risk perception.
Refusing to exit is also a decision — and it carries risk. Holding a losing position in the hope of a reversal is not a neutral action; it is an active choice to increase uncertainty.
Periods of growth require no less caution than periods of decline. Confidence reinforced by a streak of successful trades often becomes the source of the largest losses. Growth in capital is a reason to reduce risk, not to increase it.
The best kind of risk is one that allows for error. A strategy that leaves no room for mistakes is doomed in the long run. Resilience matters more than precision.
The goal of risk management is not to eliminate losses, but to preserve the ability to continue trading. A trader wins not when losses are avoided, but when losses do not deprive them of the ability to take the next step.
This post is based on our own experiences and research we've gathered from books and various platforms.
Enjoy!

An ascending AUDUSD signals China recovering About 1pm today Monday 29 December, 2025, AUDUSD made a higher high.
It's a bullish chart on the monthly as well.
There is serious talk of the RBA increasing the official cash rate in 2027, perhaps early in the 2nd quarter.
But many mining experts in Australia, for example, a very experienced Geologist, James Cooper see mining bouncing back and happening now in Lithium's cycle finally swinging back in vogue and copper, rare earths. Thats just for starters.
The video is short about 7 minutes and the key takeaway is that 0.71 is the likely target for buying AUDUSD but patterns create pattern's creating further momentum in currency's and take a look at how a bigger picture in this chart is at it vey early stages of printing which would trigger further Chinese world dominance.
* Hypothetical infomercial in nature. This is not investment advice.
^ My publications are released at the same time as my trades, so I do not cherry pick.
# Trading is risky. Before following anyone, always backtest their previous publications.

The Monthly reveals a totally ‘flipped’ BiasKey points:
That I see.
The massive Cup forms from around Covid & extends upwards (100% move approx. occurs , text book, it’s the same vertical distance from bottom of cup to the top or where it breaks out from). For reference (only not financial advice) of something similar check out Tesla on the Monthly, its in a similar bullish Cup.
Price on BTCUSD M has dipped lower into the FVG several times already. But higher lows as the dollar is starting to reveal its weakness & dominated by AUD and EUR (just for starters).
21 & 50 EMA. Even if the Bitcoin price drops back to 75 to 80k it would merely create more bullish squeeze on price as EMA ‘tapping’ will occur or where for example 21/50/200 are very close together. Final squeeze on Bitcoin price.
**********************
But here’s, the thing, if AUDUSD tomorrow Monday makes some big waves on more talk of China bouncing back and investors reconsidering and many may sell US equities to align with local mining stocks as a climbing AUD would diminish their final profits & I see AUDUSD climbing to 0.71 by 2nd quarter. (Based off high timeframe tech analysis & inflationary markers may require a raise in the official housing rate down under , 2nd quarter perhaps).

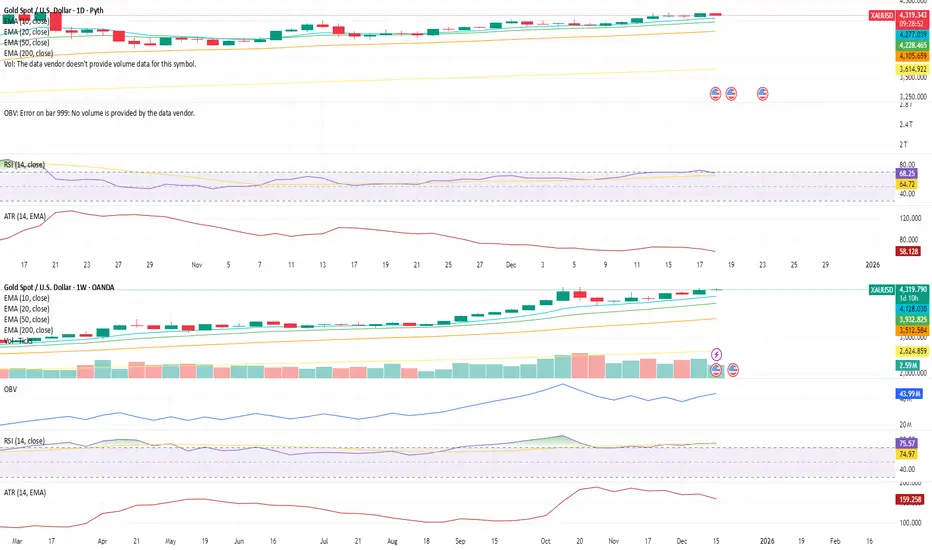
XAUUSD Structure Update — Daily & Weekly View1D Chart (Daily)
Gold continues to trade above all key EMAs, with the 10 EMA leading and holding steady, reinforcing short-term structural support rather than impulsive momentum.
RSI is taking a brief breather but remains elevated near 68, suggesting momentum is cooling in a controlled manner rather than breaking down.
ATR remains flat, indicating volatility is contained and price is progressing in an orderly fashion rather than expanding aggressively.
Due to the nature of spot gold volume, OBV on the daily timeframe is less informative, and participation signals are better assessed from the higher-timeframe structure.
Overall, the daily chart reflects consolidation within strength, not distribution.
1W Chart (Weekly)
The weekly structure continues to support the broader bullish framework.
Price remains above all major EMAs, with the 10 and 20 EMA rising steadily — not steep, but clearly directional — reinforcing sustainable trend progression rather than late-stage acceleration.
OBV trends higher on the weekly, signaling healthy participation and accumulation beneath the surface.
RSI holds near 75, elevated yet stable, indicating persistent strength without signs of exhaustion.
ATR remains flat, confirming that volatility remains controlled even as price holds elevated levels.
The weekly structure confirms that gold remains constructive and supported, with no technical evidence of breakdown.
⭐ Final Clarity Note ⭐
In structurally strong markets, consolidation often appears before continuation, not after failure.
When price holds above trend EMAs, volatility remains compressed, and participation persists on higher timeframes, it typically reflects positioning rather than speculation.
Gold’s current structure suggests the market is digesting gains, not abandoning them.
Can Japan's Steel Giant Win the Green War?Nippon Steel Corporation stands at a critical crossroads, executing a radical transformation from domestic Japanese producer to global materials powerhouse. The company targets 100 million tons of global crude steel capacity under its "2030 Medium- to Long-term Management Plan," seeking 1 trillion yen in annual underlying business profit. However, this ambition collides with formidable obstacles: the politically contested $14.1 billion U.S. Steel acquisition faces bipartisan opposition despite Japan's allied status, while the strategic withdrawal from China, including dissolving a 20-year joint venture with Baosteel, signals a decisive "de-risking" pivot toward Western security frameworks.
The company's future hinges on its aggressive Indian expansion through the AM/NS India joint venture, which plans to triple capacity to 25-26 million tons by 2030, capturing the subcontinent's infrastructure boom and favorable demographics. Simultaneously, NSC is weaponizing its intellectual property dominance in electrical steel critical for EV motors through unprecedented patent litigation, even suing major customer Toyota to protect proprietary technology. This technological moat, exemplified by brands like "HILITECORE" and "NSafe-AUTOLite," positions NSC as an indispensable supplier in the global automotive lightweighting and electrification revolution.
Yet existential threats loom large. The "NSCarbolex" decarbonization strategy requires massive capital expenditures of 868 billion yen for electric arc furnaces alone, while bridging to unproven hydrogen direct reduction technology by 2050. Europe's Carbon Border Adjustment Mechanism threatens to tax NSC's exports into oblivion, forcing accelerated retirement of coal-based assets. The March 2025 cyberattack on subsidiary NSSOL exposed digital vulnerabilities as operational technology converges with IT systems. The NSC faces a strategic trilemma: balancing growth in protected markets, ensuring security through supply chain decoupling, and making sustainability investments that threaten near-term solvency. Success demands flawless execution across geopolitical, technological, and financial dimensions, simultaneously a precarious bet on reshaping the global steel order.

How AI is Revolutionizing Risk ManagementIn a world where bots can fire off hundreds of orders in the time it takes you to sip your coffee, risk management isn't a checkbox at the end of your plan it's the core operating system.
AI has given traders incredible leverage:
Faster execution than any human
Exposure to more markets and instruments
Complex position structures that would be impossible to manage manually
But that same leverage cuts both ways. When something breaks, it doesn't trickle it cascades.
The traders who survive this era won't be the ones with the most aggressive models. They'll be the ones whose risk frameworks are built to handle both human mistakes and machine speed.
Why Old-School Risk Rules Aren't Enough Anymore
For years, the standard advice looked like this:
"Never risk more than 1–2% per trade"
"Always use a stop loss"
"Diversify across assets"
Those principles still matter so much. But AI and automation helped improve and changed the landscape:
Orders can hit the market in microseconds your "mental stop" is useless
Correlations spike during stress what looked diversified suddenly moves as one
Multiple bots can unintentionally stack risk in the same direction
Feedback loops between algos can turn a normal move into a cascade
In other words: the classic rules are the starting point , not the full playbook.
How AI Supercharges Risk Management (If You Let It)
Used well, AI doesn't just place trades it monitors and defends your account in ways a human never could.
Dynamic Position Sizing
Instead of risking a flat 1% on every trade, AI can adjust size based on:
Current volatility
Recent strategy performance
Correlation with existing positions
Market regime (trend, range, chaos)
When conditions are favorable, size can step up modestly.
When conditions are hostile, size automatically steps down.
The goal isn't to swing for home runs.
It's to press when the wind is at your back, and survive when it's in your face.
Smarter Stop Placement
Fixed stops at round numbers are magnets for liquidity hunts.
AI can analyze:
ATR-based volatility bands
Clusters of swing highs/lows
Liquidity pockets in the book
Option levels where hedging flows are likely
Stops get placed where the idea is broken, not where noise usually spikes.
Portfolio-Level Heat Monitoring
Most traders think in single trades. AI thinks in portfolios.
It can continuously measure:
Total percentage of equity at risk right now
Sector and theme concentration
Correlation clusters (everything tied to the same macro factor)
Worst-case scenarios under shock moves
If your "independent" trades are all secretly the same bet, a good risk engine will tell you.
The 4-Layer Risk Stack for AI Traders
Think of your protection as layered armor:
Trade Level
Clear stop loss
Defined target or exit logic
Position size tied to account risk, not feelings
Strategy Level
Max number of open positions per strategy
Daily loss limit per system
"Three strikes" rules after consecutive losing days
Portfolio Level
Total open risk cap (for example: no more than 2% at risk at once)
Limits by asset class, sector, and narrative
Rules to prevent over concentration in one theme (AI stocks, crypto, etc.)
Account Level
Maximum drawdown you're willing to tolerate
Hard kill switch when that line is crossed
Recovery plan (size reductions, pause period, review process)
AI can monitor all four layers at once every position, every second and trigger actions the moment a rule is violated.
Kelly, Edge, and Why "More" Is Not Always Better
The Kelly Criterion is a famous formula that tells you how much of your account you could risk to maximize long‑term growth.
Kelly % = W - ((1 - W) / R)
Where:
W = Win probability
R = Average Win / Average Loss
Example:
Win rate (W) = 60%
Average win is 1.5× average loss (R = 1.5)
Kelly = 0.60 - (0.40 / 1.5) ≈ 0.33 → 33%
On paper, that says "risk 33% of your account each trade." In reality, that's a fast path to a margin call.
Serious traders and any sane AI risk engine treat Kelly as the ceiling , then scale it down:
Half‑Kelly (≈ 16%)
Quarter‑Kelly (≈ 8%)
Or even less, depending on volatility and confidence
AI can recompute W and R as fresh trades come in, adjusting risk when your edge is hot and cutting risk when your edge is questionable.
Designing Your AI‑Era Risk Framework
You don't need hedge‑fund infrastructure to think like a pro. Start with five questions:
What is my absolute pain threshold?
At what drawdown (%) would I stop trading entirely?
Write that number down. Build backwards from it.
How many consecutive losses can I survive?
If you want to survive 10 straight losses at 20% max drawdown, your per‑trade risk must be ~2% or less.
How will I shrink risk when volatility spikes?
Tie your size to ATR, VIX‑style measures, or your own volatility index.
What are my circuit breakers?
Daily loss limit
Weekly loss review trigger
Conditions where all bots shut down automatically
Is everything written down?
If it's not in rules, it's just a wish.
Rules should be clear enough that a bot could follow them.
Four AI Risk Mistakes That Blow Accounts Quietly
Over‑optimization - Training models until the backtest is perfect… and live trading is a disaster.
Ignoring tail risk - Assuming the future will look like the backtest, and underestimating rare events.
No true kill switch - Letting a "temporary" drawdown turn into permanent damage.
Blind trust in the model - Assuming "the bot knows best" without understanding its logic.
AI should be treated like a high‑performance car: powerful, fast, and absolutely deadly if you drive it without brakes.
Discussion
How are you handling risk in the age of automation?
Do you size positions dynamically or use fixed percentages?
Do you cap total portfolio risk, or just think trade by trade?
Do your bots or strategies have clear kill switches?
Drop your thoughts and your best risk rules in the comments. In the future of trading AI will be the one watching your back.....
Can One Company Own the Ocean Floor?Kraken Robotics has emerged as a dominant force in subsea intelligence, riding three converging megatrends: the weaponization of seabed infrastructure, the global energy transition to offshore wind, and the technological obsolescence of legacy sonar systems. The company's Synthetic Aperture Sonar (SAS) technology delivers range-independent 3cm resolution, 15 times superior to conventional systems. At the same time, its pressure-tolerant SeaPower batteries solve the endurance bottleneck that has plagued autonomous underwater vehicles for decades. This technological moat, protected by 31 granted patents across 19 families, has transformed Kraken from a niche sensor manufacturer into a vertically integrated subsea intelligence platform.
The financial metamorphosis validates this strategic positioning. Q3 2025 revenue surged 60% Year-Over-Year to $31.3 million, with gross margins expanding to 59% and adjusted EBITDA growing 92% to $8.0 million. The balance sheet fortress of $126.6 million in cash, up 750% from the prior year, provides the capital to pursue a dual strategy: organic growth through NATO's Critical Undersea Infrastructure initiative and strategic acquisitions, such as the $17 million purchase of 3D at Depth, which added subsea LiDAR capabilities. The market's 1,000% re-rating since 2023 reflects not speculative excess but a fundamental recognition that Kraken controls critical infrastructure for the emerging blue economy.
Geopolitical tensions have accelerated demand, with the Nord Stream sabotage serving as an inflection point for defense procurement. NATO's Baltic Sentry mission and the alliance-wide focus on protecting 97% of internet traffic carried by undersea cables create sustained tailwinds. Kraken's technology participated in seven naval teams at REPMUS 2025, demonstrating platform-agnostic interoperability that positions it as the universal standard. Combined with exposure to the offshore wind supercycle (250 GW by 2030) and potential deep-sea mining operations valued at $177 trillion in resources, Kraken has positioned itself as the indispensable "picks and shovels" provider for multiple secular growth vectors simultaneously.

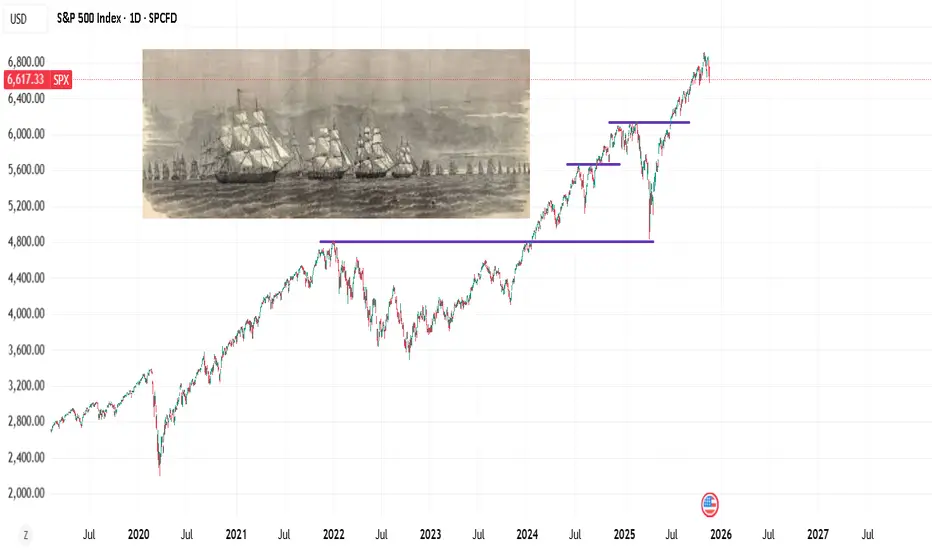
Old Ship Fleet: uncertainty and risk.In the old days, buying a trading ship posed risks due to natural disasters. Later on, people could have option to buy lets say a 10% share in a fleet of 10 trading ships. When one ship goes down, it doesn't ruin your "portfolio".
I think the concept about not putting all eggs in one basket fits well into risk taking.
Then you have some investors claim, you put all your eggs into one basket - and guard the basket.
The ship fleet works as a syllogism about uncertainty. Math (probability of disaster on statistical basis). And risk taking.
Eggs in one basket is a syllogism about losing everything. But not uncertainty or risk-taking per se.
-> In competitive spaces, with only few or one winner. With exponential, explosive returns -- diversifying or putting eggs in separate baskets make no sense. "Fortune favors the bald" is a better way to describe it.
but it says nothing about mathematical side of uncertainty or risk taking. Hence the "old ship fleet".
The Dual Catalyst: Why Silver's \$50 Breakout is SustainableSilver (XAG/USD) recently broke the crucial $50 per ounce level, signaling a fundamental shift in its market dynamics. While the price edges lower in the short term, primarily due to a strengthened US Dollar (USD), its long-term trajectory is decisively bullish. This surge is not merely speculative. It is driven by an unprecedented convergence of geopolitical risks, critical industrial demand, and shifting macroeconomic policy. Analyzing these catalysts across multiple domains confirms silver's evolving role from a precious metal to a critical industrial asset.
Macroeconomics and Geopolitics
Silver's price strength reflects global systemic risk and monetary policy uncertainty. Current market expectations strongly favor a Federal Reserve (Fed) rate cut by December, with a nearly 68% probability priced in by the CME FedWatch Tool. Lower interest rates reduce the opportunity cost of holding non-yielding silver, making it relatively more attractive than bonds or cash. This dovish outlook provides a powerful structural floor for the price.
From a geopolitical perspective, ongoing global tensions and elevated political risks, like recent US government funding debates, accelerate safe-haven demand. Investors seek hard assets to hedge systemic risks. While gold often leads as the primary safe haven, silver's lower cost and dual-use nature attract broader retail and institutional flows, pushing it higher. A strong, sustained rally will require the price to hold above $50 and overcome the next major resistance near the historical high of $54.50.
Technology, Science, and Patents
Industrial demand now constitutes over 50% of silver’s total annual consumption, fundamentally redefining its market. Its unmatched electrical and thermal conductivity makes it indispensable in high-growth sectors.
* Renewable Energy: Silver is critical for photovoltaics (PV), specifically in solar cells, which form the conductive paste that harvests electrons. The global push for green energy and solar capacity expansion creates structural, persistent demand that consistently tightens the market.
* High-Tech and EVs: Electric Vehicles ( EVs) require significantly more silver (25–50 grams per unit) than traditional vehicles for inverters, battery management systems, and high-voltage contacts. The expansion of 5G technology, advanced computing, and the Internet of Things (IoT) further relies on silver-based components for seamless connectivity and efficiency.
Geostrategy and Supply Chain Risk
Silver is now recognized as a critical mineral by several major economies. This reclassification acknowledges its essential role in national security, advanced manufacturing, and the energy transition. This status highlights a geopolitical vulnerability: silver's supply chain is increasingly seen as a strategic concern.
The market currently runs a persistent supply deficit, depleting above-ground stockpiles to critically low levels. Mining silver often occurs as a byproduct of copper, lead, and zinc, meaning its supply cannot easily scale up based on price alone. Trade conflicts or export controls imposed by major producing nations could severely disrupt supply, immediately spiking the price due to its non-substitutable role in key high-tech applications.
Cyber and Economics: The Future Nexus
Silver’s unique properties extend into emerging fields like cybersecurity* and advanced computing. Research integrates silver nanoparticles and quantum materials into sophisticated systems. These materials enhance data processing efficiency and bolster the security of financial supply chains. Furthermore, flexible electronics using silver nanowires* will drive the next generation of wearable and flexible displays, creating entirely new demand vectors.
The long-term economic case for a $100 silver price remains dependent on this confluence of factors. Sustained high industrial consumption, a breakdown in global supply chains, and a continued environment of monetary debasement must align. Silver has truly become a dual-catalyst metal, positioned to thrive as both a financial safe haven and a fundamental building block of the twenty-first-century green and digital economy.

Is Germany's Economic Success Just an Illusion?Germany's benchmark DAX 40 index surged 30% over the past year, creating an impression of robust economic health. However, this performance masks a troubling reality: the index represents globally diversified multinationals whose revenues originate largely outside Germany's struggling domestic market. Behind the DAX's resilience lies fundamental decay. GDP fell 0.3% in Q2 2025, industrial output reached its lowest level since May 2020, and manufacturing declined 4.8% year-over-year. The energy-intensive sector suffered even steeper contraction at 7.5%, revealing that high input costs have become a structural, long-term threat rather than a temporary challenge.
The automotive sector exemplifies Germany's deeper crisis. Once-dominant manufacturers are losing ground in the electric vehicle transition, with their European market share in China plummeting from 24% in 2020 to just 15% in 2024. Despite leading global R&D spending at €58.4 billion in 2023, German automakers remain trapped at Level 2+ autonomy while competitors pursue full self-driving solutions. This technological lag stems from stringent regulations, complex approval processes, and critical dependencies on Chinese rare earth materials, which could trigger €45-75 billion in losses and jeopardize 1.2 million jobs.
Germany's structural rigidities compound these challenges. Federal fragmentation across 16 states paralyzes digitalization efforts, with the country ranking below the EU average in digital infrastructure despite ambitious sovereignty initiatives. The nation serves as Europe's fiscal anchor, contributing €18 billion net to the EU budget in 2024, yet this burden constrains domestic investment capacity. Meanwhile, demographic pressures persist, though immigration has stabilized the workforce; highly skilled migrants disproportionately consider leaving, threatening to transform a demographic solution into brain drain. Without radical reform to streamline bureaucracy, pivot R&D toward disruptive technologies, and retain top talent, the disconnect between the DAX and Germany's foundational economy will only widen.

Halloween Special: The Risk “Treats” That Keep You Alive!🧠 If October has a lesson, it’s this: fear is useful, panic is fatal. Great traders don’t fight the monsters; they contain them.
Here’s my Halloween mindset & risk playbook:
🧪 Keep your “lifeline” small: Risk a fixed 1% per trade until your balance moves ±10%, then recalibrate. This makes loss streaks survivable and hot streaks meaningful.
⏰ Set a nightly curfew: a max daily loss (e.g., 3R or 3%). Hit it? Close the platform. No “one last trade.” Curfews save accounts.
🛑 Define your invalidation before you enter: If that level prints, you’re out, no arguments, no “maybe it comes back.” Plans beat feelings.
🎯 Hunt asymmetry: If you can’t see at least 2R cleanly (preferably 3R), pass. You don’t need more trades; you need better trades.
🧟 Kill the zombie trade: the one you’re babysitting, nudging stops, praying. If you’re managing hope more than risk, exit and reset.
🧘 Protect your mind equity: Two back-to-back losses? Take a 20-minute break. After a big win? Journal before you click again. Calmness compounds.
📜 Make a ritual: pre-trade checklist → position size → entry → stop → targets → log. Rituals turn uncertainty into routine, and routine into consistency.
What’s your #1 rule that keeps the “revenge-trading demon” out of your account❓
⚠️ Disclaimer: This is not financial advice. Always do your own research and manage risk properly.
📚 Stick to your trading plan regarding entries, risk, and management.
Good luck!
All Strategies Are Good; If Managed Properly!
~Richard Nasr
