AUDUSDI entered short at 0.753 with sl above 0.763
There is going to be lots of headwind against AUD
Riskoff

DAX30 I think we are going to have risk-off environment for the next 2 months.
Stops have to go minimum above 13333
I entered short trade at 13250 sl. 13450


NZDUSD OverBought Fundamentally and Technically NZD/USD has slightly overshot its PPP implied exchange rate and the RSI(14) is at yearly highs (so is the price as well). I expect at least a small correction as traders wait for more economic data to justify a further move to the upside as this is a riskier asset. Disclaimer: As always, I am not your financial advisor.

SHORT AUD/USD SETUPSolid technical setup for a sell on $AUDUSD. Would perform well if risk gets sold into year end.

PCCE; Risk Assets "crash conditions" are met. Dump it all! SHORTHere it is, up cluse and personal.
This is the Put/Call Ratio 14 day RSI. - A highly reliable indicator of 93.8% accuracy.
Dump ALL risk assets - including the highly correlated Precious Metals!! - here!
The raw PCCE
Here is the VIX
... and the FAANGs
... and the AUDUSD
... and the USD (DXY)
... and Gold
Just how many more clues does one really need??... For real.

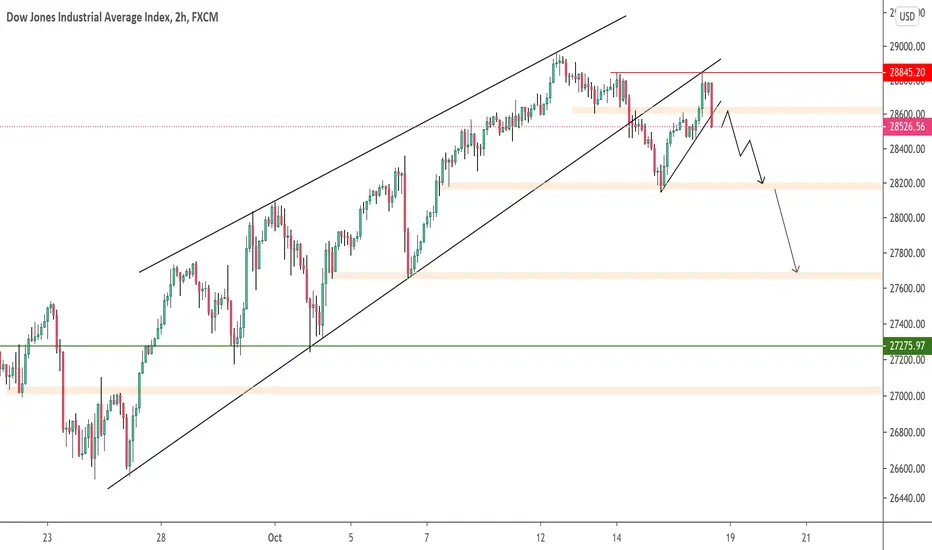
US30 H2Price has made a clear break & retest of the rising wedge formation, leading with a bearish engulfing breaking through support. Watching for a slight retracement to start the week, for then price to continue making its way lower.
NASDAQ topping pattern -- danger 2nd WAVE COVID & electionTVC:NDX
All three confirmations for price to correct below neckline of "incined" Head and Shoulders --
Growing concern over fresh lockdowns hit travel sector hard while banks and oil price also suffer
RSI nearing overbought 65 to 70 -- also on Right Shoulder
The riots and unprecedented uncertainty concerning many national elections from NZ to USA coming in OCT and NOV into year end 2020
Look for first 4H red candle below the high close of the right shoulder to Scale into a Short position in NDX and other high Beta risk assets like FX:AUDUSD and NZDCHF and GBPCHF

NZDUSD daily chart -- Short off trendline resistanceRisk off thru most of October, as long as we don't get back above the multi-month trendline, we should break down thru Ichimoku Cloud and hit oversold RSI of 30 over next 5 trading days.
SL -- 0.6635
TP1 -- 0.6420
TP2 -- 0.6250

DXY $Index Cup & Handle Pattern H2 Chart Target 94.40(23.6%Fib.)INDEX:DXY
Update for DXY...After "No Stimulus 'til after Election" triggers market to buy $Index(DXY).
Previously, as linked ideas, I had called for a DXY bounce at beginning of September. DXY proceeded to bounce from its 2011 Long Term upwards trendline, retracing to the 23.6% Fibonacci level($94.40) of the March to September drawdown. From there I forecasted that DXY would come back to test the 14% Fib. area and the local trendline(blue dotted upward sloping). The news of no stimulus conveniently triggered "Risk-Off", subsequently turning the market to the safety of US Dollars(DXY).
On the 2-Hour Chart I see a cup & handle formation. The handle retracement looks complete at 50% Fibonacci retracement, subsequently reclaiming the(blue dotted) upward trendline.
The target for the measured move is back to the 23.6% Fib. area of $94.40....
Again, I maintain my stance regarding the DXY as I will copy paste my previously published analysis statement:
Oct 1
INDEX:DXY
I had been calling for DXY to retrace after reaching the 23.6%($94. 40 ) back to local trendline and 14% Fib.
The DXY pulled back to $93.53, just shy of the 14%, as well as the local trendline(blue dotted line).
Now we find DXY regaining its corrective momentum to the upside.
I still contend that the 138.2%($95.39) Fibonacci extension of correction is in play, and perhaps the 38.2% Retracement ($96.04)!
Perhaps the final corrective wave(call it "C" or "Y") will end in a 5 wave diagonal, not impulse?
To reiterate;
I believe DXY is following a similar trend as in 2016 during the election period in the USA! In 2016 $Index was able to rally through the election into early January, 2017. It was at that point that the DXY began to breakdown for one year. During this time Bitcoin (& Crypto) inversely correlated, and of course was able to rally to its ATH as the $Index found a bottom in January, 2018. From there the Dollar has rallied up until March of this year(2020), at which point the Dollar again broke down, and has found support on its Long Term trendline. I believe a similar pattern will play out, give or take a month or three, and DXY will eventually break below the 2011 trendline. Let's see how it all goes....

10 yrLooks like bond yields have gone risk on but the stock market hasn't caught onto this quiet yet. Heavy resistance incoming, break .79 and the bulls will party

Risk off sentiment ( Buy U.S Dollars & Japanese Yen ) We have Risk-off sentiment in today's markets as Trump catches Covid-19
If stocks continue to decline, we have a strong bias to sell AUD/JPY, AUD/USD, NOK/JPY, CAD/JPY RUB/JPY

RidetheMacro| RISK REWARD PATTERN EXPLAINED (PART 1)Risk Reward Pattern (PART 1) Explained fully.
Please for (PART 2) Check the link Below.
Don't forgot to add your comments to make things more better and better.
Thank you

EURUSD - key spot to determine next moveKey spot for FX:EURUSD right now. 1.17 and watch out for risk-off move in all assets being started on dollar strength.

NASDAQ100 (H8) Price this previous week has made a nice correction that was overdue.. Price reached the bottom of the ascending channel, & rejected off structure support (Green zone). Unless that region is broken, I will remain bullish on this pair & will be looking for price to move towards the top of the channel once again.


AUDJPYLooking for short-term entry on AUDJPY. Retracement probable, with ~even risk:reward. For improved entry, wait for consolidation/chop between 75.3 and 76.3.
Risk-off sensitive. Manage exposure accordingly.


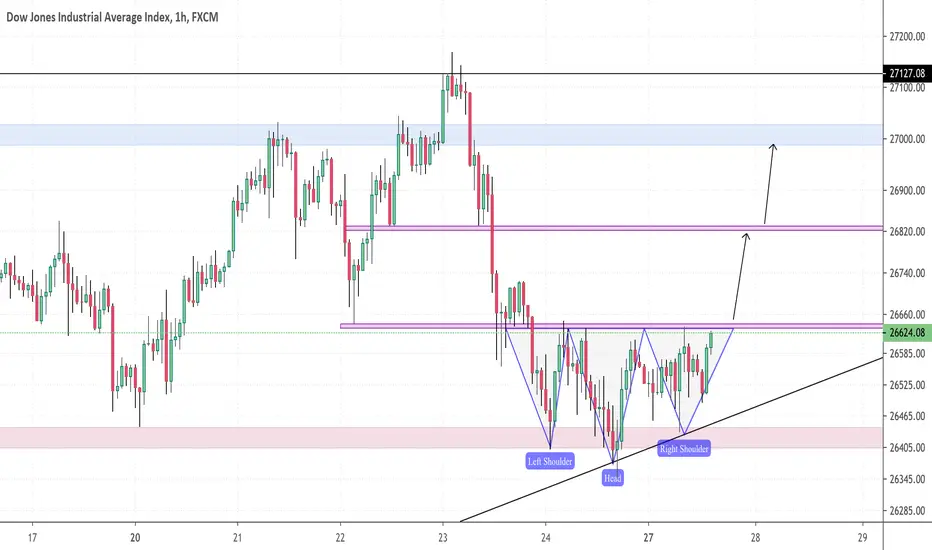
US30 H1Inverse head on shoulders formation, as price has rejected off support along with the ascending trendline. Will be looking for a break of the neckline for a continuation higher.
US 10 BondsThe US 10 Year Bond is probably the most watched metric used to determine the health of the markets. A drop in yields denotes fear and all risk assets are being sold off. The current chart for the 10 Year Bond looks pretty ugly, but it might make the bears quite happy. We are in a giant descending triangle. The formation within the triangle is a very ugly topping pattern.
The chart below is the price action of the 10 Year Bond and it is even more defined and clear. We are approaching the end of the formation.
Currently we stand at the edge and a single big red day may mean a continuation of the down trend. Oil and stocks seem to be topping or at meaningful resistance. Does this mean an imminent drop? No. I am no bear and I frankly don't care which way the markets go, but caution is very much advised. A daily close past the respective resistance/support lines will be a giant red flag for risk assets. Precious metals will likely also drop in such a situation as they have been trading similarly to stocks. However, the drop will likely be far less severe than the last one.
This is not trading advice, but purely my personal opinion.

EUR/JPY Short Hello traders !
I have this trade for you, on higher time frames, daily and weelky we are on a down trend, using this information and combining with that highlighted zone on the chart we discover a zone of resistence.
We have also a risk on sentiment on the market that give us an extra pro argument to take this short.
We can get 3+ R/R that is nice for us !
You can enter in this trade right now and put your SL at 124.150, yout TP at 123.450 and wait to make money !
Also during nights and when Sydney and Tokyo will open up theyr markets and New York will close the market, during this time this pair is losing some price ! use that wisely !
Have a good night !

US30 (H1) Price today has rejected off strong resistance at the top (blue zone), where a lot of bearish pressure occurred to break price below support structure. Price is now pulling back to the previous support where I will be looking for a new lower high / retest of broken support as new resistance to be made. Looking left, you can see how powerful moves occurred off this level in the past, & may do the same again now.
