SOLUSD KEY AREASolana is entering a danger zone after double-topping while also forming a head-and-shoulders structure.
That combination matters.
The chart has already cracked once. That’s your warning shot.
If you’re not in SOL yet and you’re bullish:
This is the only area where a long makes sense—with a clearly defined stop. No stop, no trade.
If you’re bearish and looking to short:
Don’t front-run it. Wait for the next crack and trade against this level once it fails.
If you already own SOL and are inhaling hopium:
You do not want to see this level break. If it does, downside can accelerate fast.
Lastly, why are Cryptos down -50% and the $ down -10% +?
This is where discipline matters.
Don’t FAFO.
If you enjoy the work: 👉 Drop a solid comment. Let’s push it to 6,000 and keep building a community grounded in raw truth, not hype.
Riskreward

GBPUSD Bearish Structure After Supply Zone RejectionThe GBPUSD 2-hour chart shows price rejecting a higher-timeframe supply zone after a liquidity sweep, followed by a clear change of character (CHoCH) indicating a bearish shift in market structure. Price then continues within a descending channel, suggesting sustained selling pressure. Two downside targets are marked, with the first target near recent support and the second aligning closer to the demand zone, highlighting a continuation move toward lower liquidity areas.

“I Was Right” in Trading Has Two Parts, Ego Only Understands OneI’ve written before about the ego trap in trading — how many traders care more about being right than being profitable.
But today, let’s be brutally honest.
Most traders don’t lose money because they lack knowledge.
They lose because they’re addicted to one sentence: “I was right.”
Not “I executed well.”
Not “I managed risk.”
Not “I took profit like a professional.”
Just: “I was right.”
And the most dangerous part is this:
They can lose money…
and still feel successful…
because the chart eventually moved in the direction they predicted.
But trading is not a debate.
Trading is not a prediction contest.
Trading is not an ego competition.
Trading is a performance business.
And if you want brutal clarity, here it is:
✅ “I was right” has TWO components.
And if you only have one of them… you were not right.
The “I Was Right” addiction (and why it destroys traders)
- Being “right” feels good.
- It feeds the ego.
- It gives you the illusion of control.
- It makes you feel smarter than the market.
That’s why traders love saying things like:
- “I called it!”
- “I told you!”
- “Look at price now!”
- “My target got hit!”
But markets don’t reward ego.
Markets reward survival + execution.
So let’s define what “I was right” actually means.
Component #1: The market must move the way you said it would (in the correct order)
This is the part most traders misunderstand.
Because they think being right means: “My target was hit.”
But that’s not what being right means in trading.
Real example (Gold Monday)
Let’s say your Monday analysis looked like this:
“Gold will fill the weekend gap first, and then it will rally to 4850.”
Clean plan.
Clean logic.
Two-step scenario.
Now imagine what actually happens:
- The gap never gets filled
- Price rallies directly
- Gold reaches 4850
And suddenly, people say:
✅ “See? I was right!”
No! You weren’t!
If the entry never happened, you weren’t right
Let’s be brutally clear:
If your plan was gap fill first, and the gap was never filled… then your analysis was wrong.
Even if gold went up.
Even if it went to your target.
Because trading is not about what eventually happens.
Trading is about the path you traded.
Your scenario had a sequence:
- Gap fill
- Rally to 4850
If step 1 fails, the trade idea fails.
The market didn’t follow your plan.
It only coincidentally touched your number.
And coincidence is not skill.
Why this matters (the arguments ego traders hate)
1) A target being hit is meaningless if no trade was triggered
A trade is not a prediction.
A trade is a sequence:
s etup → trigger → entry → execution → exit
If your entry condition never happened, your trade never existed in real life.
So price reaching 4850 doesn’t prove you were right.
It proves only one thing:
Price can hit levels without respecting your logic.
2) You can’t claim correctness without the entry
This is where ego starts cheating.
Instead of saying: “My entry condition failed.”
Ego traders say: “The target was hit, so I was right.”
That’s not analysis.
That’s self-defense.
A forecast without an executable entry is not a trade plan.
It’s a story.
3) If the order of events is wrong, the thesis is wrong
When you say “gap fill first,” you’re implying structure:
- price must retrace
- liquidity must be taken
- imbalance must be resolved
- the market should behave in a specific way
If that doesn’t happen… your read was incorrect.
Price hitting your final level doesn’t fix your thesis.
It only hides the mistake.
4 ) The worst part: it creates fake confidence
And fake confidence is lethal.
Because next time, the trader starts thinking:
“Even if my entry doesn’t happen, my targets are still correct.”
So they begin to:
- chase price
- force entries
- ignore invalidation
- move stops
- overleverage
And that’s how the “I was right” mindset quietly becomes account suicide.
Component #2: Your trade must survive the move (otherwise you were never right)
Now we reach the part that destroys accounts.
Because trading is not forecasting.
- It’s not “October target ideas.”
- It’s not being a chart prophet.
Trading is execution under risk.
And here’s the truth:
✅ The market can move in your direction
❌ and you can still be completely wrong
How?
Because if you didn’t manage risk properly… the market can wipe you out before it proves your target “right.”
Real example: “Gold will reach 4850 said on October” (and you still weren’t right)
Let’s use a real situation.
Imagine it’s October.
Gold is trading around 4300.
And you post confidently:
“Gold will go to 4850.”
Eventually, gold does reach 4850.
And you instantly say:
✅ “I was right!”
But here’s what you ignore — the part that matters:
Before reaching 4850, gold dropped nearly 5000 pips in 6 days
Now let’s speak like adults.
If price moved against you almost 5000 pips in a week… and you were trading margin (not holding physical gold long-term)… then you did “experience volatility.”
Also you experienced something far worse:
✅ you got margin called
✅ you got liquidated
✅ you lost the account
So no — you were not right.
Even if the chart later touched your magical number.
Because trading is not a screenshot.
It’s survival.
The question professionals ask (and ego traders avoid)
When someone says: “Gold will reach 4850”
A professional doesn’t say: “Wow, what a target!”
A professional asks:
- Where is the entry?
- Where is the invalidation?
- Where is the stop loss?
- What’s the position size?
- What’s the maximum tolerated drawdown?
- Can the account survive the path?
Because if you didn’t define the risk… you didn’t make a trading plan.
You made a wish.
And wishes don’t protect accounts.
The difference between analysts and traders
This is where many people get confused.
Analysts want to be correct.
Traders want to get paid.
And you can’t get paid if you treat risk as an optional detail.
That’s why so many people win debates and lose money.
They keep saying:
- “I called it”
- “I was right”
- “check the chart now”
But their account is dead.
And the market does not pay for predictions.
It pays for execution.
The ego trap: “being right” becomes more important than making money
This is the psychological disease behind most retail trading failure.
The ego loves being right because it protects identity.
It allows you to lose money while still feeling smart.
It turns trading into an emotional game where the goal is not profit…
The goal is not being wrong.
But the market doesn’t care about your ego.
There are no grades for “good idea.”
There is no prize for “almost correct.”
There is no trophy for “eventually it happened.”
Only one thing matters:
✅ Did you make money with controlled risk?
If not…
you weren’t right.
The ONLY rule: Right means right in execution, not right in theory
Here’s the rule that destroys the “I was right” addiction:
A prediction is not correctness.
Correctness is profitability with survival.
So yes — “I was right” has two parts:
1) The market moved exactly as expected (including the sequence)
and…
2) Your execution survived the path
Miss either one?
You weren’t right.
You were lucky.
Or reckless.
Or both.
Final message: Stop trying to be right — start trying to be profitable
You don’t need to win against the market or arguments with others.
You need to work with the market.
You don’t need perfect forecasts.
You need:
- clear invalidation levels
- realistic timing
- risk control
- the ability to survive
Because a trader who survives can always come back.
But a trader who blows up while being “right”… will never trade the next opportunity.
And that is the most expensive form of correctness.
The market doesn’t reward conviction and hypothetical targets reached
It rewards execution.
Best Regards!
Mihai Iacob

Market Orders vs Limit Orders: When to Use Each
The Order Type You Choose Can Make or Break Your Trade
You found the perfect setup. Perfect entry level. Perfect risk/reward.
Then you use the wrong order type and get filled $0.50 worse than expected.
On 1,000 shares, that's $500 gone - before the trade even starts.
Order types aren't boring details. They're execution edge hiding in plain sight.
Why Order Types Matter
The Hidden Cost:
Most traders focus on:
Finding good setups
Timing entries
Managing risk
But ignore:
How orders actually execute
Slippage and fill quality
Order type selection
The Impact:
Poor execution can cost 0.1-0.5% per trade.
Over hundreds of trades, this compounds into significant losses.
Basic Order Types
1. Market Order
What It Does:
Executes immediately at the best available price.
When to Use:
You need to get in/out NOW
Liquidity is high
Speed matters more than price
Risks:
Slippage in fast markets
Poor fills in illiquid assets
No price guarantee
Example:
You place market buy for 100 shares.
Current ask: $50.00
You might get filled at $50.05 or worse.
2. Limit Order
What It Does:
Executes only at your specified price or better.
When to Use:
You want a specific price
You're willing to wait
You want to avoid slippage
Risks:
May not get filled
Miss the move entirely
Partial fills possible
Example:
You place limit buy at $49.50.
If price never reaches $49.50, you don't get filled.
If it does, you get $49.50 or better.
3. Stop Order (Stop-Loss)
What It Does:
Becomes a market order when price reaches your stop level.
When to Use:
Protecting against losses
Entering on breakouts
Exiting positions automatically
Risks:
Becomes market order = slippage possible
Can be triggered by wicks
Gap risk
Example:
You own stock at $50, stop at $48.
If price hits $48, stop triggers and sells at market.
In fast market, might fill at $47.50.
4. Stop-Limit Order
What It Does:
Becomes a limit order when price reaches stop level.
When to Use:
Want stop protection with price control
Concerned about slippage
In volatile markets
Risks:
May not fill if price gaps through
Can leave you in losing position
More complex to manage
Example:
Stop at $48, limit at $47.50.
If price hits $48, limit order at $47.50 activates.
If price gaps to $47, order doesn't fill.
Advanced Order Types
5. Trailing Stop
What It Does:
Stop that moves with price to lock in profits.
Types:
Fixed dollar amount
Percentage-based
ATR-based
When to Use:
Letting winners run
Protecting accumulated profits
Trend following strategies
Example:
Buy at $50, trailing stop $2.
Price rises to $55, stop moves to $53.
Price falls to $53, stop triggers.
6. OCO (One-Cancels-Other)
What It Does:
Two orders linked - when one fills, the other cancels.
When to Use:
Setting both stop loss and take profit
Bracketing a position
Automated trade management
Example:
Long at $50.
OCO: Stop at $48, Take profit at $55.
Whichever hits first executes, other cancels.
7. Bracket Order
What It Does:
Entry order with attached stop loss and take profit.
When to Use:
Complete trade management from entry
Ensuring risk is defined
Automated exits
Example:
Buy limit $50, stop $48, target $55.
All three orders placed together.
8. Iceberg Order
What It Does:
Shows only a portion of total order size.
When to Use:
Large orders you don't want to reveal
Avoiding market impact
Institutional-style execution
Example:
Want to buy 10,000 shares.
Iceberg shows 500 at a time.
Refills as portions execute.
Order Type Selection Framework
Question 1: How urgent is this trade?
Very urgent → Market order
Can wait → Limit order
Question 2: How liquid is the asset?
Very liquid → Market order acceptable
Illiquid → Limit order essential
Question 3: What's the purpose?
Entry → Limit or stop (for breakouts)
Exit (profit) → Limit order
Exit (loss) → Stop or stop-limit
Question 4: What's the volatility?
High volatility → Stop-limit to avoid slippage
Low volatility → Regular stop acceptable
AI-Enhanced Order Execution
1. Smart Order Routing
AI determines best execution venue:
Which exchange has best price?
Where is liquidity deepest?
How to minimize market impact?
2. Algorithmic Execution
AI breaks large orders into smaller pieces:
TWAP (Time-Weighted Average Price)
VWAP (Volume-Weighted Average Price)
Implementation shortfall minimization
3. Optimal Order Type Selection
AI recommends order type based on:
Current market conditions
Asset liquidity
Order size
Urgency
4. Slippage Prediction
AI estimates expected slippage:
Based on order size
Current spread
Historical execution data
Order Type Mistakes
Always Using Market Orders - "I just want to get filled." Unnecessary slippage, especially in illiquid assets. Use limit orders when you can wait.
Stop Loss Too Tight - Placing stops where normal volatility triggers them. Stopped out by noise, not by being wrong. Use ATR-based stops.
Ignoring Gaps - Using stop orders without considering gap risk. Stop triggers but fills much worse than expected. Use stop-limits or accept gap risk in position sizing.
Chasing with Market Orders - Price moves, you chase with market order. Fill at worst price, often right before reversal. Use limit orders, accept missing some trades.
Not Using OCO/Brackets - Managing stops and targets manually. Miss exits, emotional interference. Use bracket orders for automated management.
Order Execution Checklist
Before placing any order:
What order type is appropriate?
Is the asset liquid enough for market orders?
Have I accounted for potential slippage?
Is my stop order type appropriate for volatility?
Do I have both stop and target set (OCO/bracket)?
Execution Cost Analysis
Calculate Your Execution Costs:
Slippage = Actual Fill Price - Expected Price
Execution Cost = Slippage + Commission
Per Trade Cost = Execution Cost / Position Value
Annual Impact = Per Trade Cost × Number of Trades
Example:
200 trades per year
Average 0.1% execution cost per trade
$50,000 average position
Annual cost: 200 × 0.1% × $50,000 = $10,000
That's $10,000 lost to poor execution - before any trading P&L.
Key Takeaways
Order type selection directly impacts your trading results
Market orders = speed but potential slippage; Limit orders = price control but may miss fills
Stop orders become market orders - consider stop-limits in volatile markets
Use OCO/bracket orders for automated trade management
Calculate your execution costs - they compound significantly over time
Your Turn
What order types do you use most frequently?
Have you ever been hurt by poor order execution?
Share your execution strategies below 👇

QQQ – Weekly Update | Breakout Being TestedThesis
QQQ remains in a late-stage bullish structure. Price is testing the upper boundary of a bullish wedge, with Wave 5 still the primary scenario while key supports hold.
Context
- Weekly timeframe
- Long-term bull trend intact
- Market approaching the final phase of the broader cycle
What I see
- Price tested the wedge breakout level twice this week
- Weekly close held right on the breakout line near $623
- 50-day MA has now been tested and appears to be flipping to support
- Structure remains compressive, not distributive
What matters now
- Breakout level needs to be clearly flipped to support to confirm continuation
- Market is not pricing near-term event risk (tariff ruling next week) as bearish
- As long as price holds above the $600 area, upside structure remains intact
Buy / Accumulation zone
- No aggressive adds at current levels
- Long-term accumulation remains near the $440 area (200WMA confluence)
Targets
- Primary Wave 5 reference: $720–$725 area (2.618 Fib)
Risk / Invalidation
- Loss of $600 and failure to hold the wedge breakout would shift the structure to consolidation

Scaling a small account is not a strategy problem It is a sequencing and behavior problem. Most traders assume that growth comes from new methods or more trades. The data shows that small accounts grow fastest when they remove the hidden tax that drains them: emotional sizing, poor invalidation placement, and trading inside volatility expansion instead of liquidity alignment.
The most common failure point is position size volatility. When volatility expands, candle ranges widen, liquidity thins, and invalidation distance increases. This is the worst moment to increase size, yet this is when most traders do it—after a streak of wins or boredom-induced impulsive entries. A small account does not fail because the market moved against it. It fails because it increased exposure when the market removed fuel.
Professionals scale differently. They anchor size when volatility expands and only scale when volatility compresses, liquidity is swept cleanly, and structure transitions. This shift protects capital durability first so compounding becomes mathematically possible second.
The framework begins with a volatility budget. Every asset has a typical invalidation distance on each timeframe. BTCUSDT and SOLUSDT behave with wider ranges than mid-cap pairs, and their liquidity pockets are tested more aggressively during overlap sessions. Your account must size exposure based on what the market historically allows a setup to absorb without forcing premature liquidation.
Liquidity mapping is the next step. Equal highs, equal lows, and inefficient consolidation clusters are not entry signals. They are incentives. Price moves there to transact, collect stops, and reposition larger capital. The first proof of intention is the sweep. Price breaches liquidity and reclaims back inside the swing. This tells you that breakout traders provided the orders, not continuation. A small account compounds faster when it waits for the sweep to finish rather than entering into it.
From there, structure must transition. In an uptrend, the market protects higher lows. In a downtrend, it protects lower highs. When price violates the last defended point after liquidity is taken, you have a control handover. This is not a guess. It is a behavioral change in price organization. But structure alone is still incomplete. It requires displacement.
Displacement is momentum proving participation. A structural break followed by thin, drifting candles is not authority. A structural break followed by clean directional movement is participation. This shows urgency from the opposing side. This is where narratives change and capital begins positioning for the next impulse.
The retest becomes the execution filter. Price returns to the broken or swept zone, interacts without hesitation, and respects the new bias built from liquidity and structure. The retest reduces invalidation distance, tightens risk, and improves reward asymmetry naturally without needing to increase leverage or complexity. The best retest is not the fastest one. It is the one that proved permission through sequence.
Micro-scaling compounds edge without compounding risk. Extracting 1–3% per trade on confirmed retests with 2.5:1 or better R:R compounds a small account more efficiently than trying to extract 10% during unconfirmed expansion phases. High-quality trades reduce mistake frequency, which matters more than win rate when capital is small and feedback is fast.
Time is also a filter. Crypto liquidity behaves differently by session. The most stable participation for BTC and SOL historically occurs during London–NY overlap, where bid depth is higher, sweeps are cleaner, and structural transitions show more authority. Dead-zone hours widen noise and compress clarity. Scaling requires knowing when participation is probable, not forcing participation when it is absent.
The final rule is process-first validation. A trade that works without a reason is not scale permission. A trade that works because it followed the sequence is. The market does not reward perfection. It rewards traders who stay calibrated to structure, volatility, and liquidity long enough to compound the value of participation when conditions finally agree.
Scaling is not about catching the entire move.
It is about surviving long enough to participate in the right side of the next move with defined risk and conditional exposure. Small accounts grow when traders stop scaling emotion and start scaling conditions.

Risk Management Is Not Protection... It’s Your Edge!!!Most traders treat risk management like a seatbelt.
Something you use just in case.
🧳Professionals treat risk management as their main edge.
Because in trading, you don’t get paid for being right...
you get paid for staying in the game long enough for probabilities to work.
1️⃣ Risk Is Defined Before the Trade Exists
Before you think about entries or targets, one question must already be answered:
Where am I wrong?
If you don’t know where your idea fails,
you’re not managing risk... you’re hoping.
Professionals define risk first.
The trade only exists after invalidation is clear.
2️⃣ Small Risk Creates Big Freedom
When risk is small and predefined:
- hesitation disappears
- emotions calm down
- execution improves
Why?
Because no single trade matters anymore.
You stop needing trades to work, and that’s when trading becomes objective.
3️⃣ Risk Management Turns Losses Into Data
Losses are unavoidable.
Damage is optional.
A controlled loss is not a failure; it’s information.
Every loss tells you:
- the market condition wasn’t right
- the timing was early
- or the structure changed
When risk is managed, losses educate instead of punish.
4️⃣ Consistency Is Built on Risk, Not Wins
Winning streaks feel good.
They don’t build careers.
Surviving losing streaks does.
Proper risk management ensures:
- drawdowns stay shallow
- confidence stays intact
- discipline stays repeatable
That’s how traders last long enough to improve.
💡The Real Truth
You don’t need a better strategy.
You need better control over downside.
Risk management is what allows:
- imperfect strategies to work
- average win rates to grow accounts
- traders to evolve instead of quit
⚠️ Disclaimer: This is not financial advice. Always do your own research and manage risk properly.
📚 Stick to your trading plan regarding entries, risk, and management.
Good luck! 🍀
All Strategies Are Good; If Managed Properly!
~Richard Nasr

Why Risk–Reward Matters More Than Win Rate!!One of the biggest myths in trading is this:
“I need to win more trades to be profitable.”
✖️You don’t...
Some of the most profitable traders in the world win less than 50% of their trades.
So what’s the real edge?
👉 Risk–reward.
1️⃣ Win Rate Without Risk–Reward Is Meaningless
A trader who wins 70% of the time but risks 3 to make 1 is still bleeding slowly.
Meanwhile, a trader who wins only 40% of the time
but risks 1 to make 3 can grow consistently.🪜
Win rate tells you how often you’re right.
Risk–reward tells you how much it matters when you are.
2️⃣ Risk Defines the Trade Before Entry
Professionals don’t start with targets.
They start with invalidation.
They ask:
- Where is my idea wrong?
- Where does structure break?
- Where must I be out?
Only after risk is defined, do rewards become meaningful.🏆
If you don’t know where you’re wrong,
you don’t know what you’re trading.
3️⃣ Good Risk–Reward Creates Emotional Stability
When your risk is small and predefined:
- losses feel normal
- hesitation disappears
- overtrading drops
Why?
Because no single trade can hurt you badly❗️
Risk–reward doesn’t just protect your account.
It protects your mindset.
4️⃣ Risk–Reward Is What Builds Consistency
Consistency doesn’t come from winning streaks.
It comes from surviving losing streaks.📉
Proper risk–reward ensures:
- drawdowns stay shallow
- confidence stays intact
- discipline stays repeatable
That’s how traders last long enough to let probabilities work.
📚The Big Lesson
✔️You don’t need to be right more often.
✖️You need your winners to matter more than your losers.
When risk is controlled and reward is logical, trading stops feeling like gambling and starts feeling like execution.
⚠️ Disclaimer: This is not financial advice. Always do your own research and manage risk properly.
📚 Stick to your trading plan regarding entries, risk, and management.
Good luck! 🍀
All Strategies Are Good; If Managed Properly!
~Richard Nasr

Risk Control, Risk Assessment, Risk ManagementWhy do the professionals make consistently high incomes from trading stocks?
They always control and manage their risk. They use the candlestick patterns as support and resistance levels and allow the stock to "breathe" within a range they have determined is a natural price movement up and down within a tight consolidation, which is what the professionals prefer to trade.
Professionals do mitigate risk on huge-lot orders over 1 million - 5 million shares or higher. They may use Option Puts, e-minis, futures, or spots--whatever they decide for that specific stock trade they have entered and are holding with the intent of having HFTs gap or run the stock upward at market open.
Professionals calculate their risk versus the Run Gain Potential for that individual stock. This provides the Risk vs. Profit gain that can be estimated with a high degree of accuracy.
When you trade any stock, if the stop loss placement makes you nervous, do not tighten the stop loss order price.
Instead, find a lower risk stock with good support very close to your entry price.

4 TYPES OF TRADERS & THEIR RISK MANAGEMENT STYLES (MASTERCLASS)In the world of trading, your personality dictates your strategy. There is no "one size fits all" approach to closing a trade. Some traders prefer peace of mind, while others chase maximum potential returns.
Below are the four main types of traders based on how they handle Take Profit (TP) levels and risk. Identifying which one you are the first step to consistency.
1) THE EXTREME PROFIT LOCKER This trader closes the entire position the moment TP1 is hit or at a certain level like 1R.
PROS:
Immediate Profit: The moment TP1 is hit, the profit is secured in the wallet.
Zero Stress: No more emotional pressure or chart watching since the trade is fully closed.
Safety: No chance of the trade reversing into a loss because you are already out.
CONS:
FOMO (Fear Of Missing Out): You completely miss TP2, TP3, or any massive continuation rallies.
Limited Upside: You are capping your winners early, which means you need a higher win rate to be profitable long-term.
2) THE SMART FUND PROTECTOR This is the most balanced approach. This trader usually books 50% to 80% of the profit at TP1 and shifts the Stop Loss to Breakeven for the remaining position.
PROS:
Capital Preservation: Both the initial capital and a portion of the profit are locked in immediately.
Stress-Free Runners: You are "safe" even if the trade reverses, as the worst-case scenario is breaking even on the remainder.
Psychological Comfort: It is easier to hold for big targets when you have already banked money.
CONS:
Premature Stop-Outs: If price pulls back to entry after TP1 (a common occurrence) and then rallies, you get stopped out at breakeven and miss the big move.
Regret: You may feel frustration when the market pumps hard, but you are only holding a tiny "moon bag" position.
3) THE SMART NO TRAIL TRADER This trader focuses on math over comfort. Instead of closing fully or moving to breakeven immediately, they scale out based on their initial risk. For example, if their risk was $100, they lock in $100 profit at TP1 and keep the rest running without moving the Stop Loss to breakeven.
PROS:
Maximum Potential: This style gives the best chance to ride big trends and catch all TPs.
Balanced Math: At every TP, they cover their potential loss, ensuring the math works in their favor.
Room to Breathe: By not rushing to breakeven, they avoid getting stopped out by standard market volatility before the real move happens.
CONS:
Reversal Risk: If the trade reverses completely from TP1, they might end up with nothing or a full loss.
High Stress: Requires active monitoring, patience, and a strong stomach to watch profits turn into drawdowns during pullbacks.
Whipsaw Danger: Many trades pull back after TP1. This trader risks giving back open profits in exchange for the chance of a home run.
4) THE ONE TARGET HIGH R.R. PLAYER This trader operates with a "sniper" mentality. They do not take partial profits. They only lock profit at a specific, high-value level (e.g., 1:3 or 1:5 Risk-to-Reward). It is usually "All or Nothing."
PROS:
Profitability with Low Win Rate: Because the winners are so big (3x or 5x the risk), you can be profitable even if you lose 60% of your trades.
Efficiency: One winning trade covers multiple small losses.
CONS:
Low Win Rate: Since you target high rewards, price will reach your target less often.
Psychological Difficulty: This requires extreme patience and experience. It is mentally painful to watch a trade go up 2R (2x profit) and then reverse to hit your Stop Loss, but that is the cost of this strategy.
SUMMARY -
Each style has its own specific advantages:
The "Profit Locker" sleeps best at night.
The "Fund Protector" survives the longest.
The "No Trail Trader" maximizes trends.
The "High R.R. Player" plays the long-term probability game.
Choose the style that fits your risk appetite and how much time you can actively watch the charts.
- TUFFYCALLS

How AI is Revolutionizing Risk ManagementIn a world where bots can fire off hundreds of orders in the time it takes you to sip your coffee, risk management isn't a checkbox at the end of your plan it's the core operating system.
AI has given traders incredible leverage:
Faster execution than any human
Exposure to more markets and instruments
Complex position structures that would be impossible to manage manually
But that same leverage cuts both ways. When something breaks, it doesn't trickle it cascades.
The traders who survive this era won't be the ones with the most aggressive models. They'll be the ones whose risk frameworks are built to handle both human mistakes and machine speed.
Why Old-School Risk Rules Aren't Enough Anymore
For years, the standard advice looked like this:
"Never risk more than 1–2% per trade"
"Always use a stop loss"
"Diversify across assets"
Those principles still matter so much. But AI and automation helped improve and changed the landscape:
Orders can hit the market in microseconds your "mental stop" is useless
Correlations spike during stress what looked diversified suddenly moves as one
Multiple bots can unintentionally stack risk in the same direction
Feedback loops between algos can turn a normal move into a cascade
In other words: the classic rules are the starting point , not the full playbook.
How AI Supercharges Risk Management (If You Let It)
Used well, AI doesn't just place trades it monitors and defends your account in ways a human never could.
Dynamic Position Sizing
Instead of risking a flat 1% on every trade, AI can adjust size based on:
Current volatility
Recent strategy performance
Correlation with existing positions
Market regime (trend, range, chaos)
When conditions are favorable, size can step up modestly.
When conditions are hostile, size automatically steps down.
The goal isn't to swing for home runs.
It's to press when the wind is at your back, and survive when it's in your face.
Smarter Stop Placement
Fixed stops at round numbers are magnets for liquidity hunts.
AI can analyze:
ATR-based volatility bands
Clusters of swing highs/lows
Liquidity pockets in the book
Option levels where hedging flows are likely
Stops get placed where the idea is broken, not where noise usually spikes.
Portfolio-Level Heat Monitoring
Most traders think in single trades. AI thinks in portfolios.
It can continuously measure:
Total percentage of equity at risk right now
Sector and theme concentration
Correlation clusters (everything tied to the same macro factor)
Worst-case scenarios under shock moves
If your "independent" trades are all secretly the same bet, a good risk engine will tell you.
The 4-Layer Risk Stack for AI Traders
Think of your protection as layered armor:
Trade Level
Clear stop loss
Defined target or exit logic
Position size tied to account risk, not feelings
Strategy Level
Max number of open positions per strategy
Daily loss limit per system
"Three strikes" rules after consecutive losing days
Portfolio Level
Total open risk cap (for example: no more than 2% at risk at once)
Limits by asset class, sector, and narrative
Rules to prevent over concentration in one theme (AI stocks, crypto, etc.)
Account Level
Maximum drawdown you're willing to tolerate
Hard kill switch when that line is crossed
Recovery plan (size reductions, pause period, review process)
AI can monitor all four layers at once every position, every second and trigger actions the moment a rule is violated.
Kelly, Edge, and Why "More" Is Not Always Better
The Kelly Criterion is a famous formula that tells you how much of your account you could risk to maximize long‑term growth.
Kelly % = W - ((1 - W) / R)
Where:
W = Win probability
R = Average Win / Average Loss
Example:
Win rate (W) = 60%
Average win is 1.5× average loss (R = 1.5)
Kelly = 0.60 - (0.40 / 1.5) ≈ 0.33 → 33%
On paper, that says "risk 33% of your account each trade." In reality, that's a fast path to a margin call.
Serious traders and any sane AI risk engine treat Kelly as the ceiling , then scale it down:
Half‑Kelly (≈ 16%)
Quarter‑Kelly (≈ 8%)
Or even less, depending on volatility and confidence
AI can recompute W and R as fresh trades come in, adjusting risk when your edge is hot and cutting risk when your edge is questionable.
Designing Your AI‑Era Risk Framework
You don't need hedge‑fund infrastructure to think like a pro. Start with five questions:
What is my absolute pain threshold?
At what drawdown (%) would I stop trading entirely?
Write that number down. Build backwards from it.
How many consecutive losses can I survive?
If you want to survive 10 straight losses at 20% max drawdown, your per‑trade risk must be ~2% or less.
How will I shrink risk when volatility spikes?
Tie your size to ATR, VIX‑style measures, or your own volatility index.
What are my circuit breakers?
Daily loss limit
Weekly loss review trigger
Conditions where all bots shut down automatically
Is everything written down?
If it's not in rules, it's just a wish.
Rules should be clear enough that a bot could follow them.
Four AI Risk Mistakes That Blow Accounts Quietly
Over‑optimization - Training models until the backtest is perfect… and live trading is a disaster.
Ignoring tail risk - Assuming the future will look like the backtest, and underestimating rare events.
No true kill switch - Letting a "temporary" drawdown turn into permanent damage.
Blind trust in the model - Assuming "the bot knows best" without understanding its logic.
AI should be treated like a high‑performance car: powerful, fast, and absolutely deadly if you drive it without brakes.
Discussion
How are you handling risk in the age of automation?
Do you size positions dynamically or use fixed percentages?
Do you cap total portfolio risk, or just think trade by trade?
Do your bots or strategies have clear kill switches?
Drop your thoughts and your best risk rules in the comments. In the future of trading AI will be the one watching your back.....

"Precision Zones: The S&D Approach That Works for Me"My Supply & Demand Framework (Multi-Timeframe & Trend-Aligned)
This is the structure I use to trade Supply & Demand across all timeframes, from swing trading down to scalping. The logic stays the same — only the lens changes.
“I'm using ICMARKETS:BTCUSD latest 4H chart as an example, I’ve marked key demand and supply zones based on the last candle before significant moves, some refined on the 1H timeframe, with entries considered on 15M rejections or order blocks.”
⸻
🔹 1. Trend Comes First
I only look for:
• Demand setups in an uptrend
• Supply setups in a downtrend
This applies on every timeframe.
I never force countertrend trades — direction is the foundation.
⸻
🔹 2. Identifying Zones (4H Core Logic)
My main zone selection starts on the 4H chart.
I mark the last candle before a strong impulsive move:
• Strong move up → Demand zone
• Strong move down → Supply zone
• High probability zone must create Fair Value Gap
That origin candle can be:
• Bullish
• Bearish
• Indecisive
The shape doesn’t matter — the impulse does.
⚠️ The same logic can be applied to any timeframe:
Daily, 1H, 15M, 5M — structure doesn’t change.
⸻
🔹 3. Refining (Optional) on the 1H
Once the zone is marked on 4H, I zoom into 1H:
• If 1H gives a cleaner origin → refine
• If it adds noise → keep the 4H zone as it is
Sometimes i'm even using multiple candles. Refinement is a tool, not a requirement.
⸻
🔹 4. Execution on the 15M
Entries are taken on the 15-minute timeframe.
I wait for two conditions when price returns to my zone:
A. Strong rejection
Examples:
• Sharp wick rejection
• Strong displacement
• Clear shift in short-term order flow
B. A fresh 15M order block
Once rejection creates an order block in the direction of the trend,
that becomes my trigger.
⸻
🔹 5. The “Instinct Entry”: Limit Order at the Zone
Sometimes, when everything aligns strongly, I skip confirmation and place a limit order at the start of the zone.
I only do this when:
• The trend is extremely clear
• Momentum is clean and one-sided
• The zone originated from a very strong displacement, FVG formed
• Structure fully supports continuation
This is not mechanical — it’s experience and flow.
If I’m deeply bullish and the demand zone was the engine of a massive move,
I’m comfortable taking the risk.
Same idea for supply in a strong downtrend.
It’s high-confidence, high-conviction — but optional.
⸻
🔹 6. Fully Scalable Across Timeframes
This system works like a staircase:
• Daily → 4H execution
• 4H → 15M execution
• 1H → 5M execution
• 5M → 1M execution
- Higher timeframe defines the zone.
- Lower timeframe gives the entry.
- Trend ties everything together.
⸻
🔹 7. Entry & Risk Management
• Enter at the beginning of the marked zone.
• Place stop loss at the end of the zone.
• Primary target: fixed 1:3 risk-to-reward (RR).
• Consider liquidity areas, nearest support, or resistance levels for profit-taking.
• I usually take partial profits at 1:3 RR and let the remaining position run toward internal/external range liquidity or key support/resistance levels.
⸻
🔹 8. What This Gives Me
• Strong HTF structure
• Clear LTF triggers
• Cleaner entries
• More confidence
• Less noise
• A consistent, repeatable process
• Flexibility when conviction is extremely high
Thank you for reading! 💛 Show some love, and I hope I can bring real value to your trading journey.

Why We Loaded $MSTR at $169 (5:1 Risk/Reward to $355)Have you ever watched a stock pull back 65% and wondered if it was opportunity or disaster?
Have you ever missed a major setup because fear told you to stay away?
This analysis breaks down why NASDAQ:MSTR at $169 presented a textbook geometric retracement opportunity with exceptional risk/reward asymmetry.
Hello ✌️
Spend 3 minutes ⏰ reading this educational breakdown of structure-based position entry.
🎯 Analytical Insight on MSTR
MicroStrategy pulled back from $543 to $169 a 65% retracement that brought price directly into a major accumulation zone. This wasn't random. It aligned perfectly with:
Fibonacci retracement from 2020 lows to 2024 highs
A long-term ascending trendline dating back to 2020
The monthly $112 support zone that held as a floor
Our position entry: $169
Our invalidation level: $131.80 (below structure)
Our first target: $360 (previous resistance zone)
Risk: $37.20 per share
Reward: $191 per share
Ratio: 5.13:1
This setup didn't require predicting the future. It required identifying where risk was defined and reward was probable based on historical price structure.
📚 Educational Section: Why Geometric Retracements Work
The Psychology of Pullbacks
When price drops 65%, most traders experience:
Fear that it will continue falling forever
Doubt about whether the trend is still valid
Paralysis from watching others panic sell
Professional traders see the same chart differently:
Defined risk at structural support
Historical patterns of mean reversion
Favorable asymmetry when risk is small relative to potential reward
The majority fears what professionals buy.
📉 Understanding Market Structure
Markets don't move in straight lines. They:
Trend in one direction (impulse)
Retrace to gather liquidity (correction)
Resume the primary direction (continuation)
The 0.618 to 0.786 retracement zone historically shows the highest probability of reversal in trending assets. Why?
Early sellers have exhausted
Value buyers recognize the discount
Risk can be defined tightly below support
At $169, MSTR offered:
Clear invalidation below $131.80
Multiple timeframe confluence
Structural support from prior consolidation
🎯 Why This Entry Made Sense
Risk Was Defined
Below $169, the next logical support was $131.80. If price broke below that level, the bullish structure would be invalidated. This gave us a clear exit point before entering.
Reward Was Probable
The previous resistance zone at $360 represented a 113% gain from entry. Even a conservative 50% retracement would target $220+, still offering excellent reward.
Structure Aligned
Monthly support held
Trendline from 2020 intact
Retracement zone tested multiple times
Volume showed exhaustion, not acceleration
📊 Tools Used for This Analysis
Fibonacci Retracement
Identified the 0.786 level as a deep pullback zone where buyers historically step in.
Trendline Analysis
The ascending line from 2020 provided dynamic support that price respected.
Volume Profile
Showed accumulation at lower levels with decreasing selling pressure.
Horizontal Support Zones
The $105-110 monthly level acted as a psychological floor, preventing further collapse.
Risk/Reward Calculator
Entry: $169
Stop: $131.80
Target: $360
Result: 5.13:1 asymmetry
🛡️ Risk Management Framework
Stop Loss Below Structure
Our stop at $131.80 was placed below the invalidation point. If price reached that level, our thesis would be wrong and we'd exit with controlled loss of $37.20 per share.
Position Sizing Based on Risk
With $37.20 risk per share, position size was calculated to risk only 1-2% of total capital. This meant even if wrong, the account remained intact.
Target Based on Structure, Not Hope
$360 wasn't arbitrary. It represented previous resistance where sellers had historically appeared. We planned to reduce exposure at that level.
🧠 Trader Psychology: Why Most Miss These Setups
Fear of Catching a Falling Knife
After a 65% drop, the brain assumes it will continue. But without defined support, there's no knife just falling into the void. At $169, support was visible and the stop at $131.80 was clear.
Recency Bias
The most recent price action (the drop) feels like it will continue forever. Historical structure suggests otherwise, but emotions overpower data.
Herd Mentality
When everyone is bearish, contrarian positions feel uncomfortable. But the best risk/reward setups rarely have crowd consensus.
Waiting for Confirmation
Many traders wait for price to "prove" itself by moving higher first. By then, risk has expanded and reward has diminished. Entry at $169 with $37.20 risk is superior to entry at $250 with $118.20 risk to the same stop level.
📌 Proper Entry Execution
We didn't enter the entire position at once:
First third at $169 (initial position)
Second third at $155 if support retested (average down if structure held)
Final third reserved if $140 tested (closer to stop but maximum opportunity)
This scaling approach:
Reduced emotional pressure
Improved average entry if structure tested
Maintained discipline through volatility
🏆 What Professionals Do Differently
They Don't Chase Momentum
Entry at $543 (the top) felt safe because price was rising. Entry at $169 felt dangerous because price was falling. Professionals understand that perceived safety is often maximum risk.
They Define Risk First
Before asking "how much can I make," they ask "how much can I lose." The $131.80 level answered that question clearly.
They Accept Being Wrong
If MSTR broke $131.80, the position would be exited without hesitation. No hoping, no averaging down into a broken structure. Wrong is wrong.
They Journal Every Decision
Entry logic, risk parameters, and target zones were documented before entry. This removes emotion from exit decisions later.
🎯 Key Takeaways
✅ Risk/reward asymmetry matters more than being right: A 5:1 setup allows you to be wrong multiple times and still profit overall if position sizing is consistent.
✅ Structure defines opportunity: Random entries have random outcomes. Entries at defined support with clear invalidation have statistical edges.
✅ Emotions are the enemy: When $169 felt scary, that was the signal. When $543 felt safe, that was the warning.
✅ Patience beats prediction: We didn't predict $169 was the bottom. We identified it as a zone where risk was small ($37.20) and reward was large ($191). That's enough.
⚠️ Important Disclaimers
This analysis is educational and reflects a specific position entry based on technical structure. It is not financial advice or a recommendation to buy or sell MSTR or any security.
Position entries, stop losses, and targets are shared for educational purposes to demonstrate risk management principles. Your risk tolerance, timeframe, and capital allocation should differ based on your individual circumstances.
Past price structure does not guarantee future performance. MSTR could have broken $131.80 and invalidated this setup entirely, resulting in a controlled loss. Not all setups work, which is why risk management exists.
Always conduct your own analysis, consider your risk tolerance, and consult with a financial professional before making investment decisions. All trading and investing involves risk of loss.
✨ Support This Content
If this breakdown helped you understand structure-based entries and risk management, leave a comment with your thoughts or questions. Your engagement helps us create more educational content like this.
📜 Do your own research. Manage your risk. Trade with discipline.

EUR/GBP Trade Setup — Bullish OpportunityOn EUR/GBP, price has recently broken above a key resistance area that previously rejected price multiple times. After the breakout, price returned to the same zone, where it is now showing signs of support. This is a classic example of resistance turning into support, suggesting that buyers are defending this level.
At the same time, price has filled a fair value gap (FVG) created during the bullish move. When the imbalance gets filled, the market often establishes a stronger foundation for continuation in the same direction.
With buyers reacting to both the support zone and the FVG, this area becomes a potential bullish entry point. A stop loss placed just below the support protects the position if buyers fail to hold it, while targeting the recent swing high provides a 1:3 risk-to-reward setup.
📈 Bias: Bullish
🟦 Zone of Interest: Support + FVG
🎯 Target: Previous swing high
🛡 Stop Loss: Below support

CRYPTOCHECK Throwback - BEST POSTS 2025New Year loading 🥳🥂
Setting up your trading technique and sticking to it
The Dunning Kruger Effect
How to trade Bollinger Bands
How to Dollar-Cost-Average
Spotting reliable Bottom Patterns
These ideas may help you improve your strategy and become a more profitable trader. Happy Trading!

Still Good Long R:R's (Gold)Setup
Bullish trend / Correction
Gold still above 50 day moving average
Daily RSI stable around 50 level
Has made a 50% correction of rally since breakout at 3400
Commentary
It seems likely gold needs to first complete an ABCD correction before moving higher - meaning one more lower low. However, support at 3920 could hold, offering good R:R opportunities - even if 4200 holds as resistance.
Strategy
Look for bullish reversals below 4000, above 3920 support
Wait for bigger pullback to the 61.8% Fib / demand zone under 3800

ARM Holdings : First Long AttemptWhen I asked ChatGPT what Arm does for someone who is not in the chip industry or an electronics engineer, chatgpt gave a very nice answer:
"“A linguist who designed the world’s operating language.”
We're very close to the earnings date. (5 november 2025)
A target price between 200 and 230 is reasonable, but a sharp rise or fall is possible on earnings day.
Whether 230 should be maintained initially or whether a downgrade to the 200 target price will be determined then.
Arm Holdings has subsidiaries in China, making it a giant affected by the US-China trade war.
Reasonable position sizing should be made with this in mind.
We're above the 200 moving average on the 4-hour chart.
ATR % shows that relatively decreasing volatility can experience sharp increases in a short time.
(Not price , volatility )
First, let's try a target of 230 based on a Risk/Reward ratio of 3.
Parameters:
Stop-Loss : 137.5 ( or close under 137.5 )
Risk/Reward Ratio : 3.00
Take-Profit Level : 230.00
As I mentioned above, earnings or other developments can trigger a rapid stop-loss. Therefore, a small position is ideal for this trade.
Regards.

Diary of emotions: a detailed guide. Part 1Hello, traders 😊
Today we will talk about 📖 diary of emotions .
🏳️ This is part 1, as the topic is very voluminous.
In the second part, there will be an example of a diary and consider the mistakes in its management.
I know many people don't even keep a trade journal, but they don't take into account the importance of recording emotions at all.
⚡️ Perhaps, after reading this article, you will change your mind and the diary will become as routine and important for you as opening/ closing deals.
Let's start with the definition:
✔️ Emotion Diary - is a structured tool for the systematic registration and analysis of a trader's psychoemotional state at key moments of the trading process: before entering a position, during its execution, and after closing .
📍 The purpose of the diary is to objectively identify correlations between emotional states and the quality of trading decisions, as well as to exclude subjective interpretations in the process of analyzing the results.
It is not intended for therapy, self-reflection, or motivation.
✂️ It serves as an analytical tool that allows you to quantify the impact of psychological factors on the execution of a trading strategy, thereby reducing the likelihood of errors caused by cognitive biases (there was a recent post about some cognitive biases, it will be attached)
🔎 Theoretical basis
The psychology of trading demonstrates that decisions in the market are often made not based on analysis, but under influence.
➡️ Cognitive distortions:
- the effect of disposition (profit is attributed to oneself, loss to the market);
- loss effect (greater reaction to loss than to equivalent profit);
- confirmation effect (interpretation of data in favor of one's own beliefs).
➡️ Emotional triggers:
- stress from a previous loss;
- the desire to win back;
- social pressure (comparison with other traders);
- feeling guilty or ashamed of a mistake.
📔 Studies of behavioral economics (Daniel Kahneman, Amos Tversky and Richard Thaler) and neuroscience (A.Damasio) confirm that emotions influence decision-making even among experienced traders, and this influence cannot be realized without external fixation.
The diary of emotions is a methodology of external cognitive support that allows to circumvent the limitations of human memory and subjective interpretation.
🔎 Diary structure:
A diary can consist of several important components, each of which is designed to capture a specific aspect of a psychological state and its relationship to an action.
✏️ For example, such:
🟣 1. Date and time of the transaction: provides an emotional state link to a specific transaction and time context (session, news background).
🟣 2.Position type: long / short - allows you to analyze whether there is a dependence of emotions on the direction of the transaction (for example, fear of shorts)
🟣 3.Trading instrument and time frame of analysis: BTC/USDT, H1 - captures the context, whether the emotional state affects the choice of the instrument (for example, high volatility → increased anxiety).
🟣 4. Emotional state before entering, determine the state: calm, nervous, aggressive, tired, expectation of profit, fear of loss, doubt, indifference.
Purpose: to record the basic psycho-emotional state prior to making a decision.
🟣 5. The key thought before entering. Captures the automatic thought that influenced the decision. Examples: "The market needs to bounce off this level," "I don't want to miss the last opportunity," "I lost yesterday, I'll fix everything today." Objective: to identify the cognitive biases underlying the input.
🟣 6. Emotional state during the execution of the transaction. Captures the dynamics of emotions in real time. It may differ from the state before entering, for example, "calm" → "nervous" after the stop is triggered. The goal: to determine how the price affects the emotional state, and vice versa.
🟣 7. Emotional state after closing the deal. Captures the consequences of a decision. For example: "The deal closed with a profit, but I feel empty" → indicates dependence on the result, not on the process.
🟣 8. Was there a violation of the trading plan? yes/no
If "yes", it is mandatory to indicate the type of violation: entering without a signal, changing the stop loss, increasing the lot, holding a losing position, no take profit, trading outside the Kill Zone.
The goal: to connect emotions with specific violations of the rules.
🟣 9. The factor that influenced the emotional state. Indicates an external or internal trigger: a previous loss, someone else's profit on the social network, lack of sleep, FOMC news, lack of a plan for the day ...
Goal: to identify systemic provocateurs of emotional breakdowns.
.......
💡 The second part will be released in a few days .
Leave 🚀, so I'll understand that the topic is interesting to you.
Profit and discipline to all 🪙
IT SECTORNeed to keep a watch on IT sector next. Not sure when it will break the ongoing resistance zone. but looks like some good potential point are there on the upside.

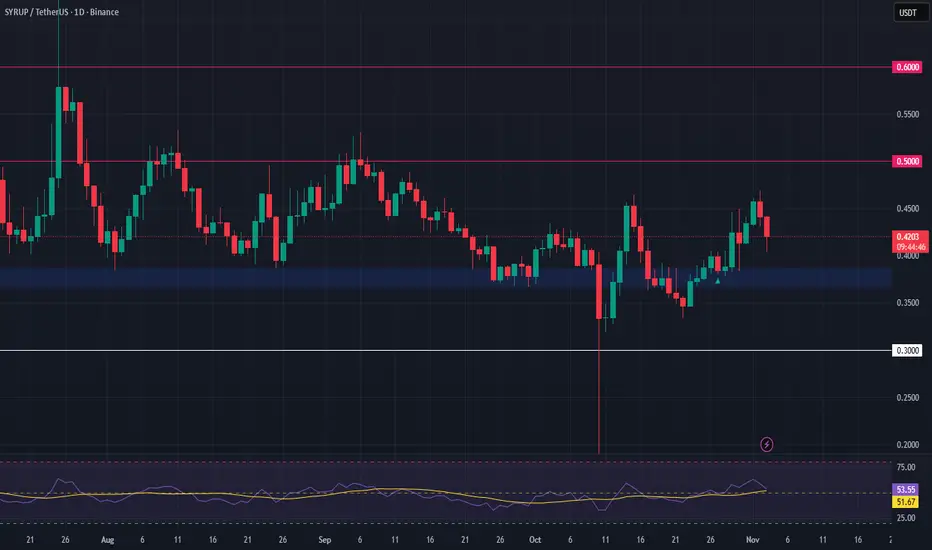
SYRUPUSDT – Watching for Pullback OpportunityAfter a strong 24% surge since our last analysis, SYRUP is starting to show signs of a potential retracement. This could be a healthy move, offering a chance to reset before a possible continuation higher on the higher time frames.
We’re now closely monitoring the $0.37 support zone, a level that aligns with previous consolidation and demand. If price pulls back and holds this zone, we may see a bullish reversal setup forming—a potential entry point for a spot long trade. Confirmation from candlestick structure or volume would strengthen the case.
📈 Trade Plan:
Entry Zone: $0.37
Take Profit Targets: $0.50, $0.60
Stop Loss: $0.30
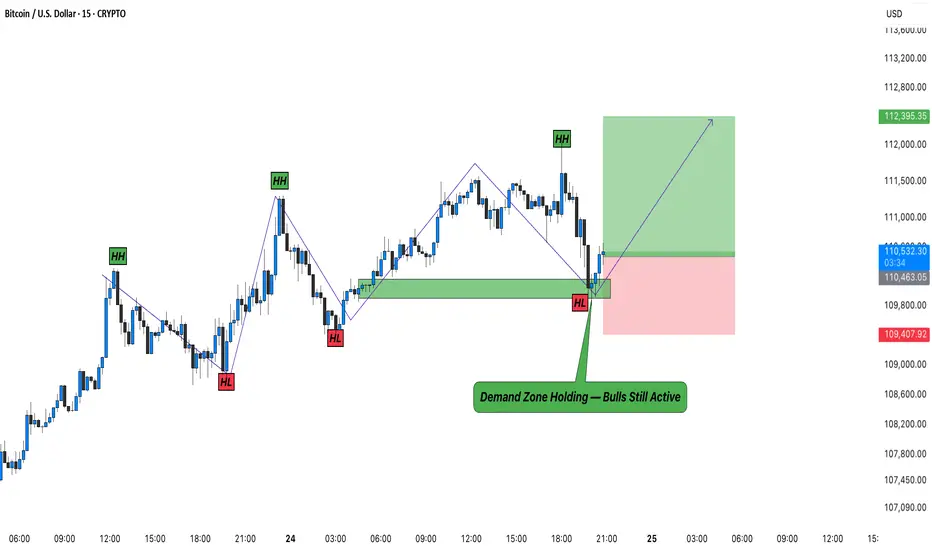
BTC – Demand Zone Holding Firm, Bulls Still in Control!Bitcoin (BTCUSD) continues to respect its demand zone around 110K–109.4K , where buyers have stepped in once again to defend the short-term structure. This area has acted as a reliable reaction point multiple times, confirming that smart money is active around this region.
Price recently dipped into the green zone and showed a quick rebound, forming a possible higher low structure. As long as BTC stays above this zone, the short-term bias remains bullish with immediate targets near 112.3K .
If the momentum continues to build, we might see another impulsive leg to the upside. However, any sustained close below 109.4K would invalidate this setup.
Remember: structure defines direction, not emotions.
Rahul’s Tip:
The best trades often form when most traders panic. Let the market test patience, not your conviction.
Disclaimer: This analysis is for educational purposes only and is not financial advice. Always trade with risk management.
HOW to USE OB After Liq sweept on daily bais CME_MINI:MNQ1!
After we took PDL we Choch on 1H
and 5 min ob appear for more push

Position Sizing and Risk ManagementThere are multiple ways to approach position sizing. The most suitable method depends on the trader’s objectives, timeframe, and account structure. For example, a long-term investor managing a portfolio will operate differently than a short-term trader running a high-frequency system. This chapter will not attempt to cover all possible methods, but will focus on the framework most relevant to the active trader.
Equalized Risk
The most practical method for position sizing is known as equalized risk per trade. This model ensures that each trade risks the same monetary amount, regardless of the stop loss distance. The position size will be calculated based on the distance between the entry price and the stop loss, which means a closer stop equals more size, where a wider stop equals less size. This allows for a more structured and consistent risk control across various events.
Position Size = Dollar Risk / (Entry Price − Stop Price)
Position Size = Dollar Risk / (Entry Price × Stop in %)
For example, an account size of $100,000 and risk amount of 1% will be equivalent to $1,000. In the scenario of a $100 stock price, the table below provides a visual representation of how the position size adapts to different stop loss placements, to maintain an equalized risk per trade. This process can be integrated into order execution on some trading platforms.
The amount risked per trade should be based on a fixed percentage of the current account size. As the account grows, the dollar amount risked increases, allowing for compounding. If the account shrinks, the dollar risk decreases, which helps reduce the impact of continued losses. This approach smooths out the effect of random sequences. A percentage-based model limits downside exposure while preserving upside potential.
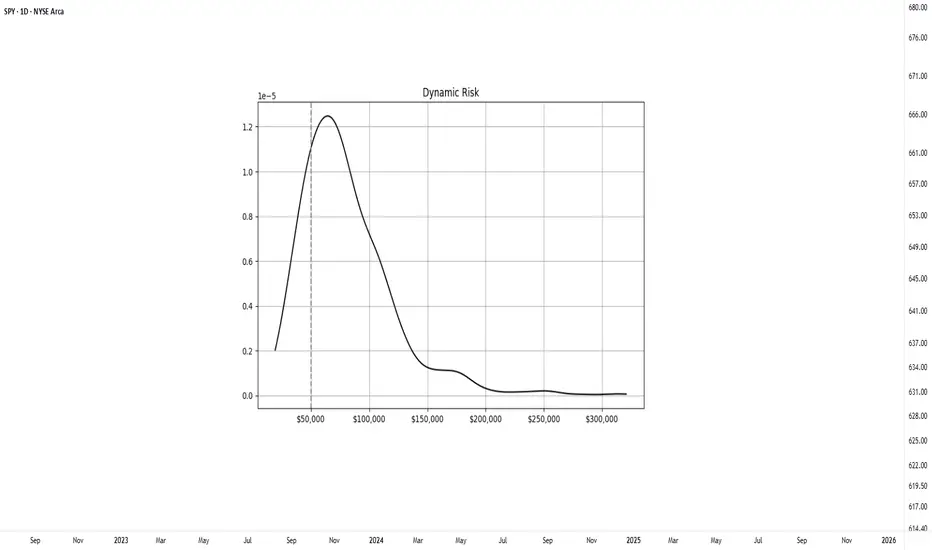
To better illustrate how position sizing affects long-term outcomes, a controlled simulation was conducted. The experiment modeled a system with a 50% win rate and a 1.1 to 1 average reward-to-risk ratio. Starting with a $50,000 account, the system executed 500 trades across 1000 separate runs. Two position sizing methods were compared: a fixed dollar risk of $1000 per trade and a dynamic model risking 2% of the current account balance.
Fixed-Risk Model
In the fixed-risk model, position size remained constant throughout the simulation. The final outcomes formed a relatively tight, symmetrical distribution centered around the expected value, which corresponds to consistent variance.
Dynamic-Risk Model
The dynamic-risk model produced a wider and more skewed distribution. Profitable runs experienced accelerated increase through compounding, while losing runs saw smaller drawdowns due to self-limiting trade size. Although dynamic risk introduces greater dispersion in final outcomes, it allows scalable growth over time. This compounding effect is what makes a dynamic model effective for achieving exponential returns.
A common question is what percentage to use. A range between 1–3% of the account is generally considered reasonable. Too much risk per trade can quickly become destructive, consider that even profitable systems may experience a streak of losses. For instance, a series of five consecutive losses at 10% risk per trade would cut the account by roughly 41%, requiring over a 70% return to recover. In case catastrophic events occur; large position sizing makes them irreversible. However, keeping position size and risk too small can make the entire effort unproductive. There is no such thing as a free trade, meaningful reward requires exposure to risk.
Risk Definition and Stop Placement
Risk in trading represents uncertainty in both the direction and magnitude of outcomes. It can be thought of as the potential result of an event, multiplied by the likelihood of that event occurring. This concept can be formulated as:
Risk = Outcome × Probability of Outcome
This challenges a common assumption that using a closer stop placement equals reduced risk. This is a common misconception. A tighter stop increases the chance of being triggered by normal price fluctuations, which can result in a higher frequency of losses even when the trade idea is valid.
Wide stop placements reduce the likelihood of premature exit, but they also require price to travel further to reach the target, which can slow down the trade and distort the reward-to-risk profile. An effective stop should reflect the volatility of the instrument while remaining consistent with the structure of the setup. A practical guideline is to place stops within 1–3 times the ATR, which allows room for price movement without compromising the reward-risk profile.
When a stop is defined, the distance from entry to stop becomes the risk unit, commonly referred to as R. A target placed at the same distance above the entry is considered 1R, while a target twice as far is 2R, and so on. Thinking in terms of R-multiples standardizes evaluation across different instruments and account sizes. It also helps track expectancy, maintain consistency, and compare trading performance.
In summary, risk is best understood as uncertainty, where the outcome is shaped by both the possible result and the probability of it occurring. The preferred approach for the active trader is equalized risk per trade, where a consistent percentage of the account, typically 1–3%, is risked on each position regardless of the stop distance. This allows the account to develop through compounding. It also reinforces the importance of thinking in terms of sample size. Individual trades are random, but consistent risk control allows statistical edge to develop over time.
Practical Application
To simplify this process, the Risk Module has been developed. The indicator provides a visual reference for position sizing, stop placement, and target definition directly on the chart. It calculates equalized risk per trade and helps maintain consistent exposure.