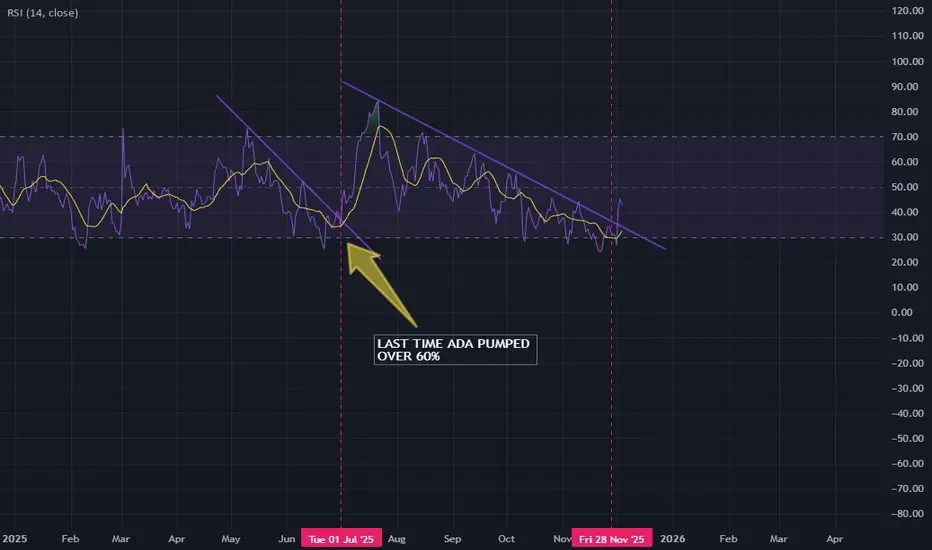
RSI BREAKOUT ON ONE DAY CHARTLast time RSI had a trend line break up on the one day.
ADA pumped over 60%
Relative Strength Index (RSI)
CUP AND A HANDLE - DAILY(For some reason, my published idea chart was blank… so I’m sharing it again)
As you can see there is a cup and a handle pattern forming.
At the same time RSI showing bearish divergence a strong one from the tops, and and weak one from the bodies, and price is showing a gap.
Now simply put, I can try and snipe it by waiting for a better entry after filling the gap, and perhaps cut losses at 18.15
OR as the last red candle has been denied by buyers (denied a lower price (wick)), you can enter now but tread lightly.
To me, with current market conditions, maybe I'll buy a little position, incase it went up, and add to the position to complete a full lot size (from cost basis amount) once it fills the gap.
Remember, the target price from a text books rule says it's the cup and a handle depth but from endpoint of the handle.
But to me, I'm a little worried with current market volatilities, mostly I'll take profit before it reaches full price target.
Mastering Divergence in Technical AnalysisIn technical analysis, a divergence (also called a “momentum divergence” or “price/indicator disagreement”) is one of the most powerful early warning signals available to traders. In simple terms, divergence occurs when price and a momentum indicator (such as RSI, MACD, or Awesome Oscillator etc.) move in opposite directions.
This disagreement often signals that the current trend is losing strength and that a pause, pullback, or full reversal may be approaching.
1. What Is Divergence?
Normally, in a healthy trend:
In an uptrend, price makes higher highs and momentum indicators also make higher highs.
In a downtrend, price makes lower lows and momentum indicators also make lower lows.
A divergence appears when this alignment breaks.
Typical example with RSI or MACD:
Price makes a higher high,
But the indicator makes a lower high.
This tells us that, although price has pushed to a new extreme, the underlying momentum is weaker. Smart money may be taking profits, and the late participants are driving the final leg of the move.
2. Types of Divergence
There are two main families of divergence:
Regular (classic) divergence – often associated with potential trend reversals.
Hidden divergence – often associated with trend continuation after a correction.
Within each family, we have bullish and bearish versions.
2.1 Regular Bullish Divergence – Potential Trend Reversal Up
This suggests that sellers are still pushing price to new lows, but momentum is no longer confirming the strength of this selling pressure. The downtrend is weakening and a bullish reversal may develop.
Context where it’s most powerful:
After a prolonged downtrend.
At or near a higher-timeframe support level (daily/weekly support, major demand zone, trendline, or Fibonacci confluence).
2.2 Regular Bearish Divergence – Potential Trend Reversal Down
This signals that buyers are still able to push price higher, but each new high is supported by less momentum. The uptrend is aging, and a bearish reversal or deeper correction becomes more likely.
Context where it’s most powerful:
After a strong, extended uptrend.
Around major resistance levels, supply zones, or upper trendlines.
2.3 Hidden Bullish Divergence – Trend Continuation Up
Here, price structure still shows an uptrend (higher lows), but the indicator has overshot to the downside. This often appears during pullbacks within an uptrend, suggesting that the correction is driven more by short-term emotion than by real structural weakness.
Interpretation:
Hidden bullish divergence indicates trend continuation. Bulls remain in control, and the pullback may provide an opportunity to join the uptrend at a better price.
2.4 Hidden Bearish Divergence – Trend Continuation Down
Price structure still favors the bears (lower highs), but the indicator has spiked higher, often due to a sharp counter-trend rally. This suggests that the bounce is corrective rather than the start of a new uptrend.
Interpretation:
Hidden bearish divergence favors continuation of the downtrend and often appears before the next impulsive bearish leg.
3. Which Indicators to Use?
Divergence can be spotted on many oscillators, but the most commonly used are:
RSI (Relative Strength Index) – very popular for spotting overbought/oversold zones and divergences.
MACD (and its histogram) – useful for trend and momentum, especially on higher timeframes.
Stochastic Oscillator – often used in range-bound environments.
Awesome Oscillator, CCI, etc. – alternative momentum tools, depending on your preference.
The concept is the same: price and indicator should generally confirm each other. If not, you have a divergence.
4. Timeframes and Reliability
Divergences can be found on all timeframes, but their reliability increases with higher timeframes:
On M5–M15, divergences are frequent but often short-lived. Better for scalpers.
On H1–H4, signals have more weight and can lead to multi-session moves.
On Daily/Weekly, divergences can mark major tops and bottoms, but they may take longer to play out.
A good practice is to:
Identify major divergences on higher timeframes (H4, Daily).
Refine entries on lower timeframes (M15, M30, H1) using structure and price action.
5. How to Trade Divergences (Practical Framework)
Divergence by itself is not a complete trading system. It is a signal of potential imbalance, which should be combined with:
Key levels (support, resistance, supply/demand zones).
Trend structure (higher highs/lows or lower highs/lows).
Price action confirmations (reversal candles, break of structure, etc.).
Risk management (position sizing, stop loss, invalidation level).
6. Common Mistakes When Using Divergences
- Trading every divergence blindly.
Not every divergence leads to a big reversal. Many will result in only minor pullbacks.
- Ignoring the trend.
Regular divergences against a strong trend can fail multiple times before a real top or bottom forms. Hidden divergences are often more reliable in trending markets.
- Forcing divergences where they don’t exist.
Only connect clear, obvious swing highs and lows on both price and indicator. If you have to “stretch” the lines, the signal is probably weak.
- No risk management.
A divergence is just a probability edge, not a guarantee. Always define invalidation and manage position size accordingly.
7. Best Practices
Combine divergence with market structure (trendlines, channels, higher highs/lows).
Use higher-timeframe context and drop to lower timeframes for refined entries.
Pay attention to confluence:
Divergence + key level + candlestick signal is stronger than any single factor.
Keep a trading journal of divergence setups, including screenshots from your charts. Over time, you will see which conditions work best for your style.
Divergences are not magic, but they are one of the cleanest ways to see when price and momentum disagree. Used correctly, they can:
Help you avoid entering late in a trend,
Alert you to potential reversals before they are obvious to the crowd, and
Provide high-probability continuation entries via hidden divergences within strong trends.
$BTC Cycle Analysis - ISM vs 4-Year CycleRiddle me this...
If crypto just runs off the ISM and it topped in March 2021 then why did we get a second HIGHER peak in November 2021 ???
All social and risk metrics topped at the same time as the ISM as well...
It's almost as if 🤔

#BCHBTC #1W (Binance) Big falling wedge breakoutCRYPTOCAP:BCH just regained 50MA weekly support in sats, performing better than CRYPTOCAP:BTC
Seems likely to continue bullish towards 200MA resistance, probably after a pull-back.
⚡️⚡️ #BCH/BTC ⚡️⚡️
Exchanges: Binance
Signal Type: Regular (Long)
Amount: 7.0%
Current Price:
0.004885
Entry Targets:
1) 0.004657
Take-Profit Targets:
1) 0.006329
Stop Targets:
1) 0.003987
Published By: @Zblaba
CRYPTOCAP:BCH BINANCE:BCHBTC #BitcoinCash #PoW bitcoincash.org
Risk/Reward= 1:2.5
Expected Profit= +35.9%
Possible Loss= -14.4%
Estimated Gaintime= 4-7 months

BTCUSDT Market Analysis UpdateHi everyone, I hope you are doing well and I have put my opinion in Bitcoin price on the chart for you. and hope this helps you! Simple, concise, useful
BTC is still trading within a clear bullish market structure, supported by strong HL formations and trendline confluence. At the moment, my main focus is on the Fair Value Gap (FVG) below current price. I expect BTC to revisit this imbalance before continuing the move upward.
The liquidity pool around 82,490 is also important. Personally, I don’t expect price to sweep that level immediately. However, if it does get taken, in my view it would likely serve as the final liquidity grab before resuming the broader uptrend. This makes 82,490 a key level to watch — either it remains untouched while we push higher, or if price sweeps it, the move could act as fuel for the next bullish leg.
From a higher timeframe perspective, the market remains bullish. The structure is intact, RSI is holding mid-range without major bearish divergence, and trendline support has not been broken. Volume also supports this idea — it’s decreasing and showing divergence, but this doesn’t signal a reversal, only a healthy consolidation while holding the bullish trend.
In summary:
Main target: fill the nearby FVG before continuation.
Key liquidity zone: 82,490 (less likely to be taken now, but if it happens, I consider it the last liquidity grab).
Bias: still bullish, expecting higher levels once short-term imbalances are resolved.
Weekly:
As long as BTC holds its HLs and respect the FVG zone, I continue to look for upside continuation — potentially well beyond current levels.
That’s my current view on BTC. Let me know your opinion below 👇
Best regards

FireHoseReel | USDT.D 4H Analysis🔥 Welcome FireHoseReel !
Let’s jump into the Tether Dominance Analysis , one of the most Popular Crypto Index .
👀 USDT Dominance – 4H Timeframe
USDT dominance has reached a major resistance level after a very strong upward rally. At this point, I personally have a bearish bias, expecting a rejection and the completion of a multi-timeframe secondary trend. This view is also supported by my mentor, Arshia Azizpour.
📉 RSI Analysis
Since volume isn’t very reliable on dominance charts, we use the RSI oscillator instead.
RSI has just rejected from the 81 zone, which is a strong static resistance inside the overbought area.
This rejection suggests potential cooldown, pullback, or loss of momentum.
📌 Key Levels to Watch
USDT dominance currently has three major levels:
🔺 6.623% – major top resistance
🔸 6.427% – multi-timeframe trend-shift zone
🔸 6.148% – secondary multi-timeframe trend-shift zone
A clean break and candle close below these levels can give us a bearish bias on dominance, which naturally creates a bullish bias for crypto assets.
⚠️ Important Note
USDT dominance still has strong trend momentum.
If it breaks above the current top, it could trigger another wave of downward pressure on Bitcoin and altcoins.
Historically, these dominance spikes hit BTC and ETH the hardest, while altcoins don’t always fall as aggressively.
🛞 Risk Management & Disclaimer
Please remember to always use proper risk management and position sizing. Nothing in this analysis is financial advice. The market can change quickly, so always trade based on your own strategy, research, and risk tolerance. You are fully responsible for your own trades.

$BTC Halfway to Confirming Bear Market - BUT There's HOPE!BAD NEWS ⚠️
₿ITCOIN IS HALFWAY THERE TO CONFIRMING A NEW BEAR MARKET.
🚨 This is the first-time that CRYPTOCAP:BTC has closed below the 50WMA since Dec ’21. We all know what happened after that.
🚨 If we get another consecutive Weekly close below the 50WMA, I am confident this is the beginning of the end for the bull market.
If that happens, I will discuss my new exit strategy and POI in another post.
GOOD NEWS 🙌
⚡️ The long-awaited DEATH CROSS on the Daily Chart has occurred, which historically marks the bottom.
⚡️ PA is sitting at VERY strong support on the .618 Fib
⚡️ RSI is LOWER than the Liberation Day madness Feb - April ’25, and the lowest it’s been since July ’22.
NOTE: This is the smallest correction we’ve had all bull market.
TL;DR 📖
✅ This is the absolute best time to buy CRYPTOCAP:BTC
✅ Just make sure to follow the 50WMA invalidation if you do take a position.
Remember, we have the most insanely bullish macro / regulatory backdrop in crypto’s entire existence.
MY THOUGHTS 🤓
🐂 I truly believe this is the biggest fake-out we’ve ever seen. There’s way too many tailwinds on the horizon to let this go to waste.
🐂 Bulls need a $10k Mega-Candle THIS WEEK to reclaim momentum.
🐂 I’m still a MEGA-BULL until my thesis is invalidated.
⛔️ We could get one last flush ~$92k to grab CME Gap liquidity.
🛑 DO NOT USE LEVERAGE EVER AGAIN!!!

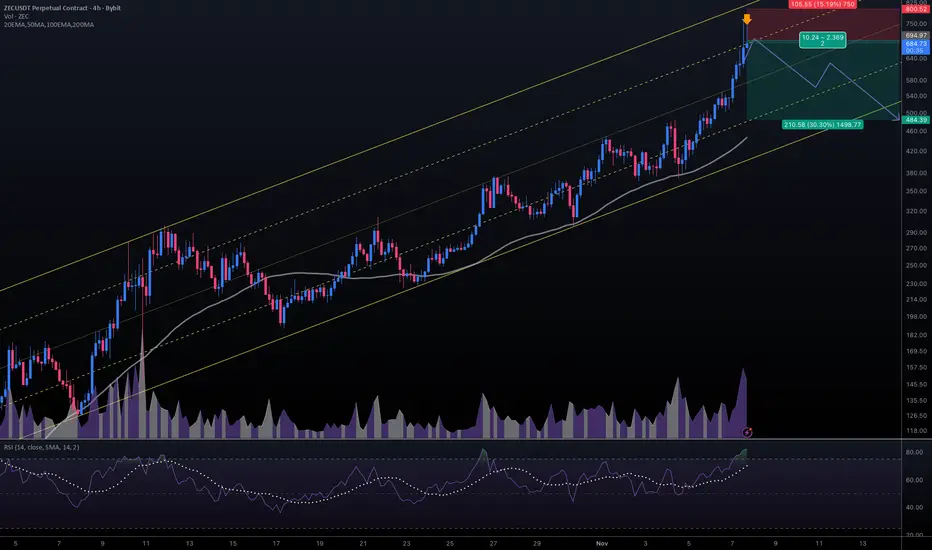
#ZECUSDT #4h (ByBit) Ascending channel on resistance [SHORT]Zcash just printed a shooting star and entered overbought territory again.
It seems likely to finally retrace down towards 50MA support, short-term.
⚡️⚡️ #ZEC/USDT ⚡️⚡️
Exchanges: ByBit USDT
Signal Type: Regular (Short)
Leverage: Isolated (3.0X)
Amount: 4.4%
Current Price:
684.73
Entry Targets:
1) 694.97
Take-Profit Targets:
1) 484.39
Stop Targets:
1) 800.52
Published By: @Zblaba
CRYPTOCAP:ZEC BYBIT:ZECUSDT.P #4h #Privacy #ZK z.cash
Risk/Reward= 1:2.0
Expected Profit= +90.9%
Possible Loss= -45.6%
Estimated Gaintime= 1 week
$DOT / Polkadot - Life SupportWith price coming out of the accumulation range in a downtrend and collapsed under weekly mitigated support/demand.
Price is now retesting this weekly level in a textbook 'break & retest'.
Bulls need to reclaim this area for a chance, other than that it could be curtains.

$BTC VERY Close to Forming a BOTTOMReceiving the end of cycle calls / texts from normie friends - one of my best indicators.
Bullish Divergence on the Daily.
Need some closes above the EMA9 ~$103k to confirm.
Then $107,5 next up.

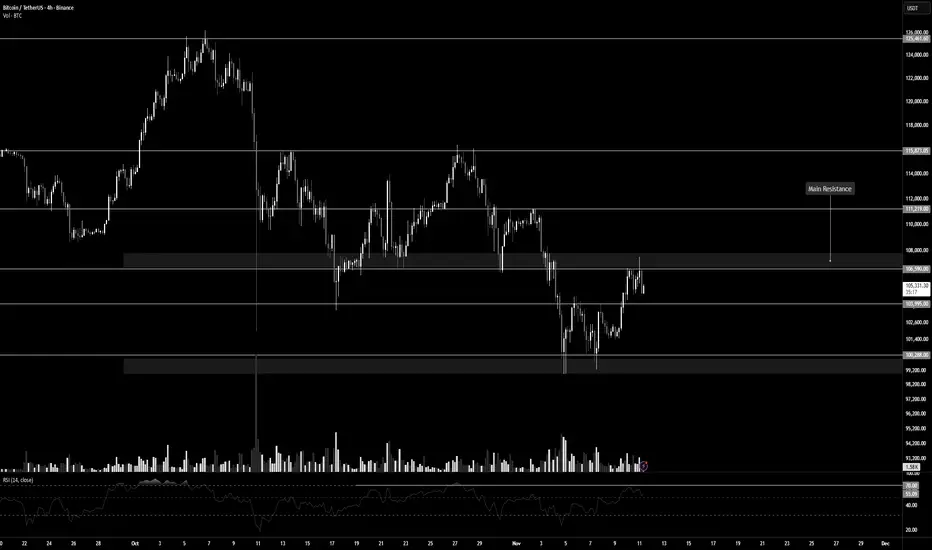
Bitcoin and a Critical Resistance for a Price Breakout | Day 3👋🏻 Hey everyone! Hope you’re doing great! Welcome to the SatoshiFrame channel.
✨ Today we’re diving into the 4-Hour Bitcoin analysis — stay tuned and follow along!
🪙 Bitcoin, in its 4-hour timeframe (as mentioned in previous analyses), is currently sitting below a major resistance level. A breakout above this area could trigger a strong bullish leg, potentially driving price toward forming a new ATH. The key resistance zone is around $106,590, and breaking it could lead to some beautiful market moves.
📊 The buying volume at this resistance is not yet sufficient. If we look closely, since the last touch of the maker-buyer zone at the lower part of the chart, volume has been declining. To break through this resistance, whale candles are needed to absorb all sell orders in the zone — this could lead to a short squeeze.
🧮 The RSI oscillator on the 4-hour timeframe has fluctuated several times below the 70 level, showing two rejections near that area. The 70 RSI level aligns with the $106,590 price resistance, and crossing above it could trigger a strong upward move.
✍️ You can read the possible scenarios for Bitcoin in the rest of the analysis, but since Bitcoin has shown reduced buying volume, it’s best to lower your risk exposure. If the breakout happens, you can reallocate remaining risk toward the next resistance levels.
✅ Long Position Scenario:
A confirmed breakout above $106,590, along with increased buying volume and the RSI surpassing 70, could form a solid long setup on the 4-hour timeframe. Make sure to gather proper confirmations before entering to ensure the best possible trade setup.
❤️ Disclaimer: This analysis is purely based on my personal opinion, and I only take trades when the stated triggers are activated.
EURUSD TIMEFRAME-BY-TIMEFRAME ANALYSIS# 💱 EURUSD (EUR/USD) COMPREHENSIVE TECHNICAL ANALYSIS 🎯
## Week of November 10-14, 2025 | Intraday & Swing Trade Mastery
Close Price: 1.15640 | Entry Point: November 8, 2025, 12:54 AM UTC+4 📊
## 🔍 EXECUTIVE SUMMARY - MULTI-TIMEFRAME PERSPECTIVE
EUR/USD is trading at a critical technical inflection point with strong multi-timeframe alignment signaling imminent directional breakout. Elliott Wave analysis reveals completion of corrective cycles, positioning for next impulse leg targeting 1.1650-1.1750 extension zone with substantial momentum. Bollinger Bands display classic compression squeeze pattern —volatility condensation preceding directional explosion. RSI across all timeframes maintains neutral-bullish bias (52-65 range)—optimal momentum positioning without extreme overbought conditions. Volume clustering at 1.1550-1.1630 represents significant institutional accumulation foundation. Wyckoff spring tests near 1.1500-1.1520 provide aggressive entry triggers. Harmonic pattern convergence at 1.1680-1.1750 resistance signals breakout confirmation with measured move targets extending to 1.1850+. ECB/Fed policy divergence supports directional clarity emerging this week.
## 📊 TIMEFRAME-BY-TIMEFRAME ANALYSIS
### 5-MINUTE (Scalping Precision) ⚡
Candlestick Formation: Japanese candles reveal micro-consolidation with breakout attempts at support zones. Evening Star rejection formations detected at 1.1680-1.1710 intraday resistance creating short opportunities.
Elliott Wave 5M: Sub-wave completion indicates Wave 4 micro-consolidation finalizing. Wave 5 breakout anticipated above 1.1650-1.1680 with targets 1.1720-1.1780 (measured move).
Bollinger Bands: Upper compression mode—middle band at 1.1630 acts as pivot point. Lower band rejection (1.1550-1.1580) creates scalp-long setups with excellent risk/reward ratios.
RSI (14) Analysis: RSI oscillating 48-62 range—neutral territory with minor divergences forming. Bullish divergence at 1.1550 support signals buyer engagement; caution on 68+ resistance approach.
Micro Support/Resistance: 1.1550 (micro-support) | 1.1600 (POC cluster) | 1.1640 (pivot) | 1.1690 (intraday resistance) | 1.1740 (scalp target)
Volume Signature: Volume concentrated 1.1600-1.1660 zone—institutional marker established. Breakout volume >50% above average required above 1.1690 for sustained move above 1.1750.
VWAP Alignment: Price oscillating around session VWAP at 1.1625—each touch generates scalp opportunity. Upper VWAP band at 1.1710; lower support at 1.1550.
### 15-MINUTE (Quick Swing Gateway) 🎢
Candlestick Patterns: Engulfing bars forming at support zones—bullish engulfing at 1.1570 zone confirms reversal attempts. Three-candle patterns (flag continuation) with 50-80 pips breakout potential.
Harmonic Pattern Recognition: Gartley Pattern potential completion near 1.1560-1.1620 PRZ (Potential Reversal Zone). Exceptional risk-reward at 1:3.5 for harmonic traders. Butterfly variant also forming.
Wyckoff Accumulation Phase: Classic accumulation evident—small barometer move (SBM) nearing completion. Spring test anticipated 1.1480-1.1510 zone; markup phase targets 1.1750-1.1850.
Bollinger Bands (15M): Band squeeze intensifying—historical volatility expansion suggests 70-120 pips moves follow. Upper band resistance at 1.1740; lower band support at 1.1520.
Volume Profile (15M): Point of Control (POC) at 1.1630—prime concentration zone. Volume surge >55% required confirming breakout above 1.1710. Imbalances favor upside significantly.
Ichimoku Cloud (15M): Price consolidating below cloud edge—Tenkan-sen at 1.1700 = resistance pivot. Kijun-sen (1.1660) = critical secondary support. Cloud support 1.1540-1.1610.
EMA Structure: EMA 9 (1.1650) above EMA 21 (1.1610)—bullish alignment confirmed. Price above both = intraday strength maintained.
### 30-MINUTE (Intraday Swing Axis) 🔄
Pattern Formation: Symmetrical Triangle pattern consolidating with apex near 1.1700. Ascending triangle variant shows bullish bias—breakout above 1.1680 targets 1.1780-1.1850 extension.
Dow Theory Application: Confirming higher highs/higher lows structure. Secondary trend bullish; pullbacks to EMA 20 (1.1640) = optimal swing entry zones identified.
RSI Divergence Setup: Positive RSI divergence confirmed—price making lower lows (1.1540) while RSI forms higher lows (42 level). Classic reversal setup targeting 1.1720 minimum.
Exponential Moving Average: EMA 9 (1.1665) = core support pivot. EMA 21 (1.1610) = secondary support. EMA 50 (1.1500) = structural hold level. Bullish ribbon alignment intact.
Support Architecture: 1.1500 (EMA 50/structural) | 1.1560 (demand zone) | 1.1610 (volume cluster) | 1.1650 (EMA 9 dynamic)
Resistance Architecture: 1.1680 (triangle formation) | 1.1750 (measured move target) | 1.1800 (weekly resistance) | 1.1850 (extension)
Volume Analysis (30M): Increasing volume on recent bars—accumulation signature strong. Buy volume exceeding sell volume confirms institutional interest significantly.
### 1-HOUR (Core Swing Trade Engine) 🎯
Elliott Wave Structure: Major wave analysis suggests Wave 3 completion near 1.1750. Current Wave 4 correction targets 1.1650-1.1700 support zone. Wave 5 impulse anticipated—target: 1.1850-1.1950.
Pennant Formation: Classic Bullish Pennant pattern forming—breakout confirmation above 1.1710 validates pattern. Pole height measured move = 1.1850+ realistic target.
Bollinger Bands (1H): Upper band at 1.1800 = squeeze breakout target. Middle band (1.1700) = bullish support zone. Lower band rejection (1.1500) creates swing longs with excellent R/R.
VWAP Daily: EUR/USD trading above daily VWAP at 1.1600—bullish gradient confirmed. Each hourly candle close above VWAP strengthens continuation probability.
Volume Profile Hotspot: Heavily traded at 1.1600-1.1660 (accumulation zone) and 1.1710-1.1780 (resistance cluster). Imbalances above 1.1800 suggest vacuum-fill potential.
Ichimoku Cloud Alignment: Price above Senkou Span A (1.1700) & Span B (1.1660)—cloud thickness indicates strong support. Chikou Span above candles = bullish confirmation. Cloud color: BULLISH GREEN.
Gann Theory Application: 45-degree angle from swing low (1.1450) establishes rally trajectory. Resistance at 38.2% Fibonacci extension (1.1750) precedes aggressive breakout phase.
Support Tiers 1H: 1.1500 (structural hold) | 1.1570 (EMA support) | 1.1620 (Kijun-sen) | 1.1660 (accumulation zone)
Resistance Tiers 1H: 1.1710 (breakout trigger) | 1.1760 (extension) | 1.1800 (major level) | 1.1850 (impulse target)
### 4-HOUR (Swing Trade Thesis Foundation) 💼
Inverse Head & Shoulders Pattern: Potential IH&S formation completing—left shoulder (1.1450), head (1.1400), right shoulder completing (1.1500-1.1560). Neckline breakout at 1.1710 targets 1.1900-1.2000 extension.
Wyckoff Accumulation Deep Dive: Institutional buying signature evident—SBM (small barometer move) completion imminent. Spring test to 1.1480-1.1510 anticipated; subsequent markup phase targets 1.1850-1.2000.
RSI 4H Analysis: RSI at 56-68 range—bullish bias maintained. Room for upside extension without extreme overbought. RSI above 74 targets 1.1900+; below 34 = defensive posture required.
Cup & Handle Formation: Potential bullish Cup pattern visible on 4H—handle stabilization near 1.1650-1.1700. Breakout above handle (1.1760) targets cup depth extension = 1.1850-1.1950.
EMA Ribbon Structure: EMA 8 (1.1680), EMA 13 (1.1660), EMA 21 (1.1610), EMA 50 (1.1500), EMA 200 (1.1350)—BULLISH ALIGNMENT PERFECT. Compression/expansion cycles identify momentum phases.
Support Tiers 4H: 1.1450 (structural support) | 1.1500 (accumulation) | 1.1600 (pivot) | 1.1660 (demand cluster)
Resistance Tiers 4H: 1.1710 (key breakout) | 1.1760 (extension) | 1.1800 (major target) | 1.1900 (weekly projection)
Volume Signature 4H: Accumulation volume bars > distribution bars—bullish bias maintained. Volume nodes clustering at 1.1600-1.1660 indicate strong institutional support zone.
### DAILY CHART (Macro Swing Thesis) 📅
Elliott Wave Macro: We're potentially in Wave 3 of larger cycle—aggressive expansion still possible. Wave structure supports break of 1.1800 targeting 1.1950-1.2100 daily close objectives.
Double Bottom Recognition: Historical Double Bottom pattern near 1.1350-1.1450 support—confirmed breakthrough above 1.1710 neckline triggered. Second target near 1.1900-1.2000.
Bollinger Bands Daily: Upper band at 1.1900 = realistic daily target zone. Mean (1.1750) = healthy pullback support. Band slope indicates volatility expansion—expect 100-200 pips daily ranges.
Volume Profile Daily: Strong buying volume bar at 1.1500-1.1650 zone—institutional accumulation marker established. Selling volume decreasing—demand controls trend absolutely.
Ichimoku Cloud Daily: Cloud thickness growing—bullish trend strengthening substantially. Cloud support around 1.1650-1.1750 zone. Kumo breakout anticipated—targets cloud top at 1.1800-1.1900.
Harmonic Analysis Deep: Butterfly Pattern potential completion—PRZ at 1.1710-1.1780 suggests reversal zone OR breakout confirmation. Confluence amplifies probability of extension.
Gann Angles & Fibonacci: 50% retracement (1.1550) + 61.8% extension (1.1850) = key reversal zones. Gann fan angles suggest 1.1800-1.1900 as structural resistance before continuation.
Key Daily Support: 1.1400 (psychological/structural) | 1.1500 (accumulation zone) | 1.1600 (demand level) | 1.1700 (midpoint)
Key Daily Resistance: 1.1710 (breakout trigger) | 1.1780 (extension) | 1.1850 (measured move) | 1.1950 (weekly target)
Trend Confirmation: Higher highs & higher lows maintained—uptrend intact. Daily close above 1.1800 = strong continuation signal targeting 1.2000+ next level.
## 🎪 TRADING SETUP PLAYBOOK - NOV 10-14
### BULLISH SCENARIO (Probability: 80%) ✅
Trigger: 4H candle close above 1.1760 + volume surge (>50% above average) + RSI above 64
Entry Zone: 1.1700-1.1750 (with breakout confirmation signal)
Target 1: 1.1780 (TP1) | Target 2: 1.1820 (TP2) | Target 3: 1.1900 (TP3) | Target 4: 1.1950 (TP4)
Stop Loss: 1.1620 (below EMA/structural support)
Risk/Reward: 1:3.2 (excellent asymmetric setup)
Trade Duration: 18-72 hours (prime swing window)
### BEARISH SCENARIO (Probability: 20%) ⚠️
Trigger: Daily close below 1.1650 + volume increase + RSI divergence failure
Entry Zone: 1.1760-1.1850 (short setup)
Target 1: 1.1710 (TP1) | Target 2: 1.1650 (TP2) | Target 3: 1.1600 (TP3)
Stop Loss: 1.1900 (above resistance)
Risk/Reward: 1:1.6 (acceptable but lower probability)
Trade Duration: Watch for trend reversal confirmation first
## ⚠️ VOLATILITY & OVERBOUGHT/OVERSOLD CONDITIONS
Current Volatility Status: Moderate compression → Expect significant expansion imminent
5M/15M RSI: 48-62 range (neutral)—room for 25-50 pips movements | Scalp target zones
30M/1H RSI: 52-66 range (bullish bias, optimal zone)—sweet spot for swing entries
4H RSI: 56-70 range—approaching caution zone but room to extend | Safe for core swings
Daily RSI: 60-74 range (approaching extremes)—be defensive if daily RSI>76 | Take profits aggressively
Overbought Recognition Points:
RSI daily >75 combined with upper Bollinger Band rejection = immediate profit-taking
Ichimoku cloud top penetration fails (bearish candle rejection) = trend exhaustion signal
Volume declining on breakout attempt = false breakout warning signal
Harmonic pattern PRZ exact hit without follow-through = reversal likely imminent
Oversold Bounce Setups:
RSI 1H <32 on support touch = high-probability bounce back to 1.1750-1.1800
Price below EMA 50 (1.1500) + RSI <30 = aggressive accumulation zone
Spring test below 1.1490 with volume surge = Wyckoff spring reversal trigger
Harmonic pattern PRZ support bounce = measured move extension targets activated
## 🎯 ENTRY & EXIT OPTIMIZATION STRATEGY
### OPTIMAL ENTRY TIMING
For Scalpers (5M): RSI bounce from 44-50 zone after Band lower touch = 15-25 pips scalp (1-3 min holds)
For Quick Swings (15M-30M): 15M candle close above 1.1690 with 4H alignment = 60-100 pips swing (30 min-2 hour holds)
For Core Swings (1H-4H): 4H pennant breakout above 1.1760 on volume = 150-250+ pips target (hold 12-48 hours)
For Position Swings (Daily): Daily close above 1.1800 = continuation play targeting 1.1950-2.0000 (hold 5-7 days)
Best Entry Windows: Asian session overlap (22:00-8:00 UTC), London open (8:00 UTC), NY close (21:00 UTC)
### EXIT STRATEGIES & PROFIT TAKING
Take Profit Levels: TP1: Fibonacci 38.2% (1.1760) | TP2: Harmonic PRZ (1.1820) | TP3: Daily Band upper (1.1900) | TP4: Weekly target (1.1950)
Stop Loss Placement: Always below most recent swing low + 20 pips (strict risk management priority)
Trailing Stops: Activate at TP2—trail with 30-40 pips buffer for 4H+ trades (lock in profits)
Breakeven Exit: Move stops to entry after 1:1 risk/reward achieved—eliminate emotional trading
Partial Profit Strategy: Close 25% at TP1 | 25% at TP2 | 25% at TP3 | Let 25% run to TP4 (maximize winners)
## 🔔 REVERSAL & BREAKOUT RECOGNITION CHECKLIST
### REVERSAL SIGNALS TO MONITOR:
RSI positive divergence (lower price lows, higher RSI lows) = bullish reversal setup high probability
Candlestick engulfing patterns at support/resistance zones = trend reversal confirmation strong signal
Volume profile breakdowns (declining volume on breakout attempts) = false move warning immediate
Ichimoku Cloud rejection (price fails to penetrate cloud layer) = structural resistance confirmed
Harmonic pattern completion at exact PRZ = reversal zone probability increases significantly
Elliott Wave 5th wave failure (truncation) = impulse completion = reversal imminent trigger
Gann angle break through significant angle = trend line break = reversal trigger activated
### BREAKOUT CONFIRMATION RULES:
Close beyond resistance with >50% volume surge above average = confirmed breakout signal strong
RSI crosses above 60 for bullish breakout, below 45 for bearish breakout confirmation
VWAP alignment with directional move = institutional participation confirmation strong
Bollinger Band breakout with band expansion (squeeze release) = volatility expansion confirmed immediate
Multiple timeframe confluence (5M + 15M + 1H + 4H aligned) = highest probability setup attainable
Ichimoku Cloud break (price clears all clouds with bullish candles) = strong continuation signal
Volume imbalance (ask volume > bid volume) = directional sustain likelihood increases significantly
## 💡 WEEK FORECAST SUMMARY - NOV 10-14
Monday (10th): 🌍 Consolidation continuation near 1.1650-1.1700 zone. Range-bound trading anticipated. Early breakout direction watch crucial. Entry setups favor reversal plays at support zones.
Tuesday-Wednesday (11-12th): 📈 Prime breakout window opens —1.1760 represents key decision point. Expect 100-200 pips daily volatility. Breakout confirmation targets 1.1820-1.1900 extension. This is the optimal swing trade window all week. ECB speakers watch critical.
Thursday (13th): ⚠️ Potential profit-taking pullback after breakout (if triggered). Support retest of 1.1780-1.1720. Buying opportunity if pullback holds above 1.1700.
Friday (14th): 📊 Weekly close pattern formation critical. Extension run anticipated if above 1.1800. If above 1.1850 = week target 1.1950-2.0000 achieved. End-of-week positioning for next week.
## 📍 CRITICAL CONFLUENCE ZONES - KEY TARGETS
1.1450-1.1500: Major support zone (accumulation marker, Wyckoff spring area, structural hold)
1.1550-1.1650: Secondary support (EMA 9, demand cluster, psychological level, volume POC)
1.1680-1.1710: Micro-resistance cluster (consolidation squeeze zone, early breakout resistance)
1.1750-1.1800: KEY BREAKOUT ZONE (triangle apex, harmonic confluence, all timeframe resistance)
1.1800-1.1900: Primary upside target (Elliott Wave 5, daily Band upper, measured move extension)
1.1900-1.1950: Secondary extension target (Gann level, macro resistance, wave projection)
1.1950-2.0000: Weekly/monthly target (if wave 5 impulse extends beyond base projections)
## 🏆 RISK MANAGEMENT RULEBOOK
✅ 1) Position Sizing: Never risk >2% of account equity per single trade
✅ 2) Risk-Reward Ratio: Minimum 1:2.5 R/R on every entry—1:3+ preferred for swing trades
✅ 3) Profit Scaling: Close 25-50% at 1:1 ratio, let remainder run to 1:2+ targets
✅ 4) Stop Loss Discipline: Place stop IMMEDIATELY on entry—no exceptions (20 pips tight)
✅ 5) Breakout Confirmation: Avoid FOMO—wait for candle close confirmation + volume surge always
✅ 6) Daily Support Respect: Psychological holds (round numbers 1.1600 | 1.1800) matter—trade confluence not against
✅ 7) Time Management: Exit losing trades quickly (max 1:0.5 acceptable for educational losses)
✅ 8) Macro Alignment: Always check daily/4H bias before taking 1H or lower trades
## #EURUSD #EUROUSD #FOREXTRADING #EURUSDANALYSIS
#TECHNICALANALYSIS #ELLIOTTWAVE #HARMONICPATTERN #BREAKOUTTRADING
#SWINGTRADER #DAYTRADING #INTRADAY #FOREXANALYSIS #TRADINGVIEW
#BOLLINGER BANDS #RSI #ICHIMOKU #VWAP #TRADINGSTRATEGY
#WYCKOFFMETHOD #GANNTHEORY #DOWTHEORY #TECHNICALS #ANALYSIS
#SUPPORTANDRESISTANCE #VOLUMEANALYSIS #OVERBOUGHT #OVERSOLD #REVERSAL
#FOREXTRADERS #CURRENCYTRADING #BREAKOUTSETUP #TRADERSOFTWITTER
#TECHNICALTRADER #CANDLESTICK #PATTERRECOGNITION #CHARTANALYSIS #DAYTRADER
## 🎁 BONUS: DAILY PRE-MARKET CHECKLIST
Use this every morning before market open:
☑️ Check daily RSI (should be 60-72 for bullish bias continuation)
☑️ Identify support/resistance zones (1.1600 | 1.1700 | 1.1760 | 1.1900)
☑️ Verify 4H chart alignment (pennant/IH&S pattern status update)
☑️ Check Ichimoku cloud position (above/below = trend confirmation signal)
☑️ Review 1H Elliott Wave count (which wave are we trading exactly?)
☑️ Scan volume profile (POC = likely rejection zone area)
☑️ Set entry orders + stop losses BEFORE Asian session closes
☑️ Plan 3 Take Profit levels before entering any position
☑️ Monitor ECB/Fed speakers + economic calendar (interest rate expectations)
## 🌐 FOREX SESSION NOTES
EUR/USD trades 24/5 across all sessions . Highest volatility typically occurs:
Asian Session (22:00-8:00 UTC): Lower volatility—good for breakout setups forming
London Session (8:00-16:30 UTC): Prime trading hours —peak liquidity + volatility combination
NY Session (14:30-21:00 UTC): Secondary volatility surge—often confirms London direction
ECB/Fed Policy Impact: Monitor policy divergence—higher Fed rates support USD weakness = EUR strength
💡 Disclaimer: This technical analysis is educational only. Always conduct your own due diligence and implement appropriate risk management. Past performance does not guarantee future results. Trade responsibly within your risk tolerance. Use stop losses on every position. Not financial advice.
Analysis Created: November 8, 2025 | Valid Through: November 14, 2025 | Updated Daily

ETHFI – Potential Rebound from Major Support ZoneETHFI is currently testing a critical support zone between $0.60 and $0.80, a level that previously held strong during market corrections. Price structure appears to be respecting this level, and the RSI is nearing oversold territory, hinting at a possible momentum shift. This combination sets the stage for a potential bounce if current conditions hold.
🔹 Trade Idea Setup
📌 Entry Zone: $0.60 – $0.80
🎯 Take Profit Targets:
• TP1: $1.90
• TP2: $2.90
🛑 Stop Loss: $0.18
This setup presents a favorable risk-reward ratio, with entry at support and clearly defined targets. RSI signals are adding confluence, but always watch for volume confirmation and broader market behavior.

Bitcoin’s price is at one of its most critical moments yet!👋🏻 Hey everyone! Hope you’re doing great! Welcome to SatoshiFrame channel.
✨ Today we’re diving into the 4-Hour Bitcoin analysis. Stay tuned and follow along!
👀 On the 1-hour timeframe of Bitcoin, we can observe that after failing to break above its key resistance zone, BTC moved toward the multi-timeframe lows. Losing those lows created a selling pressure, pushing the price to retest its fundamental support levels. Currently, I’ve identified two critical zones in my analysis — a breakout from either one could provide a solid trading opportunity.
⌛ Bitcoin’s volume shows a strong bias toward sell positions, to the point where buyers are barely preventing the higher timeframes from entering oversold conditions. However, if this selling pressure and volume persist, Bitcoin could break the lower boundary of its recent daily range and continue downward. Volume data gives us the best insight into market behavior, allowing us to build effective scenarios.
✍️ There are two potential scenarios for Bitcoin that I’ll briefly summarize below — both can be used as setups for positioning.
🟢 Long Scenario: If Bitcoin breaks above the resistance zone at $108,072, completes a pullback, and shows an increase in buying volume with momentum entering the market, we can open a long position. This setup looks somewhat risky, so it’s better to enter with a smaller position size. The best trigger for a long entry is located around $111,180.
🔴 Short Scenario: If Bitcoin breaks below the key support level at $105,732, it could offer a short position setup — provided that selling pressure and bearish momentum continue. After the breakdown, we’ll need to wait for a pullback before entering the trade.
❤️ Disclaimer : This analysis is purely based on my personal opinion and I only trade if the stated triggers are activated .

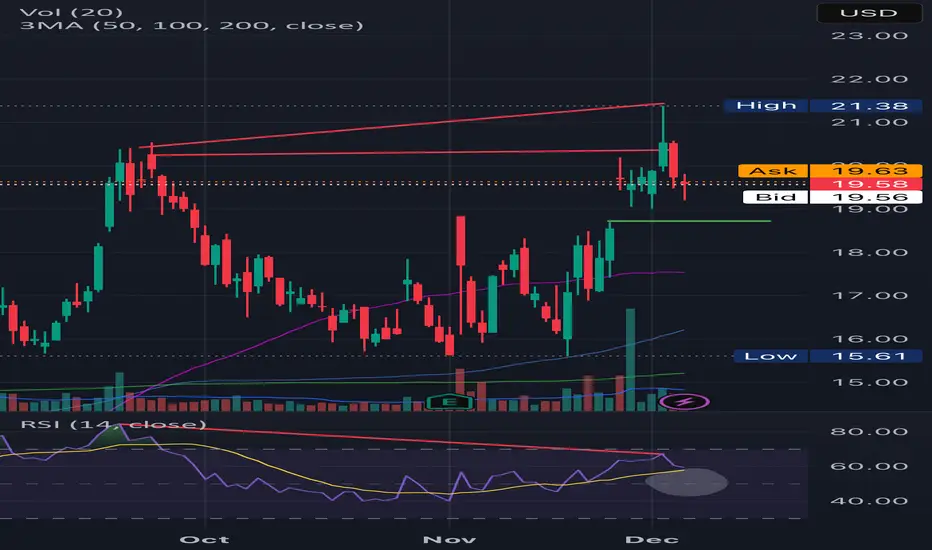
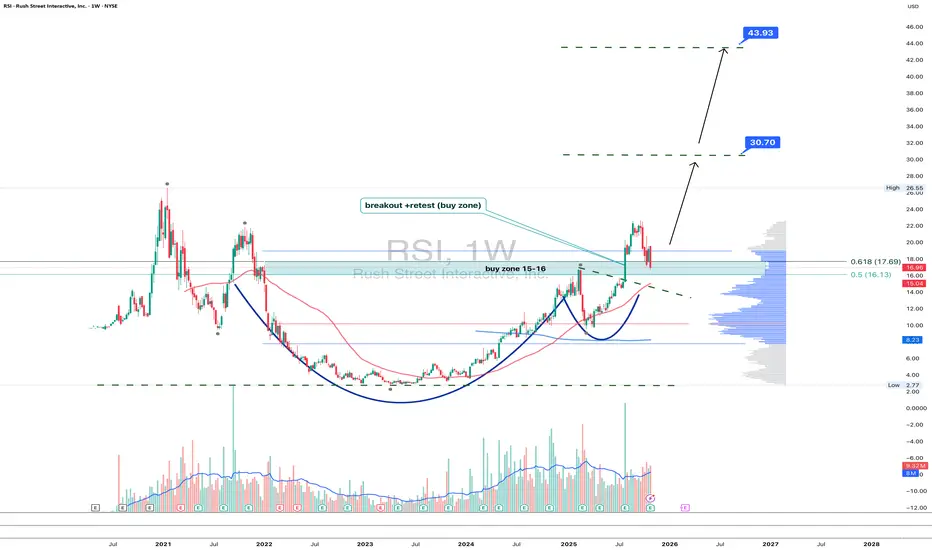
RSI 1W - gambling or smart retest?Rush Street Interactive (RSI) just confirmed a breakout above the 15–16 zone with a textbook retest - a classic bullish setup. The weekly chart shows a clean “cup and handle” structure backed by rising volume. Current pullback is forming right inside the buy zone, suggesting potential continuation.
Fibonacci extensions highlight 30.7 and 43.9 as key upside targets. As long as price holds above 15.5–16.0, the bullish bias stays intact. A breakout above 18.0 would confirm the next leg higher.
Fundamentally , RSI benefits from ongoing online gambling legalization across the US and improving profitability in core states, which could attract institutional inflows.
In the gambling world, luck rarely repeats - but this chart looks like the house might finally lose.
Has Bitcoin already priced in its next move ? | Day 56☃️ Welcome to the cryptos winter , I hope you’ve started your day well.
⏰ We’re analyzing BTC on the 1-Day timeframe .
👀 Bitcoin on the daily timeframe. After the flash crash it experienced, Bitcoin is almost building a box with a top at $114,559 and a bottom at $106,431, which by breaking these areas, it can get out of this trading range and give us a position.
The noteworthy point in the recent days is the Monday meeting between Trump and the President of China, which can determine the destiny of the market and give it a good direction.
🧮 The RSI oscillator, two key zones have formed for us in the areas of 54.5 and 36, and by the fluctuation limit crossing these areas, the next move of Bitcoin can begin.
🕯 Bitcoin’s volume on the daily timeframe has increased sharply after recording a new all-time high, and this has been a tendency toward increasing selling pressure. In the image, it is completely clear that you can see exactly what happened to the market after the flash crash it experienced.
📈 To take a position with this structural style that we currently have, you can refer to the multi-timeframe analysis of Bitcoin and extract the long and short position triggers, and if Bitcoin gives you an entry, enter the position around the anticipated top or bottom with low risk so that later you can add more volume to your position at higher or lower levels.
❤️ Disclaimer : This analysis is purely based on my personal opinion and I only trade if the stated triggers are activated .

#ZECUSDT #1D (ByBit) Rising wedge near breakdownZcash had a great bull run but looks exhausted right now on daily TF.
It's printing a bearish divergence between price and volume + RSI, a retracement seems likely.
⚡️⚡️ #ZEC/USDT ⚡️⚡️
Exchanges: Bitget Futures
Signal Type: Regular (Short)
Leverage: Isolated (3.0X)
Amount: 3.9%
Current Price:
353.99
Entry Zone:
355.71 - 392.39
Take-Profit Targets:
1) 298.48
2) 241.58
3) 184.67
Stop Targets:
1) 437.28
Published By: @Zblaba
CRYPTOCAP:ZEC BYBIT:ZECUSDT.P #1D #Zcash #Privacy z.cash
Risk/Reward= 1:1.2 | 1:2.1 | 1:3.0
Expected Profit= +60.6% | +106.2% | +151.9%
Possible Loss= -50.7%
Estimated Gaintime= 1-2 months

$GOLD is COOKED! Rotation into $BTC Soon!!MARKETS ARE SIGNALING RISK-ON 🔥
TVC:GOLD is so unbelievably COOKED 👨🍳
3 Black Crowes printed on the Daily, with a decisive close below the 20MA 🗡️
Waiting on the final nail in the coffin to close below the DANGER ZONE ~$3,900 where we will then see GOLD retest the 50MA along with the 50% Gann retrace $~3,750 ⚠️
I very much expect the rotation into CRYPTOCAP:BTC soon 👑

XAUUSD Weekly Technical Forecast: Deep Dive AnalysisTraders, gear up for a pivotal week in Gold! As of the close at 4,112.84 on Oct 25th , XAUUSD is at a critical juncture. This analysis blends classic theory with modern indicators for intraday swings and positional trades. Bulls and bears are in a fierce battle ⚔️.
The stage is set for a significant volatility expansion. The key is to identify the dominant auction.
🎯 1D & 4H: The Swing Trade Panorama (Swing Bias)
The higher frames dictate the primary trend. The 1D chart shows a potential completion of an Elliott Wave corrective pattern (ABC) , suggesting a new impulsive wave up may be imminent.
Dow Theory : Higher highs & higher lows remain intact on the 1D, confirming the primary uptrend. ✅
Wyckoff Theory : We appear to be in a 'Spring' or 'Sign of Strength' phase after a re-accumulation period around the 4,080-4,100 zone.
Ichimoku Cloud : Price is trading above the Kumo (cloud) on 1D, a bullish bias. The Tenkan-sen (blue line) is a key dynamic support.
Key S&R : Major support rests at 4,080 (previous resistance, 50 EMA). Resistance is at the recent high of 4,140 .
A decisive 4H close above 4,130 could trigger a Bullish Breakout 🚀 targeting 4,180-4,200. Conversely, a break below 4,080 on high volume could see a drop to 4,040.
⏰ Intraday Focus: 1H, 30M, 15M, 5M (Intraday Bias)
For intraday action, lower timeframes offer precision entries.
Harmonic & Gann Theory : A clear Bullish Bat Pattern has potentially completed on the 1H chart. The PRZ (Potential Reversal Zone) aligns perfectly with the 4,100-4,105 support. Gann's 50% retracement level from the last swing up also converges here.
Bollinger Bands (20,2) : On the 1H/4H, price is hugging the upper band, indicating strong momentum. A squeeze on the 30M chart suggests a volatility expansion is due.
RSI (14) : On the 1H, RSI is in the 55-60 range, showing healthy momentum without being overbought. Watch for bearish divergence on a new high as a reversal signal.
VWAP & EMA Confluence : The 20 and 50 EMAs are providing dynamic support on pullbacks. For day trades, the VWAP on the 15M/5M charts will be your best friend for trend alignment. Long above, short below.
🚦Trade Plan: Entries, Exits & Risk Management
Identifying reversals is key. Use Japanese Candlesticks at key S&R levels. A bullish engulfing or morning star pattern at the 4,100 support, confirmed by a rising volume spike, is a high-probability long signal.
Swing Long Entry : On a 4H close > 4,130, or a pullback to 4,100-4,105 with bullish confirmation.
Swing Short Entry : On a 1D close < 4,080, targeting 4,040.
Intraday Long : Buy on a bounce from VWAP/20 EMA on the 15M chart with RSI > 50.
Intraday Short : Sell on a rejection from the 4,125-4,130 resistance with a bearish RSI divergence.
Stop-Loss : Always 15-20 pips below/above your entry trigger candle.
💡The Bottom Line:
The bullish structure is favored as long as 4,080 holds. The confluence of Harmonic patterns, Wyckoff accumulation, and bullish Ichimoku alignment points to a potential leg higher. However, respect the levels. A break below support will invalidate the bullish thesis.
Track these charts live:
1D:
4H:
1H:
30M:
15M:
5M:
⚠️ Disclaimer: This post is educational content and does not constitute investment advice, financial advice, or trading recommendations. The views expressed here are based on technical analysis and are shared solely for informational purposes. The stock market is subject to risks, including capital loss, and readers should exercise due diligence before investing. We do not take responsibility for decisions made based on this content. Consult a certified financial advisor for personalized guidance.

Bitcoin is now positioned below its main resistance! | Day 10👋🏻 Hey everyone! Hope you’re doing great! Welcome to SatoshiFrame channel.
✨ Today we’re diving into the 1-Hour Bitcoin analysis. Stay tuned and follow along!
👀 Bitcoin has still not succeeded in breaking the resistance zone at $111,458. However, Bitcoin formed a higher low compared to its previous low, which increases the probability of breaking this resistance and gives it a higher win rate for a breakout.
🧮 Pay attention to the RSI oscillator. The 70 zone has maintained its overlap with Bitcoin just like yesterday, with the difference that the RSI support zone is now in the 45 range, which also overlaps with the newly formed higher low.
💰 Bitcoin’s volume in the 1-hour time frame has increased after forming a higher low, meaning this low is being respected by buyers, and the desire to break multi-timeframe resistances has increased. Breaking the current resistance zone requires strong buying volume so that sell orders are filled and some futures orders get liquidated.
✍️ The expected scenario for Bitcoin does not differ significantly from yesterday’s scenario.
🟢 Long Position Scenario
Break the key resistance at $111,458, surpass the 70 level on RSI and enter overbuy territory, accompanied by increased buying volume and a price squeeze.
❤️ Disclaimer : This analysis is purely based on my personal opinion and I only trade if the stated triggers are activated .

MET (Meteora) - TGE 15m FA/TA, Levels & RiskBias: short-term neutral>bullish if 0.581 holds; mid-term neutral.
Market read:
BTC ≈ $110.6k, ETH ≈ $3.88k, SOL ≈ $193.1. Risk tone modestly positive.
DXY ≈ 99.0; USD/JPY ≈ 152.6; SPY ≈ 671.8; UST 10Y ≈ 4.00%. Liquidity backdrop acceptable.
MET status (T+~13h)
Price ≈ 0.58 with intraday reclaim attempts. Day-one range ~0.516–0.687. Fib from H→L: 0.552 (0.236 up from L), 0.577–0.581 cluster, 0.601, 0.621, 0.646. Your 5–15m charts show RSI>70, MACD crossing up, TRIX rising, DEMA≈0.581 acting as pivot. Expect supply near 0.581/0.597 and heavy inventory 0.55–0.58.
Levels:
Support: 0.566 → 0.559 → 0.545 → 0.515.
Resistance: 0.581 pivot → 0.597–0.601 → 0.621 → 0.646.
Setups and risk (1m/5m/15m/30m)
• Break-retest long: Confirm a 5–15m close ≥0.581, then entry on retest 0.573–0.581. SL 0.566. TP1 0.597–0.601, TP2 0.621, TP3 0.646.
• Fail-reclaim short: If rejection at 0.581 with RSI>75 and waning volume, short perps only; SL 0.586; TP 0.565 then 0.559.
• 30m bias flip: Two consecutive closes ≥0.581 with rising volume/OBV shift bias to constructive; below 0.566 momentum stalls back to 0.559–0.545.
• Execution: post-only limits on Jupiter/Meteora, slippage ≤0.5%. Risk ≤1R per attempt.
FA + flow:
Day-one unlock and broad venue access create two-sided flow; watch Solana beta and CEX listings for impulse. MET’s microcap relative to SOL/JUP/ME/GRASS implies higher variance; treat 0.581 as line-in-the-sand for continuation.
Plan:
If you are flat: only engage on 0.581 hold. If long from lower: trim 25–50% into 0.597–0.601, trail to 0.569, run remainder for 0.621/0.646. If 0.566 breaks on volume, step aside and reassess near 0.559/0.545.
Outlook:
bullish above 0.581 and strengthening into 0.601; neutral-to-bearish on failures back under 0.566.
For educational purposes; not financial advice.

EURCAD - Bounce Play at the Rail!EURCAD has been respecting its ascending channel beautifully , bouncing between the rails like clockwork. And right now, price is once again retesting the lower trendline, where buyers have consistently stepped in before launching new bullish waves.
🏹As long as this trendline and minor support around 1.62 hold firm, I’ll be watching closely for bullish rejections or reversal patterns to confirm a fresh leg upward. A clean bounce from here could send price back toward the orange structure zone around 1.6350, followed by a potential push toward 1.64+ if momentum builds up.
⚔️However, a break and close below 1.6180 would invalidate the setup and could shift control back to the bears — but until that happens, the path of least resistance remains to the upside.
In short, I’m expecting EURCAD to trap late sellers and fuel another rebound from the channel’s base, the kind of move that rewards patience and precision.
📊 All Strategies Are Good; If Managed Properly!
~Richard Nasr
