NIFTY,BANKNIFTY,S&P 500 – Correction Unfolds, Volatility ReturnNifty closed the week at 25,683, sharply down ~650 points from the previous week. The index formed a high of 26,373 and a low of 25,623, confirming that trending moves have returned after the holiday season—exactly as anticipated.
The previously defined 26,700–25,900 range has been decisively breached, with price taking temporary support near the 25,600 zone.
Technically, Nifty has printed a strong bearish outside bar, engulfing the entire price action of the last 7 weeks—a clear sign of distribution and momentum shift.
25,600 – Acceptance vs Rejection Zone
This level will decide the next swing:
Acceptance above 25,600 (higher lows / stable closes) → scope for a technical pullback
Repeated rejection below 25,600 → continuation of the corrective move
Pullback Scenario (Corrective Bounce)
If Nifty manages to hold above 25,600, a bounce towards:
26,000
26,150
These zones should be treated as supply / short-on-rise areas, not fresh breakout levels.
Downside Risk (Continuation)
If 25,600 fails on a closing basis, next supports lie at:
25,400
25,250
Expected Trading Range (Next Week):
26,150 – 25,250
Bigger Picture – Why Caution Is Warranted
As highlighted in my 27th December post, Nifty was trading at extremely overbought levels on the yearly chart, signaling an impending correction.
What adds to the concern is that the December low has already been broken this month. As long as this remains the case, any bounce should be treated as corrective, not a trend reversal.
This phase resembles a healthy corrective reset after momentum excess, not a structural bear market—yet volatility will stay elevated.
Investor Strategy – Build the Shopping List
Corrections create opportunities.
This is the right time to track fundamentally strong stocks and names where smart money (FII & DII) is steadily increasing exposure.
During recent scans, I’ve identified multiple stocks trading near:
Monthly EMA 200
Weekly WEMA 200
These zones often act as high-probability accumulation areas.
I’ve started building my shopping list—have you?
BANK NIFTY – RELATIVE WEAKNESS EMERGES
Bank Nifty, the most volatile index of the Indian market, failed to sustain above the crucial 60,092 Fibonacci level and closed at 59,251, down nearly 900 points for the week.
This relative underperformance is a warning sign—sustainable Nifty recoveries need bank participation.
Downside Levels:
Daily close below 59,000 →
DEMA 100 at 57,865
DEMA 200 at 56,250
Upside Cap:
Near-term upside remains capped at 60,200–60,300
S&P 500 – ATH CONTINUES, TRAIL PROFITS STRICTLY
The S&P 500 closed at a fresh all-time high of 6,966, with momentum pointing towards the key Fibonacci level of 7,026.
Risk Management for US Market Participants:
Trailing stop-loss:
Consecutive daily close below 6,826, OR
A confirmed close + follow-through below DEMA 100 (6,687)
This helps avoid single-day whipsaws near moving averages.
Bonus Tip for Nifty Traders
Trail existing short positions
26,000 remains a strong supply zone and can be used to initiate fresh shorts on pullbacks
Rsioverbought

SUI M30 RSI Exhaustion and Bearish Pullback Setup📝 Description
SUI on M30 just ran hard into HTF supply, but RSI has exited the overextension zone and is rolling over, which usually signals momentum exhaustion. That tells me buyers are losing strength, so a bearish pullback is likely to rebalance toward the nearby imbalances below.
________________________________________
📈 Signal / Analysis
Primary Bias: Bearish pullback while below 1.535
Short Setup (Reactive):
• Entry (Sell): 1.520–1.530 (HTF supply reaction)
• Stop Loss: Above 1.535
• TP1: 1.5025
• TP2: 1.4822 (30M FVG)
• TP3: 1.4578 (deeper FVG / liquidity)
________________________________________
🎯 ICT & SMC Notes
• Price tapped HTF OB / supply
• RSI rolling over after leaving overextension zone
• FVG 30M below as downside magnet
________________________________________
🧩 Summary
After a big run, RSI is basically saying “enough.” While price stays capped under supply, odds favor a controlled drop toward 1.50 then 1.48. If weakness persists, 1.45 becomes the next clean draw.
________________________________________
🌍 Fundamental Notes / Sentiment
Alts are still reactive and prone to quick rotations. Without a fresh catalyst, these premium rejections often resolve with a pullback into liquidity and imbalance.
________________________________________
⚠️ Risk Disclosure
Trading involves substantial risk and may result in capital loss. This analysis is for educational purposes only and does not constitute financial advice. Always apply proper risk management, predefined stop-loss levels, and disciplined position sizing aligned with your trading plan.

Weekly Market Outlook – Nifty, BankNifty & S&P500 AnalysisNifty 50 wrapped up the week at 26042, gaining +76 points from last week’s close after hitting a high of 26236 and low of 26008. As highlighted earlier, the index continues to trade within my broader zone of 26500–25400, showing no decisive breakout yet. This week’s Gravestone Doji candle formation signals buyer exhaustion and potential weakness, with price closing near the weekly lows — never a great sign for bullish momentum.
With FII participation still muted due to holiday season and India VIX resting at a calm 9.15, volatility may stay compressed, suggesting range-bound or slow movement in the coming week unless major triggers appear.
Nifty Weekly Range Expectation: 26400–25700
A breakout beyond this range may bring sharp moves (“fireworks”) in either direction.
For upside continuation, Nifty must close above 26200 for two consecutive sessions, which could open targets toward 26277 / 26325 / 26400.
BankNifty Outlook
BankNifty ended at 59011, down just -50 points, but importantly closed near the weekly low, hinting at possible sell pressure ahead. If weakness persists, we may see tests of key supports:
Support Levels: 58700 / 58300 / 57600
Break of these zones can drag Nifty along with it.
For bulls to reclaim control, we need a sustained close above 59300, which may drive a move toward 59755 / 60000.
Expected Range: 59900–58200
Global Cue – S&P 500 Breaks Out to New All-Time Highs
S&P500 delivered a powerful move this week, breaking above the 6882 resistance and closing at an all-time high of 6930. The chart structure suggests a march toward the next Fibonacci level at 7026. However — monthly timeframe RSI is nearing the overbought zone, which historically calls for caution, trailing stop-losses, or partial profit booking for US equity investors.
Historical Reminder for Long-Term Investors
Nifty’s yearly RSI previously hit 91 only once before — Jan 2008.
Within months, the market corrected over 60% from the highs.
Today again, RSI on yearly frame is heating up. Coincidence or caution?
History doesn’t repeat, but it often rhymes.
Key levels to watch in 2026 based on price behaviour around yearly candle:
🔻 Break below December low → a deeper correction could unfold
🔼 Break above December high → Nifty may climb toward 27824/29156 before any major decline
Markets reward those who prepare – not predict.
Final Take
Nifty & BankNifty locked in range → wait for break + confirmation
Volatility low = breakout moves may be strong when they come
S&P500 bullish but nearing overbought territory
Keep risk management tight, trail profits & prepare for both outcomes
Is history about to repeat?
We’ll know soon — until then, stay alert, stay hedged, and stay disciplined.

Long Term Silver Bull Going ShortThis post is a follow up to my "Grand Silver Supercycle" chart posted on 2/2/2023. I recommend referencing that chart to understand my commentary here. In that chart, I called for silver to double in price by the end of 2025 and to reach $95 by 2027. Since then, silver has overshot my near term price targets. I'm here to argue that silver has gone up too far too quickly and is due for a sharp pullback to the $50-$55 range.
Why am I calling this the near term top?
Silver has very neatly followed Elliot Wave Theory throughout its history. In 2023, I predicted Wave 3 of the current cycle, which began with the low in the summer of 2022, to have a 1.618 extension of Wave 1. Instead, silver just reached the 2.618 extension, which back in 2023, I thought was too bold of a prediction. While it is possible for a 4.618 extension to 102.5, these extensions are very rare. The bias is towards a pullback here.
There is also a convergence between the Elliot Wave extension, a fib retracement level, and logarithmic trendline. This indicates that any attempts to breakout higher will face strong resistance.
Finally, I need to talk about gold. The monthly RSI has been over 90 for 3 months, closing in on 4 months. Gold has only held an RSI above 90 for 4 consecutive months at one point prior in its charted history. Gold is still silver's big brother and will determine the direction the two move.

LULU Analysis | Crucial Support & Resistance Before EarningsIn this video, I break down a complete Lululemon (LULU) stock analysis ahead of its upcoming earnings.
You’ll learn the key support & resistance levels, expected volatility zones, and the technical signals that matter most.
🔍 What’s Inside the Video:
Lululemon’s current trend & momentum
Technical breakdown (chart pattern + volume + indicators)
Key support & resistance levels to watch
Earnings expectations & potential price reactions
Upside and downside targets
Risk zones and invalidation levels
Short-term and swing-trade ideas
📈 Why This Matters
LULU earnings often create huge price swings.
This video gives you a clear, actionable view of how the stock might react and what levels traders should focus on.

What's the point of buying now ?Gold is overbought at levels which is basically not seen in modern history. Being long right now makes no sense. I'm personally short.
Disclaimer: I've been a gold bug all these years

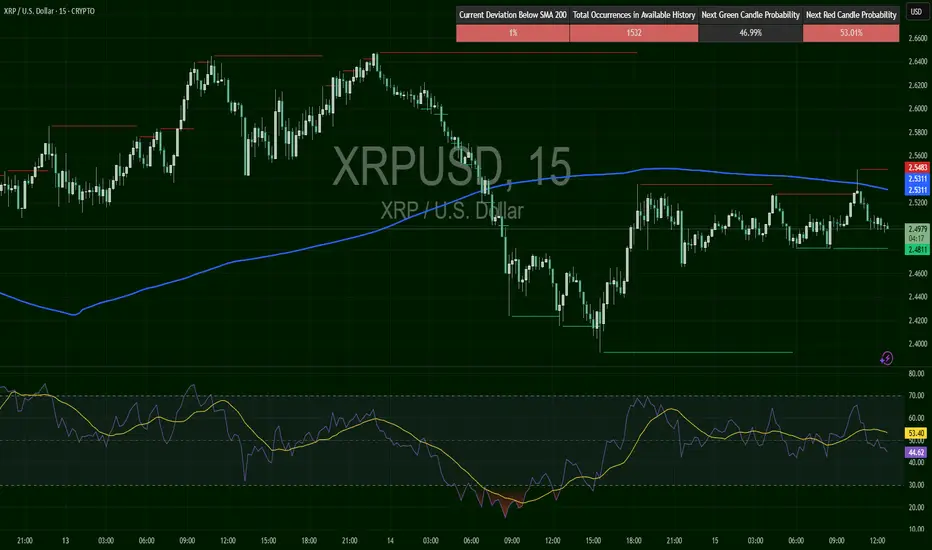
XRP/USD – Compression Beneath the Trendline📉 Bias: NEUTRAL-to-SHORT
XRP trades near $2.50, consolidating just under the SMA200 ($2.53) after momentum cooled from the $2.55 zone. RSI at 48 signals balance, but repeated failures at resistance tilt risk lower.
A close below $2.48 may trigger continuation toward $2.42, while a break above $2.55 invalidates the short setup.
📊 Key Levels:
Resistance: $2.53 / $2.55 / $2.62
Support: $2.48 / $2.42
How to Use The Relative Strength Index (RSI) in TradingViewMaster RSI using TradingView’s charting tools in this comprehensive tutorial from Optimus Futures.
The Relative Strength Index (RSI) is one of the most widely used momentum indicators in technical analysis. It helps traders identify potential overbought and oversold conditions, spot divergences, and confirm the strength of trends.
What You’ll Learn:
Understanding RSI: a momentum oscillator plotted from 0 to 100
Key thresholds: how readings above 70 suggest overbought conditions and below 30 suggest oversold conditions
Why RSI signals are not automatic buy/sell triggers, and how strong trends can keep RSI extended for long periods
Spotting bullish and bearish price divergences
Using RSI to confirm trends
How to add RSI on TradingView via the Indicators menu
Understanding the default inputs and how changing them affects the indicator
Example on the E-mini S&P 500 futures: how RSI dipping below 30 and crossing back above can highlight momentum shifts
Combining RSI with other analysis for better confirmation
Practical applications across multiple timeframes, from intraday trading to swing setups
This tutorial will benefit futures traders, swing traders, and technical analysts who want to incorporate RSI into their trading strategies.
The concepts covered may help you identify momentum shifts, potential reversal points, and confirmation of trend strength across different markets
Learn more about futures trading with TradingView:
optimusfutures.com
Disclaimer:
There is a substantial risk of loss in futures trading. Past performance is not indicative of future results. Please trade only with risk capital. We are not responsible for any third-party links, comments, or content shared on TradingView. Any opinions, links, or messages posted by users on TradingView do not represent our views or recommendations. Please exercise your own judgment and due diligence when engaging with any external content or user commentary.
This video represents the opinion of Optimus Futures and is intended for educational purposes only. Chart interpretations are presented solely to illustrate objective technical concepts and should not be viewed as predictive of future market behavior. In our opinion, charts are analytical tools—not forecasting.

Gold's Gann Square of 4 analysis. 21/Sept/25 XAUUSD monthly water RSI bills almost "boiling" at 88.96 "degree".. What do you think should it "cooling" down a bit?..

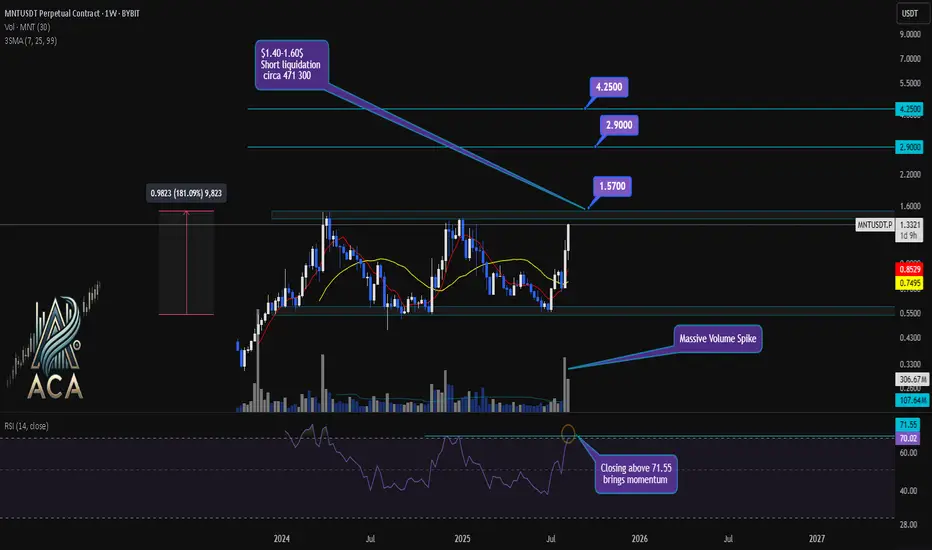
MNTUSDT Weekly Chart Analysis | Momentum & Key Targets UnveiledMNTUSDT Weekly Chart Analysis | Momentum & Key Targets Unveiled
🔍 Let’s dive into MNTUSDT perpetual contracts and decode the current price action, focusing on order flow, volume, liquidations, and momentum for top trading setups.
⏳ Weekly Overview
The weekly chart shows MNTUSDT surging out of a prolonged consolidation box, supported by a massive volume spike. This breakout is adding significant bullish momentum, as the RSI closes above the 71.55 level — a classic signal for trend acceleration and institutional interest.
🔺 Key Bullish Setup:
- Consolidation Box Break: Closing above the $1.57 level marks a safe entry; the order book above is lighter, giving price more freedom to move.
- Short Liquidation Cluster: Between $1.40-$1.60, nearly 471,300 MNT shorts are set for liquidation. Once price pushes through, liquidity fuel could trigger rapid upside.
- Upside Targets: Next objectives are $2.90 (approx. 90% up) and $4.25 (approx. 180% from the breakout), perfectly aligning with RR1 projections out of consolidation.
- Volume & Momentum: A massive volume influx supports the move, and RSI bolting past 71.55 on weeklies brings undeniable momentum.
📊 Order Flow & Futures Netflow:
- CoinGlass Futures Netflow: Recent statistics point to a healthy net inflow for MNT after a period of outflows, reflecting renewed market interest and capital rotation into longs.
- Market Cap: $4.50B, cementing its presence among high-liquidity altcoins.
🚨 Conclusion:
Breaking the current consolidation box, backed by a huge volume spike and overbought weekly RSI, signals powerful momentum. The $1.57 level offers a low-risk entry, and clearing short liquidation pockets between $1.40-$1.60 could send MNT to $2.90 and $4.25 in quick succession. Order book dynamics favor further upside, especially as resistance thins above $1.57.
Stay sharp, watch volume and RSI, and monitor liquidations for confirmation of the bullish continuation.
CPOOLUSDT Daily Chart Analysis | Momentum Surge & Key TargetsCPOOLUSDT Daily Chart Analysis | Momentum Surge & Key Targets
🔍 Let’s dive into the CPOOL/USDT 1D chart and break down the latest price action that’s catching attention, with an eye on bullish setups and critical zones.
⏳ Daily Overview
The chart shows a dynamic breakout above the accumulation box (range), with price riding a clear yellow trendline and volume spiking hard — classic momentum signals. RSI is entering the overbought zone, which confirms surging buying interest and the possibility for rapid moves.
🔺 Long Setup:
- The breakout from the range box suggests accumulation and fresh interest. Immediate upside looks at the mid-range target of $0.26010.
- Next, if momentum holds, price could rally towards $0.34350, which lines up with the risk-reward (RR1) from the box.
- Sustained momentum and continued volume spikes could unlock even higher targets beyond these levels.
📊 Key Highlights:
- Yellow trendline supports the move, tracking bullish sentiment.
- Volume spikes show real participation — this isn’t a low-liquidity fakeout.
- RSI entering the overbought zone is a momentum engine, but keep an eye out for possible pullbacks or cooling periods as price tests higher levels.
- Fake breakout earlier in the range now confirmed by the strong candle and volume surge.
🚨 Conclusion:
Momentum is accelerating. If buyers stay in control above current support, price could climb to the mid-box target of $0.26010, with $0.34350 as the next bullish destination. This setup favors longs as long as volume and trendline support remain intact. Aggressive momentum could push price even further — time to watch those critical resistance levels.

Deep Dive Into Relative Strength Index (RSI)The Relative Strength Index (RSI) is a momentum oscillator developed by J. Welles Wilder Jr. that measures the speed and magnitude of price changes.
Introduction
In the world of trading, timing is everything — and few indicators have stood the test of time like the Relative Strength Index (RSI). Introduced by J. Welles Wilder in 1978, the RSI is a momentum oscillator that helps traders evaluate the strength and speed of price movements. Whether you're trading stocks, forex, or crypto, understanding how RSI is calculated and how to interpret its signals can give you a critical edge.
In this article, we’ll break down exactly how the RSI works, explore its formula, and dive into practical ways you can incorporate it into your trading strategies. From spotting potential reversals to identifying overbought and oversold conditions, the RSI remains a cornerstone of technical analysis — but only if you know how to use it properly.
Let’s explore the mechanics and the mindset behind this powerful indicator.
What Is RSI and How Is It Calculated?
The Relative Strength Index (RSI) is a momentum oscillator that measures the speed and change of price movements over a defined period. It outputs a value between 0 and 100, which helps traders determine whether an asset is overbought or oversold.
The default RSI setting uses a 14-period lookback window and is calculated with the following steps:
🔷Calculate the average gain and loss over the last 14 periods:
Average Gain = Sum of all gains over the past 14 periods / 14
Average Loss = Sum of all losses over the past 14 periods / 14
🔷Compute the Relative Strength (RS):
RS = Average Gain / Average Loss
🔷Apply the RSI formula:
RSI=100−(100/(1+RS))
The result is a single number between 0 and 100 that indicates the asset's momentum.
How to Use RSI in Trading Strategies
⚡️Overbought and Oversold Conditions Strategy
RSI > 70 typically signals that an asset may be overbought and due for a pullback.
RSI < 30 suggests the asset might be oversold, potentially primed for a bounce.
However, these levels aren’t absolute sell or buy signals. In strong trends, RSI can stay overbought or oversold for extended periods.
📈Long Trading Strategy Example:
1. Identify the major trend, to find the long trades it shall be uptrend. On the screen below you can see 1D time frame for BITMART:BTCUSDT.P .
2. Move to lower time frame (in our case 4h) and find the moment when RSI falls below 30. This is our oversold condition and we are going to look for long trade.
3. Find the local support zone and open long trade.
4. Take profit when price reaches resistance level next to the previous swing high
5. Don’t forget to put initial stop loss when enter position. The best stop loss which will give you 3:1 risk to reward ratio.
📉Short Trading Strategy Example
1. Identify the major trend, to find the short trades it shall be downtrend. On the screen below you can see 1D time frame for BITMART:ETHUSDT.P .
2. Move to lower time frame (in our case 4h) and find the moment when RSI grows above 70. This is our overbought condition and we are going to look for short trade.
3. Find the local resistance zone and open short trade.
4. Take profit when price reaches support level next to the previous swing low
5. Don’t forget to put initial stop loss when enter position. The best stop loss which will give you 3:1 risk to reward ratio.
⚡️RSI Breakout Strategy
RSI is breaking through 60 indicating bullish momentum shift if the long-term trend is bullish can be the potential long signal
RSI is breaking down 40 indicating bearish momentum shift if the long-term trend is bearish can be the potential short signal
This strategy works great only on the trending market, don’t use it on the range bounded market to avoid whiplashes.
📈Long trading strategy example:
1. Make sure that long-term trend is bullish. Use 200 period EMA as its approximation. If price remains above it we can look for potential long trade setup.
2. If RSI crossed above the level 60 open long trade.
3. Put the initial stop-loss under the signal candle’s low.
4. Take profit when price reached 3:1 risk-to-reward ratio.
📉Short trading strategy example
1. Make sure that long-term trend is bearish. Use 200 period EMA as it’s approximation. If price remains below it we can look for potential short trade setup.
2. If RSI crossed below the level 40 open short trade.
3. Put the initial stop-loss above the signal candle’s high.
4. Take profit when price reached 3:1 risk-to-reward ratio. In our case we received very fast and profitable trade
⚡️RSI Divergence Strategy
RSI can be used also as a trend reversal indicator if we are looking for divergences. This is very reliable sign of current trend weakness and great opportunity open trade against the trend. Usually it’s not recommended, but in case if divergence can be applicable.
Bullish divergence is the situation when price created the lower low, while RSI made the lower low. Usually, it indicates that current downtrend is weakening and we can look for long trades
Bearish divergence is the situation when price created the higher high, while RSI made the lower high. Usually, it indicates that current uptrend is weakening and we can look for short trades
😎Important hint: it’s rarely covered in textbooks about technical analysis, but in our opinion it’s better to used divergences when RSI was able to cross level 50 between two lows/highs.
📈Long trading strategy example
1. Find at the chart situation, when the price made the lower low
2. At the same time RSI shall set the higher low
3. RSI shall break level 50 between these lows indicating shift to the bullish momentum
4. If price failed to set the clean breakdown open long trade on the candle which set the lower low. Put stop loss under it’s low
5. Take profit at 3:1 RR. When you master this concept, you will be able to have much more RR trades, even 10:1. This is possible because when trend finish you have the highest potential upside
📉Short trading strategy example
1. Find at the chart situation, when the price made the higher high
2. At the same time RSI shall set the lower high
3. RSI shall break level 50 between these highs indicating shift to the bearish momentum
4. If price failed to set the clean breakout open short trade on the candle which set the higher high. Put stop loss above it’s high
5. Take profit at 3:1 RR. When you master this concept, you will be able to have much more RR trades, even 10:1. This is possible because when trend finish you have the highest potential upside
Conclusion
The Relative Strength Index (RSI) remains one of the most powerful and flexible tools in a trader’s technical arsenal — but its real value lies in how you use it.
We’ve explored three key RSI strategies:
✅ Overbought/Oversold setups offer simple entry signals in ranging markets, where price tends to revert to the mean.
✅ Breakout strategies unlock RSI’s momentum-tracking potential, helping you ride strong directional moves with confidence.
✅ Divergence detection reveals hidden shifts in market sentiment, giving you an early warning of possible reversals or trend continuations.
Each approach has its strengths — and its risks — but together, they offer a complete framework for using RSI across different market conditions
🔑 Key Takeaways:
RSI is not just a “buy low, sell high” tool — it’s a multi-dimensional indicator that adapts to trends, momentum, and market structure.
The best RSI signals come from confluence: combining RSI with price action, support/resistance, volume, or trend filters like moving averages.
Patience and discipline are essential — RSI signals are only effective when paired with proper risk management and confirmation.
By mastering RSI beyond the basics, you'll be better equipped to make timely, confident, and informed trading decisions — whether you're entering a pullback, chasing a breakout, or spotting the early signs of reversal.
Bitcoin RSI Cooldown Before $88K? Key Support Levels to WatchBitcoin is showing strength towards the $88,000 mark, but the RSI on the 1-hour and 4-hour timeframes is significantly overbought, signaling the need for a healthy retracement.
I’m expecting CRYPTOCAP:BTC pullback to the RSI 50 midline, which could align with a price retrace to around $85,000–$83,000. If BTC loses the $85K level, FWB:83K comes next. A deeper retest could bring it back to $80K, which may serve as a high-conviction long zone.
Trading Plan:
Short scalp while RSI is overheated.
Long entries: $85,600 zone if structure holds.
Keep your eyes on volume and RSI reaction near key levels.

Dollar Vs INR: Dollar clearly Overbought as of now. Dollar Vs Rupee:
Dollar is at 87. Major breakout from the zone but one interesting point to note is the RSI. Relative Strength Index is above 90. Near 91 in fact. These are unsustainably overbought levels. We will see a proper deep correction there sooner than later. Once the Dollar starts to correct, Nifty will not remain bearish.
Anyone who understand RSI will tell you that Dollar is at unsustainable levels. India is the least effected compared to other currencies of emerging markets as well as developed nations. It is in the zone where sustaining itself that high will soon be impossible. That's why in the earlier message. I have written 1 to 4 weeks more pain for Indian markets.
Much also depends on policy announcements of Trump as he takes power. Back Channel diplomacy to avert further damage to India Inc., Might have already started...keeping my fingers crossed. Unreal times ahead. Long Term Vision For India looks unharmed. The dust will start settling in the next few weeks. We can expect dust to settle fully by end of this quarter. After which Bull run can recommence in my opinion.
Disclaimer: The above information is provided for educational purpose, analysis and paper trading only. Please don't treat this as a buy or sell recommendation for the stock or index. We do not guarantee any success in highly volatile market or otherwise. Stock market investment is subject to market risks which include global and regional risks. I or my clients might have positions in the stocks that we mention in our posts. We will not be responsible for any Profit or loss that may occur due to any financial decision taken based on any data provided in this message. Do consult your investment advisor before taking any financial decisions. Stop losses should be an important part of any investment in equity.

BTC Short Trade Opportunity and SetupBYBIT:BTCUSDT.P / BYBIT:BTCUSDT / CRYPTO:BTCUSD Bitcoin/BTCUSD has recently hit the resistance level of a pattern that has generally held true since mid March 24 (4 preceding resistance and support confirmations).
Furthermore, it has started a return downward move following on from a 3 day filter for confirmation of the resistance level (an example of how a 3/5 day filter is an important tool for crypto trading).
Additionally:
The RSI resistance level of 70 has been recently reached and the RSI is trending downwards - a usually statistically significant indicator
The downward return move is supported by reasonable (although not enough on it's own) volume
A 3 bar pattern (downward move, pause, further downward move for confirmation)
A rate of change approaching and trending negative
A MACD also approaching negative
It's always important to assess the risk that might prove the thesis wrong. And they are:
Today's candlestick pattern is close to a dragonfly, i.e. there might be a return upwards move imminent (although this is unlikely to constitute a beginning of a move beyond the previous high as an actual dragonfly candlestick is at the end of a downtrend)
The MACD is trending down but has not actually turned negative yet, i.e. it is a bit early to say this indicator is stating a downward trend
The ROC hasn't turned negative yet either (but is trending downwards for sure)
This all leads to the following conclusion: For those with a high enough risk appetite (and usually crypto traders are those with the highest :-)) this is a good entry point for a short trade.
Using the (admittedly early but still reasonable) trend for the past three days to determine the final take profit point of 45500 (blue arrow) by approx. 19 Nov 24, the following can be set as a guide for a trade:
Entry: Now or latest tomorrow in case today's candlestick is an indicator of a minor move upwards
SL: $70,500
TP1: $63,450 - based on the first potential moving average being a resistance (200 MA)
TP2: $60,500 - based on the previous move's consistent (and twice confirmed) low
TP3: $54,500 -based on a previous historic low (i.e. psychologically important price point) which also acts as a confirmation of support to a previous move
TP4: $45,500 - The approximate price point of an estimated downward trend
Exit date (independent of TP level): 19 Nov 24
NOTE: the 19 Nov date here is important. It is the forecasted date by which the current downward price trend would linearly reach the support level. This date would be used as a checkpoint to exit the entire trade to safeguard against the normal, usually dramatic and beyond rational calculation price gyrations of crypto.

Hanging Man and Doji Patterns in Focus!XAUUSD
2H Chart
Price: 2622.23
Hanging Man:
The highlighted candle in the chart represents a Hanging Man pattern, which is a bearish reversal pattern typically found at the top of an uptrend.
The long lower wick signifies that sellers pushed the price down during the session, but buyers managed to bring it back up close to the open price, though not with strong bullish conviction.
The fact that this pattern appears after a sharp upward move signals a potential bearish reversal, especially if followed by a bearish confirmation candle.
Doji:
The Doji signals indecision, with buyers and sellers unable to gain control as the open and close prices are nearly the same. Following the Hanging Man and with an overbought RSI of 73.32, it suggests weakening bullish momentum and potential for a bearish reversal.
Place a stop loss above the Hanging Man’s high and set take profit near the next key support at 2,613.732. These levels are derived from the Hanging Man, providing some bearish confirmation. However, traders should feel free to skip the trade if they aren’t confident with the setup, as prioritising risk management is crucial.
Confirmation:
A bearish candle closing below the low of the Doji would provide strong confirmation of a trend reversal.
Good luck in the markets!
🔔 To stay updated, don’t hesitate to follow!
💡 Learn
💹 Trade
🤑 Grow

Nifty RSI Super-Heated to 83% - Crash Coming ????On the Quarterly chart - the RSI indicator on Nifty is showing a value of 83% or more indicating it's in Over Bought Zone
Back in Jan 2008, the RSI went to a high of 87% and Nifty subsequently crashed -52% from the Highs. After 16 years, the RSI on Nifty is climbing up beyond the 83% mark which indicates "Danger of a Correction" according to many Expert Analysts from Media Channels, Twitter and Telegram
Please forward the below analysis to All those Pessimistic Technical Super-Zeroes
--------------------------------------------------------------------------------------------------------------------
I say - What a "Ridiculous" Comparison of 2008 vs 2024??? The entire Technology world looks toward India as a Hub of Technical Brains, but those brains are just filled with Age-old Folklores and Pessimism.
Technical Analysis is NOT a Geometry class to connect 2 dots from 20-30 years ago and say we had the similar situation back then and there was a Crash and the same thing will Repeat now. The entire market Dynamics has changed a lot.
1. First of all what's an Indicator?
An Indicator is nothing but a Human written Algorithm (A Script) which consumes Buyers & Sellers Activity and volume of trades historically and does some simple "math". How does this Dumb Number Crunching algorithm understand external factors?
2. What Really Caused the fall in 2008?
Think again closely - The 2008 crash was a Global Catastrophe caused by the Massive Conspiracy and Bankruptcy of Lehman "Buggers" (Brothers) in US which had a world wide impact. For those Technical Pundits who believe 2008 fall was due to RSI - read the Analysis below fully
In this image - there is a comparison of Nasdaq Vs Nifty 50 between 2000 to 2008 and the RSI line is that of Nasdaq (not Nifty)
In 2000, the market fell so badly in US and the RSI was around 98%. But in 2008, look at the RSI - it was hovering around the Healthy 60% mark which is treated as the Golden Levels of "Fresh Entry" by most technical analysts
But US & the entire world crashed in 2008 due to Lehman Brothers issue - As the subprime mortgages underlying these securities began to default at alarming rates, investor confidence plummeted leading to a loss in trust in Lehman Brothers. Unable to fully recover all of their losses, Lehman Brothers were forced to file for bankruptcy
Nifty was trading at RSI 90% back then, but US was trading at 60% RSI. So the fall here is NOT because of Indian RSI - but due to a Global event.
RSI is like a Speedometer - it just indicates that you are driving at 80 / 100 and in every vehicle speedometer - there will be a RED zone which indicates Dangerous driving conditions. Does not mean, the Engine will fail. It just says that driving so fast is not safe.
We should learn to do a Full Analysis - not just a Half-baked one connecting some dots with something else claiming Technical superiority
Nothing is going to happen to US especially NOTHING will every happen to Indian Market until Apr 2028 where Nifty will face a 34 year long Parallel Channel Resistance as indicated in the main chart
Disclaimer:
Stocks-n-Trends is NOT registered with SEBI. We do not provide Buy / Sell recommendations - rather we provide detailed analysis of how to review a chart, explain multi-timeframe views purely for Educational Purposes. We strongly suggest our followers to "Learn to Ride the Tide" and consult your Financial Advisors before taking any positions.
If you like our detailed analysis, please do rate us with your Likes, Boost and share your comments
-Team Stocks-n-Trends

Top of the Band Top of the World Toppy TopYeahhh wowww... moved wayy beyond any expectations.
So insanely booleesh, face-ripping bear-killing rally from Hell.
How long can it go on?
Double topped RSI at 80%, see arrows. Top of the Bolly Band.
Explosive blow-off style rally to massive new ATH for SPX, NQ.
Might have another day or two in it.
Notice that DJI already topped at 40K and RTY has barely moved... divergence, goes back to Dow Theory, non-confirming.
This rally is almost entirely driven by the Mag 7, tech and AI froth.
Chasing it here is unlikely to be profitable IMO.
Gonna get some kind of pullback in back half of July. Think about closing longs. Shorts might print finally. GLTA

USDCHF Tests Critical Resistance on Dovish SNBHaving pivoted away from its tightening cycle in March, the Swiss National Bank delivered the second straight rate cut last week, making it a frontrunner in the shift to monetary easing. Officials also lowered their inflation forecasts, creating scope for more moves ahead. Its US counterpart on the other hand, is reluctant to pivot due to stubborn inflation and Fed officials see just one cut this year.
This monetary policy divergence is beneficial for USD/CHF, which surges after the SNB back-to-back rate cut. It now tries to take out a pivotal resistance cluster, comprising of the EMA200 (black line), the 38.2% Fibonacci of the last decline and the daily Ichimoku Cloud. Successful effort will give control back to the bulls and allow them to look towards the 2024 peak (0.9225-46), but this may prove elusive in the near term.
On the other hand, with two rate cuts already under their belt, Swiss policymakers may become less bold. Furthermore, the Fed may have adopted a higher for longer stance, but still sees less restrictive stance ahead and markets are more optimistic, pricing in two rate cuts within the year.
Overbought conditions indicated by the RSI and the aforementioned critical resistance confluence, can put pressure on USD/CHF. So a pullback that would challenge 0.8825 would not be surprising, but deeper losses towards and beyond 0.8730 are not compatible with the monetary policy dynamics.
Stratos Markets Limited (www.fxcm.com):
CFDs are complex instruments and come with a high risk of losing money rapidly due to leverage. 68% of retail investor accounts lose money when trading CFDs with this provider. You should consider whether you understand how CFDs work and whether you can afford to take the high risk of losing your money.
Stratos Europe Ltd (trading as “FXCM” or “FXCM EU”), previously FXCM EU Ltd (www.fxcm.com):
CFDs are complex instruments and come with a high risk of losing money rapidly due to leverage. 73% of retail investor accounts lose money when trading CFDs with this provider. You should consider whether you understand how CFDs work and whether you can afford to take the high risk of losing your money.
Stratos Trading Pty. Limited (www.fxcm.com):
Trading FX/CFDs carries significant risks. FXCM AU (AFSL 309763). Please read the Financial Services Guide, Product Disclosure Statement, Target Market Determination and Terms of Business at www.fxcm.com
Stratos Global LLC (www.fxcm.com):
Losses can exceed deposits.
Any opinions, news, research, analyses, prices, other information, or links to third-party sites contained on this video are provided on an "as-is" basis, as general market commentary and do not constitute investment advice. The market commentary has not been prepared in accordance with legal requirements designed to promote the independence of investment research, and it is therefore not subject to any prohibition on dealing ahead of dissemination. Although this commentary is not produced by an independent source, FXCM takes all sufficient steps to eliminate or prevent any conflicts of interests arising out of the production and dissemination of this communication. The employees of FXCM commit to acting in the clients' best interests and represent their views without misleading, deceiving, or otherwise impairing the clients' ability to make informed investment decisions. For more information about the FXCM's internal organizational and administrative arrangements for the prevention of conflicts, please refer to the Firms' Managing Conflicts Policy. Please ensure that you read and understand our Full Disclaimer and Liability provision concerning the foregoing Information, which can be accessed via FXCM`s website:
Stratos Markets Limited clients please see: www.fxcm.com
Stratos Europe Ltd clients please see: www.fxcm.com
Stratos Trading Pty. Limited clients please see: www.fxcm.com
Stratos Global LLC clients please see: www.fxcm.com
Past Performance is not an indicator of future results.

EURUSD Higher after US CPI but Policy Dynamics to WeighWednesday’s US CPI report showed a moderation in price pressures in April, following months of persistence, with headline inflation easing to 3.4% y/y and core to 3.6% y/y. Along with the miss in retail sales, markets strengthened their pricing for two rate cuts this year by the Fed, staring in September.
The greenback fell as a result, sending EURUSD to the highest levels in nearly a month. this bring the March peak in the spotlight (1.0981), but we are cautious around the ascending prospects.
US Inflation remains far from the 2% target, which along with strong economy and robust labor market have raised the bar for a Fed to pivot, leading policymakers to higher-for-longer narrative. Their European peers have made more progress on moderating price pressures and the economy struggles. As a result, the ECB looks more ready to lower rates, having hinted at a June pivot.
The monetary policy differentially is likely to cap the upside and put pressure on EURUSD. Along with overbought RSI, there is scope for a retreat towards the EMA200 (black line). Daily closes below it would shift bias to the downside and make the common currency vulnerable to the 2024 lows (1.0600).
Stratos Markets Limited (www.fxcm.com):
CFDs are complex instruments and come with a high risk of losing money rapidly due to leverage. 68% of retail investor accounts lose money when trading CFDs with this provider. You should consider whether you understand how CFDs work and whether you can afford to take the high risk of losing your money.
Stratos Europe Ltd (trading as “FXCM” or “FXCM EU”), previously FXCM EU Ltd (www.fxcm.com):
CFDs are complex instruments and come with a high risk of losing money rapidly due to leverage. 73% of retail investor accounts lose money when trading CFDs with this provider. You should consider whether you understand how CFDs work and whether you can afford to take the high risk of losing your money.
Stratos Trading Pty. Limited (www.fxcm.com):
Trading FX/CFDs carries significant risks. FXCM AU (AFSL 309763). Please read the Financial Services Guide, Product Disclosure Statement, Target Market Determination and Terms of Business at www.fxcm.com
Stratos Global LLC (www.fxcm.com):
Losses can exceed deposits.
Any opinions, news, research, analyses, prices, other information, or links to third-party sites contained on this video are provided on an "as-is" basis, as general market commentary and do not constitute investment advice. The market commentary has not been prepared in accordance with legal requirements designed to promote the independence of investment research, and it is therefore not subject to any prohibition on dealing ahead of dissemination. Although this commentary is not produced by an independent source, FXCM takes all sufficient steps to eliminate or prevent any conflicts of interests arising out of the production and dissemination of this communication. The employees of FXCM commit to acting in the clients' best interests and represent their views without misleading, deceiving, or otherwise impairing the clients' ability to make informed investment decisions. For more information about the FXCM's internal organizational and administrative arrangements for the prevention of conflicts, please refer to the Firms' Managing Conflicts Policy. Please ensure that you read and understand our Full Disclaimer and Liability provision concerning the foregoing Information, which can be accessed via FXCM`s website:
Stratos Markets Limited clients please see: www.fxcm.com
Stratos Europe Ltd clients please see: www.fxcm.com
Stratos Trading Pty. Limited clients please see: www.fxcm.com
Stratos Global LLC clients please see: www.fxcm.com
Past Performance is not an indicator of future results.

Copper Rises to 2+ Year Highs on Improving Supply-Demand OutlookCopper prices have rallied more than 20% this year as the market is tightening, moving above 4.800 for the first time in more than two years. Improving supply-demand dynamics can drive further gains, with the March 2022 record peak now in the spotlight (5.041).
Concerns around output are high, as key miners expect lower production this year. At the same time, demand optimism is on the rise, with the AI-driven recovery of the chip industry and the clean energy transition to support usage of the non-ferrous metal.
On the other hand, production is still likely to grow this year and there are uncertainties around demand. A key source is China, due to its uneven post-pandemic recovery and the ailing real estate sector.
Furthermore, the RSI points to overbought conditions and has not followed the price higher today, creating scope for a pullback. However, a strong catalyst would be needed to challenge the EMA200 (black line) and the bullish momentum.
Stratos Markets Limited (www.fxcm.com):
CFDs are complex instruments and come with a high risk of losing money rapidly due to leverage. 68% of retail investor accounts lose money when trading CFDs with this provider . You should consider whether you understand how CFDs work and whether you can afford to take the high risk of losing your money.
Stratos Europe Ltd (trading as “FXCM” or “FXCM EU”), previously FXCM EU Ltd (www.fxcm.com):
CFDs are complex instruments and come with a high risk of losing money rapidly due to leverage. 73% of retail investor accounts lose money when trading CFDs with this provider . You should consider whether you understand how CFDs work and whether you can afford to take the high risk of losing your money.
Stratos Trading Pty. Limited (www.fxcm.com):
Trading FX/CFDs carries significant risks. FXCM AU (AFSL 309763). Please read the Financial Services Guide, Product Disclosure Statement, Target Market Determination and Terms of Business at www.fxcm.com
Stratos Global LLC (www.fxcm.com):
Losses can exceed deposits.
Any opinions, news, research, analyses, prices, other information, or links to third-party sites contained on this video are provided on an "as-is" basis, as general market commentary and do not constitute investment advice. The market commentary has not been prepared in accordance with legal requirements designed to promote the independence of investment research, and it is therefore not subject to any prohibition on dealing ahead of dissemination. Although this commentary is not produced by an independent source, FXCM takes all sufficient steps to eliminate or prevent any conflicts of interests arising out of the production and dissemination of this communication. The employees of FXCM commit to acting in the clients' best interests and represent their views without misleading, deceiving, or otherwise impairing the clients' ability to make informed investment decisions. For more information about the FXCM's internal organizational and administrative arrangements for the prevention of conflicts, please refer to the Firms' Managing Conflicts Policy. Please ensure that you read and understand our Full Disclaimer and Liability provision concerning the foregoing Information, which can be accessed via FXCM`s website:
Stratos Markets Limited clients please see: www.fxcm.com
Stratos Europe Ltd clients please see: www.fxcm.com
Stratos Trading Pty. Limited clients please see: www.fxcm.com
Stratos Global LLC clients please see: www.fxcm.com
Past Performance is not an indicator of future results.

TAP ( Coors Molson Miller ) Ready for Bullish Continuation?On the daily chart, TAP was on a good trend up heading into earnings which were favorable.
It is consolidated since just after earnings in a " high tight bull flag pattern" Volume has been
healthy with many buyers and seller trading shares in a tight range channel. The stochastic
RSI is now at about 20% indicating TAP is in the oversold / undervalued area. The optimized
artificial intelligence moving average indicator shows parallel rises in both the short and long
MAs ( neither divergence nor convergence just consistent ). This is a minor healthy pullback
and a good entry point.
Fundamentally, the summer beer- drinking season will soon arrive. TAP may be benefitting
from the BUD backlash over the Bud Lite endorsement controversy.
My call options have been appreciated 50% in the past 2 1/2 weeks ( 4% per trading day ).
I will roll them into the call options expiring 9/15/23. I consider TAP to be a steady
consistent gainer and likely more or less recession-proof.

Copper Extends Gains to Two Year Highs Prices rally around 15% this month and break another threshold, hitting the highest levels in two years. The advance brings the record peak of 2022 in the spotlight (5.041) and given the improved supply-demand dynamics, that level looks within reach.
There is optimism around increased need for the non-ferrous metal due to the green energy transition and the recovery of the chip industry, largely fueled by the AI boom. The recent data from China – one of the world’s top consumers - also helped, as GDP rose more than expected in Q1. On the supply side, key mining companies have cut their 2024 production forecasts, while Chinese smelters have reportedly agreed to lower their output.
On the other hand, China’s post-pandemic recovery is bumpy and its critical property sector still in distress. The US economy is strong, but the recent preliminary GDP offered a warning sign and sticky inflation raises the bar for looser monetary policy. On the technical front, the RSI is overbought and Copper may be ripe for a pullback. However, daily closes below the EMA200 would be required for the bullish bias to halt and that looks like a toll order, while the downside appears well-protected.
Stratos Markets Limited (www.fxcm.com):
CFDs are complex instruments and come with a high risk of losing money rapidly due to leverage. 68% of retail investor accounts lose money when trading CFDs with this provider. You should consider whether you understand how CFDs work and whether you can afford to take the high risk of losing your money.
Stratos Europe Ltd (trading as “FXCM” or “FXCM EU”), previously FXCM EU Ltd (www.fxcm.com):
CFDs are complex instruments and come with a high risk of losing money rapidly due to leverage. 73% of retail investor accounts lose money when trading CFDs with this provider. You should consider whether you understand how CFDs work and whether you can afford to take the high risk of losing your money.
Stratos Trading Pty. Limited (www.fxcm.com):
Trading FX/CFDs carries significant risks. FXCM AU (AFSL 309763). Please read the Financial Services Guide, Product Disclosure Statement, Target Market Determination and Terms of Business at www.fxcm.com
Stratos Global LLC (www.fxcm.com):
Losses can exceed deposits.
Any opinions, news, research, analyses, prices, other information, or links to third-party sites contained on this video are provided on an "as-is" basis, as general market commentary and do not constitute investment advice. The market commentary has not been prepared in accordance with legal requirements designed to promote the independence of investment research, and it is therefore not subject to any prohibition on dealing ahead of dissemination. Although this commentary is not produced by an independent source, FXCM takes all sufficient steps to eliminate or prevent any conflicts of interests arising out of the production and dissemination of this communication. The employees of FXCM commit to acting in the clients' best interests and represent their views without misleading, deceiving, or otherwise impairing the clients' ability to make informed investment decisions. For more information about the FXCM's internal organizational and administrative arrangements for the prevention of conflicts, please refer to the Firms' Managing Conflicts Policy. Please ensure that you read and understand our Full Disclaimer and Liability provision concerning the foregoing Information, which can be accessed via FXCM`s website:
Stratos Markets Limited clients please see: www.fxcm.com
Stratos Europe Ltd clients please see: www.fxcm.com
Stratos Trading Pty. Limited clients please see: www.fxcm.com
Stratos Global LLC clients please see: www.fxcm.com
Past Performance is not an indicator of future results.
