🔥Ethereum is on Ascending Triangle(Bear Market) 🔥(Road map)🧐Today, I decided to publish a Road map for Ethereum .
First, I have to say again sorry (This post is like with post that I published ''🔥 Bitcoin is on Contracting Triangle 🔥 (Road map)🧐'' ) for the busy chart ( ETHUSDT ), but my chart needed these lines. Please spend a few minutes on it.🙏
Location: ETH is on Main wave 4 ( Zig zag 5-3-5 ) for about 25 days (From 4372$ until LIVE price) and I think that Main wave 4 will take more time from us (maybe more than one month , just a prediction ).
My idea : ETH was able to pass the Microwave A (It had 5 microwave) of the Main wave 4 at 1866$ . Now, ETH is running on Ascending Triangle ( Bear Market shape ). I was able to find the 3 main points of the triangle A-B-C ( Ascending Triangle ).
For finding Point D , we have to concentrate on Descending Triangle for Bull Market OR Barrier Triangle . (In the following, I will explain the reason for the word ''OR'').
I think that Point D can be around 2552 $ == Near the Lower line of our Triangles.
I have three Scenario :
Scenario 1 : when the price arrives to Point D , it can break the lower line of our triangle, and then the price starts to go down, so the end of microwave B of the Main wave 4 was at Point C + microwave C of the Main wave 4 has started === Triangle that I spoke about it for finding Point D will be Barrier Triangle .
Scenario 2 : when the price arrives to Point D , then the price goes up until Point E (Price will break our Descending Triangle (for Bull Market ) on this way). Point E can be a Critical Point for us (It is the end of microwave B of Main wave 4 ), better, I had to say that market will decide to go UP or DOWN ( UP will make my Scenario 3 // DOWN will make my Scenario 2 ). If the price goes DOWN at Point E , we can say that microwave C of Main wave 4 has started == Triangle that I spoke about it for finding Point D will be Descending Triangle (for Bull Market) .
Scenario 3 : when the price arrives to Point D , then the price goes up until Point E (Price will break our Descending Triangle (for Bull Market ) on this way). Point E can be a Critical Point for us(It is the end of microwave B of Main wave 4 ), better, I had to say that market will decide to go UP or DOWN ( UP will make my Scenario 3 // DOWN will make my Scenario 2 ). If the price goes UP at Point E , we can say that BTC will go UP by 5 new impulsive waves == Triangle that I spoke about it for finding Point D will be Descending Triangle (for Bull Market) .
Also, I have to say that Microwave C can not go down less than 1406 $ == Elliott's rules will be violated ( Wave 4 and Wave 1 can no t have overlap ).
Resistance zones on Ethereum's way :
Resistance zone 1 : 2900$ until 2935$ ( The upper line of Ascending Triangle + Monthly Pivot Point ) == Heavy Resistance
Resistance zone 2 : 2814$ until 2837$ ( 38.2% Fibonacci microwave A of Main wave 4 + Weekly R1+ 88.6% Fibonacci (Point A) until (PointB) ) == Light Resistance
Support zones on Ethereum's way :
Support zone 1 : 2264$ until 2180$ ( 88.6% Fibonacci (Point B) until (PointC)+ 61.8% Fibonacci (Point A) until (PointB) + support (major pivot) ) == Medium Support
Support zone 2 : 1900$ until 1865$ ( support (major pivots) ) == Heavy Support
My Suggestion : please DO NOT buy Coins for Midterm and Long-term investment until the market finds a way .
Do not forget to put Stop loss for your positions (For every position you want to open)
Please follow your strategy , this is just my idea, and I will be glad to see your ideas on this post.
Please do not forget the 'like' button :) & Share it with your friends, Thanks, and Trade safe.
Good luck
Scenarios

🔥 Bitcoin is on Contracting Triangle 🔥 (Road map)🧐First, I have to say sorry for the busy chart (BTCUSDT) , but my chart needed these lines . Please spend a few minutes on it.🙏
Location : BTC is on Corrective Structure ( Zig zag 5-3-5 ) for about 51 days (From 64795$ until LIVE price) and I think that this correction will take more time from us (maybe 2 months , just prediction ).
My idea : still, BTC is on microwave 4 of Main wave C . as you know, one of the shapes of wave 4 is a triangle . I was able to find the 3 main points of the triangle A-B-C ( Contracting Triangle ). Point C has found with Bearish Gartley Harmonic Pattern + 78.6% Fibonacci (Point A ) until ( Point B ).
For finding Point D , we have to concentrate on correcting microwaves (a-b-c) that are on the way to point D, I was able to find Bullish Crab Harmonic Pattern on the end of microwave a. microwave b can be around 37040$ or 37960$ .
I think that Point D can be around 35698$ == 61.8% Fibonacci ( Point B ) until ( Point C ).
I have three Scenario :
Scenario 1 : when the price arrives to Point D , it can break the lower line of our triangle , and then the price starts to go down, so the end of microwave 4 of Main wave C was at Point C + microwave 5 of Main wave C has started.
Scenario 2 : when the price arrives to Point D , then the price goes up until Point E . Point E can be a Critical Point for us (It is the end of microwave 4 of Main wave C ), better, I had to say that market will decide to go UP or DOWN ( UP will make my Scenario 3 // DOWN will make my Scenario 2 ). If the price goes DOWN at Point E , we can say that microwave 5 of Main wave C has started.
Scenario 3 : when the price arrives to Point D , then the price goes up until Point E . Point E can be a Critical Point for us(It is the end of microwave 4 of Main wave C ), better, I had to say that market will decide to go UP or DOWN ( UP will make my Scenario 3 // DOWN will make my Scenario 2 ). If the price goes UP at Point E , we can say that BTC will go UP by 5 new impulsive waves .
My Suggestion : please do not buy Coins for Midterm and Long-term investment until the market finds a way.
Do not forget to put Stop loss for your positions (For every position you want to open)
Please follow your strategy , this is just my idea, and I will be glad to see your ideas on this post.
Please do not forget the 'like' button :) & Share it with your friends, Thanks, and Trade safe.
Good luck

Bitcoin Bull / Bear road-map for 2021The Bitcoin Bull / Bear road-map for the remainder of 2021!
Right now, different bullish and bearish scenario's are in the cards. This chart provides my rough estimate at which levels the bullish and different bearish narratives will be validated. Please note that we can always profit in different scenario's (via either gains or discounts).
Please leave a like or comment, if you like the the idea! Take care.

Gold scalp/swing Both scenariosIf gold can close an hourly above the trendline look for an upside to the 1739-1740 region(big fakeout zone and previous range top) if it gets through look for an upside of the upper trendline and afterthat the psycological level of 1750(previous rejection zone)
Buy on a retest of the trendline and rebound off or when it breaks the previous 1739 level.
As i publish this a hourly has closed above the trenline but started pulling back slightly.
Be cautious because we are in a downtrend on a 4hr timeframe and we completed a pin formation down (went below the neckline and recovered)
Levels and trendlines to watch:
Alternatively/if rejected or falls below the trendline again:
To be safe wait for hourly closes
Thanks:)

Keep an eye out for a breakout NUUSDGreen Scenario: triangle breaks out to the upside, also breaking the channel along the way.
Red scenario: Channel continues descending.

Gold scenario from TheorisCase. A
$XAUUSD try to end with a Bearish falling wedge pattern
the green zone in charts if gold cannot drop lower than this and can break higher than dotted-line - reversal will work.
TP > 1903
Case B.
We will see strong support (yellow zone) and red dot channel and red trend line.
Yes, It is a wide range. we must wait and see in the smaller time frame
TP > 2000
Case C.
Gold breaks down the red trend line.
N/A
I think case B. is the highest possibility to occur.
Now I only use scalping trading in sell
and wail the reaction as 3 cases above.
Have a nice day

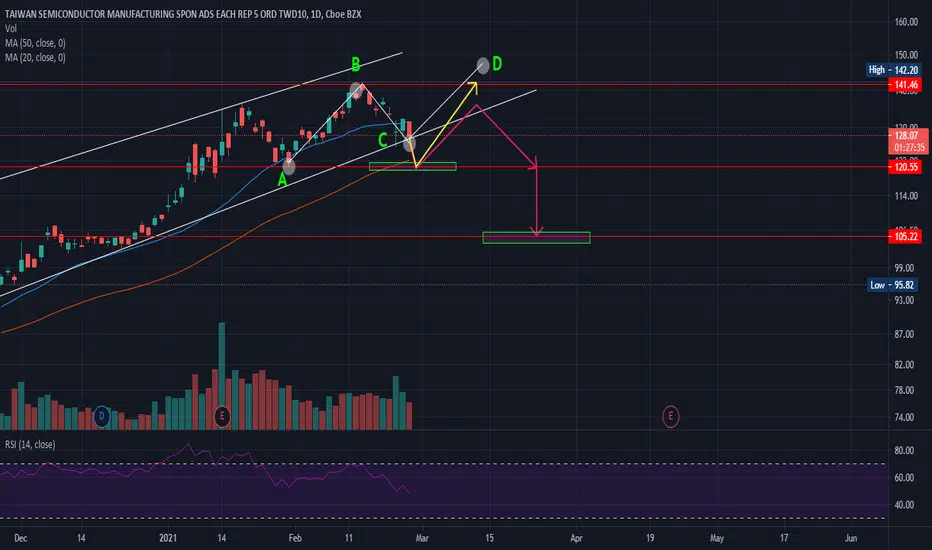
TSM possible scenarios...patience will be crucial with TSM...
1.) Scenario that we can looking for setup is "ABCD" pattern where right now we are in (C) point and that is good setup for buy ... but ...
2.) But as we can see with pink color, if price come down on point (A) we will looking, will the price do a "head and shoulder" and than that will be good setup at price by approx. $105.22
3.) And with yellow color we can see If the price come at point (A) and just bounce back in "ascending triangle" and make ATH we will looking for resistance brake and setups for buy.
Thank you for reading, and this is not purchase recommendation... Push like button or comment if you like this analysis or if you have some your view. :)
NYSE:TSM
CHFJPY scenariosThere are two scenarios in this idea:
1 The market breaks the trendline, retests it and then begins to decline.
2 The market reaches the trend line, after which it will start to grow towards the resistance level.
Good luck!

Possible scenarios for eur/usdWe finally see the retracement on the EUR/USD. The bias is still long, however, we have different possible scenarios to play out.

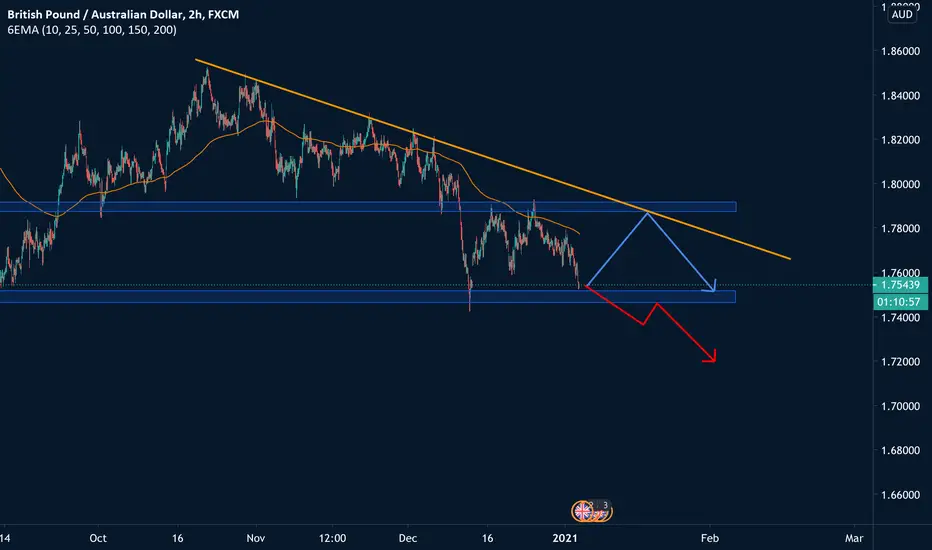
GBPAUD scenariosIn this analysis you can see two options.
The first option is: The market reaches the support level and then returns to the descending trend line.
The second option is: The market breaks the support level and then starts falling.
Good luck!
AMAZON video top-down AnalysisHello everyone, if you like the idea, do not forget to support with a like and follow.
Here is the top-down analysis for AMAZON, feel free to request any pair/instrument or ask any questions in the comment section below.
Best of luck!

Weekly Market recap 6: volatility may take off very soonI believe the first breakout impulse of a new trend in the major assets can start during the next week.
DXY broke out the long-term trendline and held above, closing at the border of the current sideways channel at 94.00 (even a little above it). If on Monday DXY closes confidently above 94.00, I'll be surely bullish on USD and JPY as that may signal the beginning of the new wave of risk aversion sentiment. If instead DXY forms a rejection candle signal, the reversal back into the range is likely.
The major asset classes came to significant price levels
1)Brent broke the important support at 39.00, confirming the short-term uptrend (started at the end of April) reversal according to the trend structure.
2)Although S&P500 hasn't broken September low yet, it's consolidating under MA(100), that adds to my bearish bias on stocks.
3)Gold is also testing its major support level.
Possible scenarios
Whatever asset you look at, the full-body candle in either direction will tell us a lot at this point. We either enter into a volatile trending market (in case of DXY being above 94.00) or a possible short-term trend of medium volatility in the opposite direction.
The market may be pricing in the upcoming United States Presidential election on November 3. The election result can be a catalyst for a new trend across the board.

GOLD STRUCTURE ANALYSIS| SCENARIOS
GOLD is trading in a triangle, with it's lower bound changing angle!
(1) A strong green horizontal support has been established
(2) IF gold manages to break out the diagonal resistance of a triangle>>> Then the post-breakout scenario will likely play out
(3) With long opportunities from pullback first and then from retracement to the dotted line.
(4) IF it does not>>> long from the horizontal support
__________________________________________
LIKE and SUBSCRIBE for VIBES!

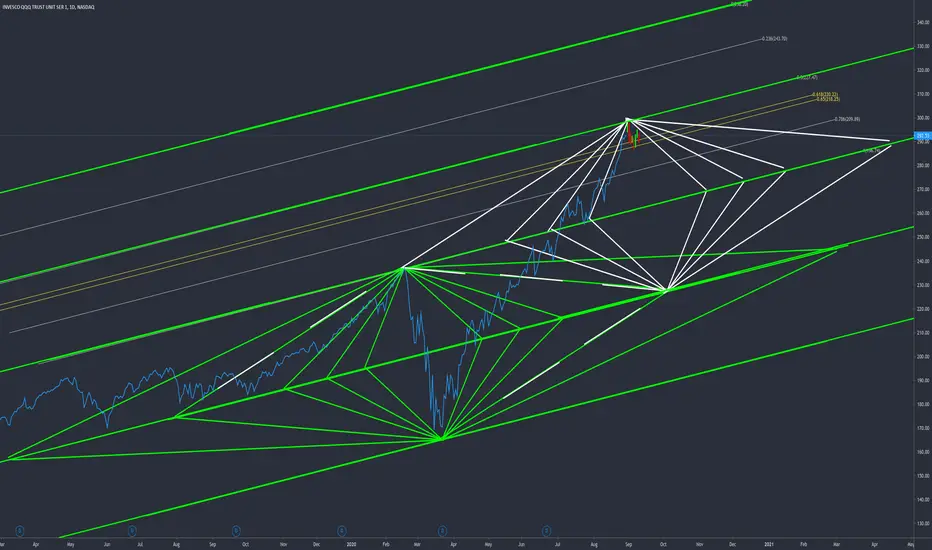
QQQ - the tangled webs we weaveThis is an experimental model for educational purposes only, The purpose is to demonstrate the repeating nature of slopes derived from the dart boundaries, once we find an angle we like it is likely we will find it again. This helps with scenario planning - creating multiple possibilities to prevent getting burned by bias. I added scenario bars through Sept 10th in this example. Another interesting discovery was how the 4th darts lined up to create a channel (white dashes). Using the .5 Channel above as the second apex was the cause.

EURUSD- NEVER OPEN A TRADE AGAINST THE TRENDHello Traders,
Again the same point of view. Two scenarios, the price couldn't consolidate for a long time specially on this pair which is the most volatility one. Therefore, follow the main rule never fight the trend, we trade on Foreign Market, we don't create the trend , obviously we don't change it, we can't. Just follow the wave. The rules are on the chart. Lets see the paint.
Thank You.


Whose the winner of the war ?Alright guys lets make it simple to understand, this is not hard to see...
Breaking red lines means potential to touch another one.
Breaking green lines means potential to touch another one.
Personally im in short until I dont see a confirmation above 9450(Means 9500 break) and I will do long to 9850, I didn't enter trade yet, because this range is not done yet ... you can see the touches and respects in rsi(focus on red and green lines there).
We are above the ichimoko cloud but cross over wasn't good enough ... it was week ...(cross over was inside the clouds)
If you liked it, please hit the like button, share and write your comments and follow me, thanks for reading.
Take care, trade safe and good luck.


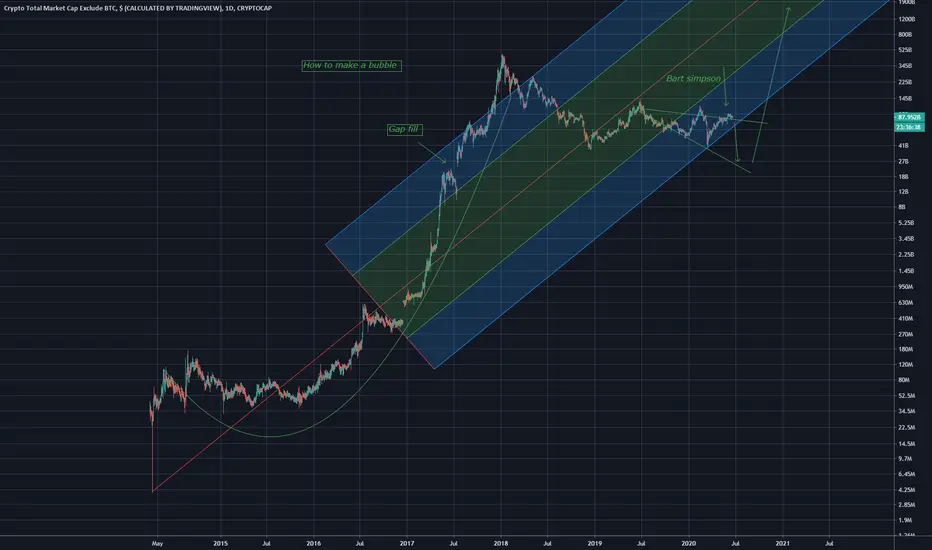
The only bearish scenario I can seeGap filler
since the altcoin market is intensely correlated with TOTAL, completely even
buy bitcoin and alts at 78B if this scenario occurs

BITCOIN all possibles scenariosHello Traders,
Here is a overall view about BITCOIN and all the things you have to see before making your decision.
The first scenario is a possible Head n Shoulders pattern at 1hr time frame if we loose this neckline we can have a stronger correction moviment.
The second scenario is that we can test this two support levels bellow and still be on bullish trend.
In the big picture we can see that the price feel it the long Term Resistance line, and can have significant correction moviment from this level.
We do not descart out the possibility of starting an accumulation pattern at that level and breaking uptrend moviment in a few days and broke the long term resitance line and go above 10k zone.
Please like this post and leave your comment.
You are welcome to follow us on our social networks.

EURUSD multiple scenarios / weekly chart analysisEurusd has been very volatile lately and has made a strong push down.
if it can close below the support line and can make a successful retest then I am expected a continued fall.....also considering the state of Europe and the effects of the corona virus.
if it can close above perhaps we can see some bullish movement.
