Bitcoin - Bear flag, 74k confirmed! (warning, must see)Bitcoin has just completed its bearish flag formation. What now? The probability of going down is now around 70%, while the probability of going up is only 30%. Many times we see a bullish breakout of a bear flag. How does it look? Something like that:
We see that for a bullish breakout, the bulls need to completely go above the flag's resistance, which is much harder than simply going down, especially in a strong bear market, like in this Bitcoin's case.
Bitcoin's price and development are completely controlled by the banks and huge institutions that control this planet. To make money, you have to identify their actions on the chart.
On the chart we can also see a completely unfilled FVG (Fair Value GAP). Precisely between 90600 and 92060. There is a possibility for Bitcoin to partially or completely fill this GAP before starting the upcoming drop! Longs are riskier at this point, because we want to trade with the bearish trend. But if the price increases in the short term, we can have a much better entry point for our short position on futures. It's also a possibility to retest the long-term blue trendline from the all-time high.
From the Elliott Wave point of view, this bear flag seems to be a complex corrective pattern. To be honest, I don't see any signs of strength, such as an impulse wave or a leading diagonal wedge pattern. I am currently bearish on Bitcoin, and I expect a pretty significant drop in the coming weeks! Especially January is statistically an extremely weak month for Bitcoin.
Write a comment with your altcoin + hit the like button, and I will make an analysis for you in response. Trading is not hard if you have a good coach! This is not a trade setup, as there is no stop-loss or profit target. I share my trades privately. Thank you, and I wish you successful trades!
Community ideas

Lingrid | GOLD Buying Opportunity From Swap ZoneOANDA:XAUUSD is still trading within a well-defined rising channel, with the latest push printing a higher high before stalling inside the upper resistance band. The subsequent retracement appears controlled, with price rotating back into the former swap zone rather than breaking structure. This pullback looks more like digestion than distribution, as higher-timeframe trend alignment remains intact.
If buyers react around the 4,260 area where trend support and prior balance overlap, TVC:GOLD might regain upside traction and attempt another advance toward 4,335. The current zone could act as a springboard if demand absorbs the retracement pressure.
➡️ Primary scenario: support holds at 4,260 → continuation toward 4,335.
⚠️ Risk scenario: a decisive breakdown below 4,235 may open room toward the 4,220 support.
If this idea resonates with you or you have your own opinion, traders, hit the comments. I’m excited to read your thoughts!

Bitcoin Pullback to Resistance — Next Drop Loading?As I expected , Bitcoin( BINANCE:BTCUSDT ) has begun its decline from the resistance zone($94,850-$93,000) and has reached its target.
Currently, Bitcoin is moving near the resistance zone($90,900-$90,100), the Cumulative Short Liquidation Leverage($91,840-$90,110), and other resistance lines.
From an Elliott Wave perspective, it appears that Bitcoin has completed its five-wave downward sequence and is now in the process of forming the corrective waves upward, likely within the resistance zone($90,900-$90,100).
Moreover, since the USDT.D% ( CRYPTOCAP:USDT.D ) has successfully broken the upper line of its falling wedge pattern, we can anticipate further increases in USDT.D%, which could put additional downward pressure on Bitcoin.
Additionally, considering that the S&P 500 index( SP:SPX ) is likely to resume a bearish trend, and given Bitcoin’s correlation with the SPX, a further decline in Bitcoin is not unexpected.
In conclusion, based on the above analysis, I expect that Bitcoin will at least test the support lines and, if those are broken, it may continue to decline toward the Cumulative Long Liquidation Leverage($87,000-$85,663). If the momentum of breaking these support lines is strong, we can expect even more significant downward movement.
Do you think Bitcoin can go below $87,000?
First Target: Support lines
Second Target: Cumulative Long Liquidation Leverage($87,000-$85,663)
Stop Loss(SL): $92,000(Worst)
Points may shift as the market evolves
💡 Please respect each other's opinions and express agreement or disagreement politely.
📌Bitcoin Analysis (BTCUSDT), 1-hour time frame.
🛑 Always set a Stop Loss(SL) for every position you open.
✅ This is just my idea; I’d love to see your thoughts too!
🔥 If you find it helpful, please BOOST this post and share it with your friends.

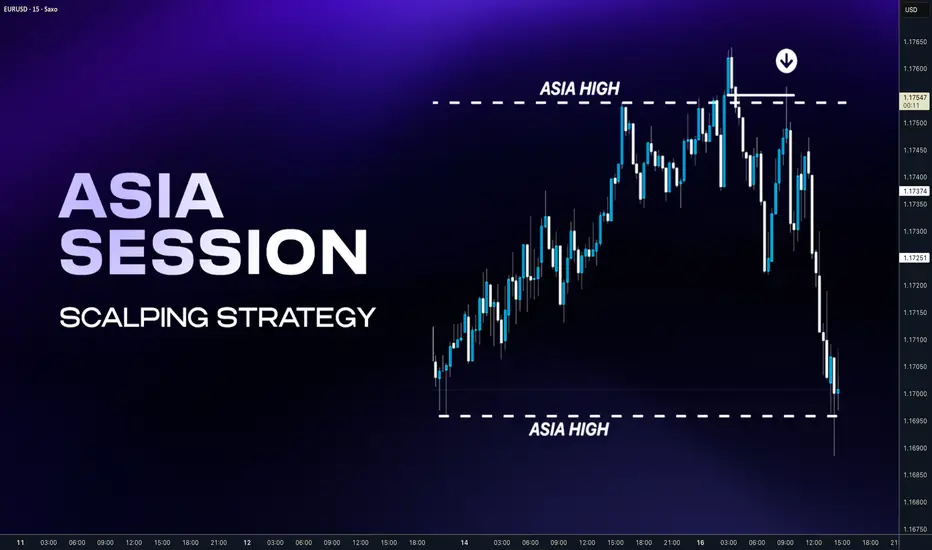
Understand Asia Session & Conquer London SetupsAsia is the “setup session.” Price often builds a tight box, prints equal highs and lows, and leaves obvious resting liquidity. London loves to raid that liquidity because it’s easy fuel. But before we go to the concept of how to trade it's also good to know why it is created. We already know that FX markets are controlled by CLS Market maker. Do we know it 100% ? No, but they trade almost 7 Trillion daily volume which is almost entire daily FX volume. This company is aggregator the many other bigger ones, they are collecting the orders during the the Asia and processes continuous settlement, during the next day the liquidity is found on the markets. (Im not promoting or something like that, this is institutional player which 99.9% of use here will not have access) Thats where they destroy most less informed traders, not purposely but their work is so effective that small % of traders succeed in this game.
🧩 Simplicity of the concept
You don't trade in the Asia session, Let Asia build the trap , Let price raid one side. Wait for proof it’s done raiding Enter on the retrace, not in the raid and trade contininuation during the London. In the scalping version . You can trader just one side of Asia range to the other side. This requires precisions on lower timeframes. Im planning to explain this later in the next post. For now let's do continuation setups during the London Session.
📌 Asian Session
Low volatility & accumulation phase — the market usually consolidates inside a tight range after the previous New York close. If the Asia session is trending, London will be continuation setup.
📌 London Session
The highest-probability setups often occur during this session.
If Asia was tight range, London usually manipulates the Asian range sweeping stops above or below then reverses and starts the true daily move. London will be Reversal setup. Often sets the daily high or low of the day
❌ Don't overthink it you need to understand HTF Bias
I you dont have HTF Bias your win ration will decrease, you will be frustrated and than you will typically jump to another strategy, like you did it already many times.
⁉️ Always start with question - Where is the liquidity
Always follow the Daily / Weekly candle close. Yes Daily and Weekly !! Even when you are trading intraday. You intraday trades must be within HTF flow. IT means you will not have a trade every day if you want hight win rate. You must be patient.
📈 Continuation
If todays daily candle closed above previous days high and its still not reaching the key level, then liquidity is above todays high. Why ? Because people have intentions to sell highs to early, so and price will most likely go there. So we are bullish. Bullish Close 📈 Reversal
If todays candle wicked above previous day high, but closed below , then we can expect liquidity is below Previous days low. Why? Because mostl likely traders entered fake high break out they put SL below days low. It's signs of reversal. Yes that simple it is. For more details scroll down and find my posts about Daily Bias.
🧩 4 X Potential Frameworks
If you drill what I will show you bellow you will see it on the charts happening at least 2 times a week. If you apply this to the 3 pairs. You got 6 high probability setups . Add patience and risk management = You will conquer the forex trading
🧪 London Continuation Bearish setup
•Narrative: Asia did the manipulation → London does the continuation.
• Asia session already made a manipulation into a key level
• Price displaced away from that level
• CIOD / OB on M15 or H1 before London open • H1: Asia runs above the stops above H1 high into a key level
• It gets rejected and followed by order block and displacement
• At London open, price retraces into M15 premium key level and continues in the same direction
❌Invalidation: the manipulation high/low from Asia session
🧪 London Continuation Bullish setup
• Narrative: Asia did the manipulation → London does the continuation.
• Asia session already made a manipulation into a key level
• Price displaced away from that level
• CIOD / OB on M15 or H1 before London open • H1: Asia runs bellow the stops above H1 high into a key level
• It gets rejected and followed by order block and displacement
• At London open, price retraces into M15 discount key level and continues in the same direction
❌Invalidation: the manipulation high/low from Asia session
🧪 London Reversal Bearish setup
• Narrative: London performs the manipulation → price reverses.
• Asia session consolidates near a higher timeframe key level
• London open initiates the manipulation into the key level
• Price reject at the key level and created M15 order block • H1: Asia consolidates Bellow Key Level
• London opens, price runs Asia high into that Key Level
• M15 breaks down → Change in order flow → clean short setup
• Target: higher timeframe draw on liquidity (e.g., previous day low)
❌Invalidation: the London session high (manipulation point)
🧪 London Reversal Bullish setup
• Narrative: London performs the manipulation → price reverses.
• Asia session consolidates near a higher timeframe key level
• London open initiates the manipulation into the key level
• Price reject at the key level and created M15 order block • H1: Asia consolidates above the Key Level
• London opens, price runs Asia high into that Key Level
• M15 breaks up → Change in order flow → clean short setup
• Target: higher timeframe draw on liquidity (e.g., previous day low)
❌Invalidation: the London session low (manipulation point)
‼️ In trading, you make most money by making precisely best decisions and controlling your risk. Hence understanding the different probabilistic scenarios we can start focusing on quality over quantity by avoiding lower probability conditions. The aim is to improve our decision making process by knowing when it's better to trade and when not.
❌ Low Probability London Session Conditions
• After a series of 3 consecutive bullish daily candles - Avoid Longs.
• After a series of 3 consecutive bearish daily candles - Avoid Shorts.
• After FOMC event that produces an extreme range.
• Ahead of NFP and CPI data release
• Multiple high and medium impact news events.
• The Asian Range is has been trending and is larger than 40 pips.
• If the Asian Range is not visually consolidating.
• Absence of a candle range
✅ High Probability London Session Conditions
• The market has recently reacted off of Daily /H4 key level
• The Asian Range is visually a consolidating and smaller than 40 pips.
• Presence of a clean visual candle range
• Presence of a higher timeframe key level.
• Clean higher timeframe draw on liquidity.
✅ High Probability Intraday Setups
The highest importance is placed on the H TF Daily or 4h direction:
• Clean orderflow.
• Clean higher timeframe draw on liquidity and directional bias.
• Strong price based narrative.
• Strong time based narrative.
• 4h candle range
• 4h Key level.
• Key time
❌ Common mistakes (quick and painful)
Trading every day, even when Asia is messy and wide
Entering during the sweep instead of after displacement
Stop too tight inside noise instead of beyond the actual swept point
Ignoring higher timeframe bias and wondering why London runs you over
Not journaling screenshots of the sweep + confirmation + entry (then you “feel” like it works, but you don’t know)
---------------------------
I promised myself I’d become the person I once needed the most as a beginner. Below are links to a powerful lessons I shared on Tradingview. Hope it can help you avoid years of trial and error I went thru.
📊 Sharpen your trading Strategy
⚙️ 100% Mechanical System - Complete Strategy
🔁 Daily Bias – Continuation
🔄 Daily Bias – Reversal
🧱 Key Level – Order Block
📉 How to Buy Lows and Sell Highs
🎯 Dealing Range – Enter on pullbacks
💧 Liquidity – Basics to understand
🕒 Timeframe Alignments
🚫 Market Narratives – Avoid traps
🐢 Turtle Soup Master – High reward method
🧘 How to stop overcomplicating trading
🕰️ Day Trading Cheat Code – Sessions
🇬🇧 London Session Trading
🔍 SMT Divergence – Secret Smart Money signal
📐 Standard Deviations – Predict future targets
🎣 Stop Hunt Trading
🧠 Level Up your Mindset
🛕 Monk Mode – Transition from 9–5 to full-time trading
⚠️ Trading Enemies – Habits that destroy success
🔄 Trader’s Routine – Build discipline daily
💪 Get Funded - $20 000 Monthly Plan
🧪 Winning Trading Plan
🛡️ Risk Management
🏦 Risk Management for Prop Trading
📏 Risk in % or Fixed Position Size
🔐 Risk Per Trade – Keep consistency
Never stop learning
David Perk aka Dave FX Hunter ⚔️
Why Risk–Reward Matters More Than Win Rate!!One of the biggest myths in trading is this:
“I need to win more trades to be profitable.”
✖️You don’t...
Some of the most profitable traders in the world win less than 50% of their trades.
So what’s the real edge?
👉 Risk–reward.
1️⃣ Win Rate Without Risk–Reward Is Meaningless
A trader who wins 70% of the time but risks 3 to make 1 is still bleeding slowly.
Meanwhile, a trader who wins only 40% of the time
but risks 1 to make 3 can grow consistently.🪜
Win rate tells you how often you’re right.
Risk–reward tells you how much it matters when you are.
2️⃣ Risk Defines the Trade Before Entry
Professionals don’t start with targets.
They start with invalidation.
They ask:
- Where is my idea wrong?
- Where does structure break?
- Where must I be out?
Only after risk is defined, do rewards become meaningful.🏆
If you don’t know where you’re wrong,
you don’t know what you’re trading.
3️⃣ Good Risk–Reward Creates Emotional Stability
When your risk is small and predefined:
- losses feel normal
- hesitation disappears
- overtrading drops
Why?
Because no single trade can hurt you badly❗️
Risk–reward doesn’t just protect your account.
It protects your mindset.
4️⃣ Risk–Reward Is What Builds Consistency
Consistency doesn’t come from winning streaks.
It comes from surviving losing streaks.📉
Proper risk–reward ensures:
- drawdowns stay shallow
- confidence stays intact
- discipline stays repeatable
That’s how traders last long enough to let probabilities work.
📚The Big Lesson
✔️You don’t need to be right more often.
✖️You need your winners to matter more than your losers.
When risk is controlled and reward is logical, trading stops feeling like gambling and starts feeling like execution.
⚠️ Disclaimer: This is not financial advice. Always do your own research and manage risk properly.
📚 Stick to your trading plan regarding entries, risk, and management.
Good luck! 🍀
All Strategies Are Good; If Managed Properly!
~Richard Nasr

The Dark Side Of Christmas for Bitcoin!!!!!!Christmas buying pressure on Bitcoin is not always bullish.
When everyone expects holiday gains, the market often prepares for something else.
Is this seasonal optimism creating opportunity, or quietly building a selloff?
Hello✌️
Spend 3 minutes ⏰ reading this educational material.
🎯 Analytical Insight on Bitcoin:
Apart from the fundamental explanations regarding Bitcoin’s decline, which this entire article focuses on, the price has recently approached the top of the descending channel, and if the weekly support I have marked on the chart breaks, I expect at least an additional 4% drop, with a target around $82,600.
Now , let's dive into the educational section,
🎄 Overall Market Environment During Christmas
During the Christmas period, the market often enters a phase that looks calm on the surface but carries hidden selling pressure underneath, and this contradiction causes many traders to misread what is really happening.
Reduced participation from large players makes the balance between supply and demand much more fragile than usual, allowing price to react faster to emotions.
In this environment, Bitcoin tends to be more vulnerable to corrections rather than strong bullish continuation.
🧠 Crowd Psychology And Misleading Expectations
When bullish expectations turn into a common belief, the market often chooses a different path because most potential buyers are already positioned.
This collective mindset causes traders to ignore early signs of weakness and react later than they should.
Christmas often creates this exact situation, where optimism replaces realistic analysis.
💸 Converting Bitcoin Into Real Liquidity
During this period, many people prefer to convert part of their Bitcoin holdings into dollars or gold to cover expenses related to celebrations, gifts, and travel.
This behavior is not driven by fear of the market but by real-life liquidity needs.
When this decision happens on a large scale, it creates steady and continuous selling pressure.
📉 Why Selloffs Often Appear Sudden
Seasonal selling usually starts quietly and without panic, but once price reaches sensitive levels, the impact becomes visible as sharp drops.
Traders waiting for classic confirmations often realize the shift only after most of the move has already occurred.
This delay makes the decline feel more sudden than it actually is.
😰 The Hidden Role Of Fear In Decisions
During Christmas, many traders are uncomfortable holding open positions through holidays, which creates a hidden layer of fear that directly influences selling behavior.
This fear usually activates before sharp drops, not after them.
The market senses this hesitation and uses it as fuel.
🧯 Short Market Behavior Summary
Christmas is more about releasing pressure than building new trends.
Understanding this mental phase can help avoid emotional decisions.
🛠 TradingView Tools And Features For This Phase
Volume Profile helps identify areas where price lacks real trading activity, making fast drops more likely.
Session Breaks highlight periods of reduced participation where sudden moves become more dangerous.
VWAP provides a clear view of how far price is trading from market equilibrium.
Market Structure allows traders to detect weak and misleading breakouts.
🎯 Three Key Recommendations For Traders
In this environment, trading less is often a smarter decision than staying constantly active.
Capital protection should have higher priority than chasing moves.
Always ask yourself whether a trade comes from analysis or from psychological pressure.
✨ Need a little love!
We pour love into every post your support keeps us inspired! 💛 Don’t be shy, we’d love to hear from you on comments. Big thanks , Mad Whale 🐋
📜Please make sure to do your own research before investing, and review the disclaimer provided at the end of each post.

Ethereum: Head & Shoulders Breakdown Inside a Descending channelHi
ETH is currently trading within a broader descending channel, keeping the medium-term structure under bearish pressure. On the 4H timeframe, price could have formed a clear Head & Shoulders pattern, with the left shoulder, head, and right shoulder well-defined and symmetric. Notably, the head briefly broke above the upper channel boundary, but the price failed to sustain above it and quickly moved back inside the channel, confirming a classic fake breakout and weakening bullish continuation probabilities.
The neckline of the pattern aligns closely with the 2,900–2,920 zone, which is now acting as a critical decision level. Price is currently hovering around this area, showing hesitation and a lack of strong bullish follow-through. As long as ETH remains below the descending channel resistance and fails to reclaim the neckline decisively, downside risk remains dominant.
A confirmed breakdown below the neckline would activate the H&S structure, opening the path toward the next major demand zone around 2,630.
RSI is trending lower and remains below the midline, supporting bearish momentum rather than divergence.

Hellena | Oil (4H): LONG to 50% Fibo lvl (58.00).The structure has broken down. Wave “2” of the middle order should not have updated the minimum of 56,420 of wave “B” of the higher order, but this has happened.
This means that the wave structure will have to be revised.
It seems that the major correction is not yet complete, and in order for the scenario to be completed, impulse “12345” must be completed.
At the moment, I think that the price will begin to form wave “4”.
I expect movement towards the 50% Fibonacci level from wave “3” at 58.00.
The target is not far off, but at the moment we need confirmation of the impulse.
This would mean that the price will update the local minimum, but more on that later.
Manage your capital correctly and competently! Only enter trades based on reliable patterns!

ADA – Downtrend Dominates, Risk of Deeper PullbackHello everyone,
On the chart, the downtrend remains clearly intact, with a persistent sequence of lower highs and lower lows extending from October to the present. Price is trading entirely below EMA34 and EMA89, both of which are sharply sloping downward. This confirms that sellers continue to control the market, with no meaningful signs of exhaustion so far.
Throughout November and December, all rebound attempts have been weak, short-lived, and repeatedly rejected around the EMA34 near the 0.45 USD area. This behavior suggests that buying pressure is purely technical in nature and insufficient to form a reversal structure. At the moment, ADA is hovering around the nearby support zone of 0.37–0.39 USD. However, the current D1 candle structure — small bodies, short lower wicks, and declining volume — indicates fading momentum, a pattern that often precedes a breakdown of support.
From an EMA perspective, the widening gap between price and EMA34 (0.452) as well as EMA89 (0.560) further confirms that the downtrend is expanding rather than contracting. To shift the market’s bias, ADA would need at least a daily close above 0.45 USD. At this stage, there are no early signals supporting such a scenario. Volume has continued to dry up over recent weeks and is concentrated mainly on bearish candles, implying a lack of fresh inflows, while sellers still require relatively little pressure to push prices lower.
Based on the current technical picture, the highest-probability scenario remains a breakdown below the 0.37–0.38 support zone, followed by an extension of the decline toward deeper support around 0.30–0.33 USD. This area represents a significant liquidity zone that previously acted as a major support, where price could eventually see a technical bounce or begin forming a new accumulation base. Until ADA approaches that region, there is still insufficient evidence to expect a genuine trend reversal.
Wishing you all a successful trading day!

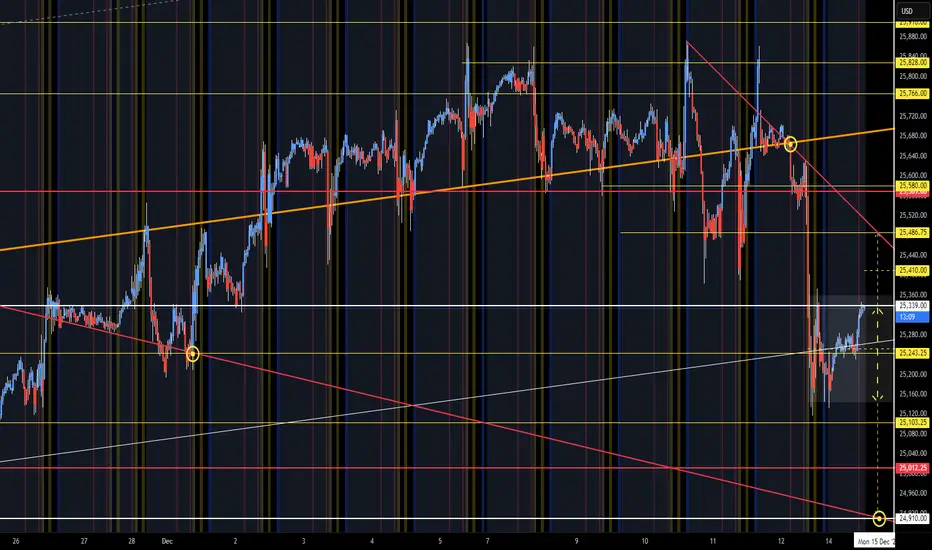
NQ Range (12-15-25)After the drop back into the Churn Zone, we have a NAZ Triangle of Range. Upper circle is the break under 10/22 TL, Mid circle is near mid CZ and Diablo pop on 12/1 and lower circle is CZ bottom and U Turn Target. Open Range (Reg Session) is shaded zone (yellow arrow), white arrow is break out to retest Diablo and lower yellow will be to KL 24,910. Watch the counter moves (Spikes) prior to actual larger moves, Overnight Pump/Dump at Open Drive and of course the Tweets during the Dead Zone. IDS27 Friday Open to current Chart:
BTC Breaks Wedge Structure, Bearish Pressure IncreasingBTC Breaks Wedge Structure, Bearish Pressure Increasing
Over the past month, Bitcoin has been consolidating within a large wedge pattern, creating a complex and somewhat misleading structure.
The recent breakout has clarified the pattern as bearish, significantly increasing the probability of further downside.
This shift in momentum may also be influenced by recent MicroStrategy-related news, particularly discussions about its potential removal from the US100 benchmark.
Growing concerns around MicroStrategy’s business model,given its extreme sensitivity to Bitcoin’s price fluctuations, have raised uncertainty in the market.
As one of the largest Bitcoin holders, any negative sentiment surrounding MicroStrategy can directly impact BTC price action.
If Bitcoin continues to hold below the broken wedge structure, bearish continuation becomes more likely. In that scenario, downside targets come into focus at:
82,000
76,400
You may find more details in the chart!
Thank you and Good Luck!
PS: Please support with a like or comment if you find this analysis useful for your trading day

BTCUSD Holds Triangle Support - Bounce Toward 88,500 ExpectedHello traders! Here’s my technical outlook on BTC/USD based on the current chart structure. After a prolonged bearish move inside a downward channel, Bitcoin found a base near the lower boundary and reversed sharply, signaling seller exhaustion and a shift in momentum. This reversal was followed by a breakout above the descending resistance, confirming the end of the bearish phase. Price then entered a consolidation range, where accumulation took place before a confirmed breakout pushed BTC higher. Following the range breakout, the market formed a triangle structure, with price respecting the Triangle Support Line while facing pressure from the Triangle Resistance Line. Recently, BTC revisited the Buyer Zone around 86,300–85,500, which aligns with both horizontal support and the lower triangle boundary. Buyers stepped in at this level, defending the structure and keeping the recovery scenario intact. Currently, BTC is attempting a rebound from the Buyer Zone and is aiming toward the 88,500 Resistance Level (TP1). As long as price holds above the support zone, a move toward this resistance remains likely. A clean breakout above 88,500 would confirm further upside continuation, while rejection could lead to another consolidation or retest of support. For now, the structure favors buyers, with 86,300–85,500 as key support and 88,500 as the main upside target. Please share this idea with your friends and click Boost 🚀

AUDUSD at Decision Point — Trend or Trap?Hey Traders,
In today’s trading session, we are monitoring AUDUSD for a potential buying opportunity around the 0.66200 zone.
Structure:
AUDUSD remains in a well-defined uptrend, and price is currently undergoing a healthy pullback toward the rising trend structure. The 0.66200 area stands out as a key zone of confluence, acting as both dynamic trend support and a prior reaction level.
Context:
As long as price holds above this level, the broader bullish structure remains intact, keeping the path open for a continuation toward recent highs.
Plan:
Watching for bullish reaction and confirmation around 0.66200 before considering continuation setups.
Trade safe,
Joe

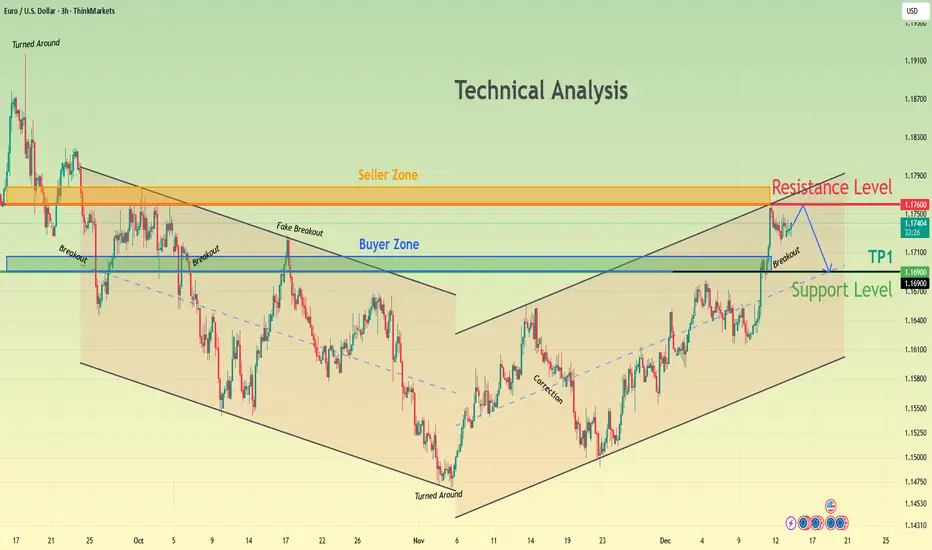
EURUSD Weakens at Seller Zone - Support at 1.1690 Under WatchHello traders! Here’s my technical outlook on EUR/USD based on the current chart structure. After a prolonged bearish move inside a downward channel, EURUSD found a base and reversed from the lower boundary, signaling a loss of bearish momentum. The price then broke above the descending resistance and entered a recovery phase, forming a higher low structure. Following this shift, EURUSD moved into a rising channel, where buyers have been gradually gaining control. Currently, price has pushed into the 1.1760 Resistance Zone (Seller Zone), which previously acted as a strong supply area. The market has already shown signs of rejection from this level, suggesting sellers remain active. Below the current price, the 1.1690–1.1670 Support Level (Buyer Zone) acts as the key demand area and aligns with the lower boundary of the rising structure. As long as EURUSD holds below the resistance, a pullback toward the support zone (TP1) is likely. A deeper correction would still be considered healthy as long as the price remains above structural support. However, a clean breakout and acceptance above 1.1760 could invalidate the short-term bearish pullback scenario and open the way for further upside. For now, the market favors a corrective move, with resistance at 1.1760 and support around 1.1690 as the key levels to watch. Please share this idea with your friends and click Boost 🚀
XAUUSD OVERVIEW FOR 12/16XAUUSD OVERVIEW FOR 12/16
Strategy Summary
Gold is holding steady but the main trend is unclear due to a series of strong news today. I will trade in a "wait for confirmation" style, clearly dividing into two scenarios:
Price increase confirmed when breaking above 4320
Price decrease confirmed when breaking below 4271
1) Important price levels on the chart
4320: confirmation point for buyers + resistance/FVG area above
4370 – 4373: strong liquidity area → prioritize waiting for a reaction to SELL
4271: confirmation point for sellers (break support)
Lower area (according to structure/trend line): deep support area where price may react before bouncing back (as per the arrow drawn)
2) Today's trading scenarios (in "trade the level" style)
Scenario A – Price Increase (only confirmed when breaking above 4320)
If the H1 candle closes clearly above 4320, gold is likely to move up to test the liquidity area above.
Priority at this time: watch for short-term BUY according to the rhythm (as per the arrow), avoid FOMO in the middle.
Reasonable target: heading towards the 4370 – 4373 area (Strong Liquidity).
But note: 4370 – 4373 is an area prone to "sell reaction" due to large liquidity there.
Scenario B – Price Decrease (confirmed when breaking below 4271)
If the price breaks below 4271 and the retest fails, the bearish scenario will prevail (consistent with the "sell retest" idea on the chart).
✅ Sell 4271
SL: 4280
Expectation: the price may extend the downward rhythm to deeper support areas according to the structure.
3) Main SELL order at the large liquidity area
✅ Sell entry: 4370
SL: 4380
Logic: This is a "Strong Liquidity" area – where profit-taking/distribution forces are likely to appear. Only SELL when there is a reaction, do not chase the sell.
4) Today's News
Today there is a series of data that could cause gold to swing sharply and sweep both ends:
Average Hourly Earnings m/m
Core Retail Sales m/m
Non-Farm Employment Change
Retail Sales m/m
Unemployment Rate
Flash Manufacturing PMI
Flash Services PMI
My principle: light volume before the news, wait for the market to "reveal its hand" after the news, then follow 4320 / 4271.
5) Risk Management
Do not enter orders in the middle of the noise. Only trade when the price hits the level and there is confirmation.
Question for everyone: Which scenario do you lean towards today — breaking above 4320 or breaking below 4271?

Weak NFP, Rising Unemployment – Is Gold Set to Rally Again?Hello traders, let’s take a fresh look at the current XAUUSD picture.
In the short term, gold is receiving solid support from the news flow . Tonight’s NFP forecast stands at 51K, sharply lower than the previous 119K . At the same time, the unemployment rate is expected at 4.5%, higher than before. These high-impact U.S. data points are likely to put downward pressure on the USD, which in turn continues to support XAUUSD.
From a technical perspective, the bullish structure remains intact . After the strong prior rally, price is now correcting back toward the 4,270 support zone , where there is a confluence of the Ichimoku cloud and a key demand area . This is a critical zone that allows price to build momentum again, rather than break the trend.
As long as the 4,270 level holds , the most reasonable scenario is for gold to rebound and retest 4,320 (TP1), with a further extension toward 4,350 (TP2) — the upper resistance zone. Only a clear break below 4,270 would call for more caution on the bullish outlook.
In summary, XAUUSD is still in a “pause within an uptrend,” not a sign of weakness. The real question now is not “Will gold rise?” but rather do you have the patience to wait for the right level and follow the trend?

XAUUSD – Lana prefers Sell, Buy is only for scalping XAUUSD – Lana prefers Sell, Buy is only for scalping 💛
Quick Summary
Short-term trend: Downward pressure dominates
Timeframe to watch: H1
Strategy: Sell is primary; Buy is only for short-term, quick trades at liquidity zones
Note: Today there are many US data releases and events, so volatility could be higher than usual
Market Context
The market enters the session with a dense news flow: US President’s speech, unemployment rate, seasonally adjusted non-farm payrolls, and retail sales.
In such a context, gold often experiences strong swings and liquidity hunts before moving in the main direction. Therefore, Lana prioritises selling at higher zones and only buying short-term when the price reaches clear support areas.
Technical View
After the previous upward move, the H1 structure shows that the price is weakening and a continuation of the downtrend is likely.
The upper zone, where short-term resistance converges, is suitable for Sell trades following the intraday trend. Below, liquidity zones may trigger bounce reactions, but Lana considers these only for scalping and does not hold long Buy positions.
Intraday Trading Scenarios
Main scenario – Sell with the trend
Sell: 4308 – 4312
SL: 4320
This is Lana’s preferred zone today. If the price retraces to this zone and shows rejection, the downtrend is likely to continue.
Buy Scenario 1 – Scalping near support
Buy: 4253
SL: 4240
This Buy is only for a short wave, with priority on quick profit-taking when there is a reaction.
Buy Scenario 2 – Scalping at deep liquidity zone
Buy: 4213
SL: 4200
This is a stronger liquidity zone. If the price drops quickly here during news releases, a technical bounce may occur, but Lana still prefers not to hold Buy positions for long.
Session Notes
Asian – European sessions: may see oscillations and technical retracements
US session: can experience strong news-driven moves, sweeping both ends before choosing a clear direction
Each scenario is only a probability, not a certainty.
On high-news days, Lana always reduces position size, sets clear SLs, and accepts skipping trades if the price does not reach the target zones.

XAUUSD(GOLD): Two Entries Both Has Equal Swing Buy PotentialDear Traders,
Buying Setup For OANDA:XAUUSD Based On SMC+ICT Strategy📈
🔺Gold has two potential buying areas. The first is a risky zone where the price may continue its bullish move but also has a risk of bears withdrawing liquidity from the entry area.
🔺Second Entry is more suitable for most types of traders however, due to manipulation in the market we could see early mitigation in the price, which could ultimately invalidating our second entry zone.
Which entry is suitable for you?💭
🔺For most traders, the initial entry can be beneficial although it is inherently risky. In gold trading, risk is always present but it can also lead to greater rewards. Traders may consider entering both with smaller lot sizes and well-thought-out risk management strategies.
🔺Place stop-loss and take-profit orders based on your own assessment of the market as this is a personal decision for each individual or retail trader.
If you like our work then please like and comment on our ideas which will encourage us to post such more analysis. As always follow us to get the most up to date trade ideas.
Team Setupsfx_❤️🏆

Solana (SOL): towards $117?Hi!
SOL remains in a clear descending channel, indicating sustained bearish momentum. After a period of consolidation within the rectangular range, the price recently rejected the upper boundary, forming a potential continuation pattern. The RSI sits near 40, signaling slight oversold conditions but no strong reversal yet. Price action suggests a likely retest of the channel’s lower boundary near $117.48, aligning with the support zone highlighted. Traders should watch for confirmation of a bounce at this level or continuation lower. Short-term pullbacks may occur, but the dominant trend remains bearish.
Conclusion: Trend-following strategy favored; bearish continuation likely, $117 support key.

XAUUSD: Rejection at Resistance - Support Zone at 4,270 in FocusHello everyone, here is my breakdown of the current XAUUSD setup.
Market Analysis
Gold (XAUUSD) is trading within a broader bullish structure, but the current price action suggests a short-term corrective move. After breaking above the descending Triangle Resistance Line, price entered a consolidation Range, where accumulation formed before a bullish Breakout. This breakout pushed XAUUSD higher toward the key 4,350 Resistance, which has acted as a strong reaction zone in the past.
Currently, at this resistance level, price showed clear hesitation and rejection, signaling that sellers are becoming active again. The market is now pulling back from the highs, moving toward the 4,270 Support Zone, which aligns with the previous breakout area and the rising Triangle Support Line. This zone is critical, as it represents the main demand area keeping the structure bullish.
My Scenario & Strategy
My scenario is short-term bearish as long as XAUUSD remains capped below the 4,350 Resistance. I expect a controlled pullback toward the 4,270 Support, where buyers may attempt to defend the trend.A clean breakdown below the support zone would confirm a deeper correction toward the Triangle Support Line.
However, if price holds above 4,270 and shows strong bullish reaction, the broader uptrend remains intact and another attempt toward the highs may follow. For now, the focus is on the pullback phase, with 4,270 as the key level to watch.
That's the setup I'm tracking. Thank you for your attention, and always manage your risk.

LINK - Same Base, Same Question: Is Another Impulse Loading?📊LINK has been respecting a very clean long-term structure.
Each major sell-off has found support around the rising blue trendline, followed by a strong impulsive move higher. This behavior has repeated multiple times, creating a clear rhythm:
correction → base → impulse.🔁
Right now, price is once again sitting on that same structural support, right above the horizontal support zone. The market has slowed down, volatility has compressed, and sellers are losing momentum, conditions that often precede expansion.
The big question now is simple 🤔
Will LINK deliver another impulse from the same base?
⚔️As long as price holds above the trendline and support, the focus remains on trend-following bullish continuation. A clean reaction here keeps the structure intact. A decisive break below would invalidate the setup and change the narrative.
Patience matters here. Let price confirm its intent.
⚠️ Disclaimer: This is not financial advice. Always do your own research and manage risk properly.
📚 Stick to your trading plan regarding entries, risk, and management.
Good luck! 🍀
All Strategies Are Good; If Managed Properly!
~Richard Nasr

XAGUSD (Silver) 1H chart patterns...XAGUSD (Silver) – Target Levels (Based on my Chart)
From the image, price is moving inside an ascending (bullish) channel and is currently near the upper zone / high point of the market. The marked arrows show a possible correction.
🎯 Downside Target Levels
If price gets rejected from the upper channel:
1. First Target: 57.00 – 56.80
Mid / lower support zone of the channel
Likely first pullback area
2. Second Target: 51.50 – 51.00
Major demand & strong support
Channel bottom / deeper correction target
📌 Key Notes
Overall trend is bullish, but price looks overextended
Shorts are valid only after rejection / confirmation
If price breaks and holds above the upper channel, then correction targets are invalid
If my want, tell me:
Buy or Sell setup?
Scalping or Swing trade?
Timeframe (1H, 4H, Daily)?

XAUUSD Clearly Bullish – This Is Not a TrapHello traders, let’s analyze XAUUSD today!
With the current setup, XAUUSD is presenting a clean and well-defined bullish picture , without the need for overly complex speculation.
From a fundamental perspective , the environment is clearly leaning toward the bullish side. A weaker USD combined with declining U.S. bond yields is creating a favorable backdrop for gold. In addition, expectations that the Fed may ease monetary policy remain in place, encouraging capital to continue flowing into gold as both a safe-haven asset and a medium-term speculative instrument. At this stage, the market lacks a strong catalyst capable of reversing XAUUSD’s upward trend.
Looking at the chart structure, the bullish trend is strongly confirmed. Price is moving within a well-defined ascending channel , consistently forming higher highs and higher lows. The Ichimoku system fully supports the bulls, with price holding above the cloud and key lines sloping upward, signaling that this move is structurally strong rather than temporary . The recent pullback should therefore be viewed as a healthy technical correction, not a trend reversal.
In terms of scenarios, the area around 4,280 is acting as a key support zone. As long as price continues to hold above this level, XAUUSD has a strong probability of resuming its upward move toward the 4,400 target, in line with the current channel structure. This scenario aligns both technically and fundamentally.
Wishing you all successful and disciplined trading!
