BTCUSDT . . . LONGHi guys
As it appears from the chart, a bullish hammer pattern is formed ...
You can enter with the next candlestick open to the top of the canal
Put the SL under the shadow of bulish hammer candle
Search in ideas for "CANDLESTICK"

MARUBOZU!A BEARISH Marubozu Candlestick appears in 1H BTCUSDT chart. It's announces a massive short effecting that anticipates a big drop.


Ray Charting Homework Assignment BeginnerWorking on our homework assignment for Hasani.
My assignment was to use the Rays to begin marking up my charts. Tracking for trends in GBPUSD.
My question is.. when placing the ray do you place it at the close of the candlestick or at the wick?

XAUUSD D1 Candlestick PatternIn my opinion gold is making a confirmation to come up back for the following reasons:
1- A D1 Shooting Star
2- Double buttom pattern on H1 chart
3- the price tried to pass the support of 1777-1880 a couple of times and got rejected
I think tommorow the price will try to pass the support again and if it fail to pass it the price will rise, but it has to break the 1996 level first.
Personally i will order a buy limit at 1880 with a small SL at 10$ below (the H4 ATR).
Please dont depends on any other trading decision, rather, see several ideas and oppisite views to build your personal analysis and decision. Personally, there are so many great analysists here that i get advantage of there views

Home depot showing a shooting star🐻1.Over bought RSI on weekly
2.Overbought MFI on daily
3.5 days outside its bollingerband
4. Shooting star candlestick
Minimum pullback to white trendline I feel is due.
381 fibonacci support is my target.

Australian Dollar Ready to Reverse Higher? - AUD/NZDThe Australian Dollar could be readying for its next leg higher against the New Zealand Dollar following losses since early October.
AUD/NZD recently confirmed a bullish Morning Star candlestick pattern, opening the door to extending gains.
But, prices still need to overcome the near-term 20- and 50-Day Simple Moving Averages. Clearing them exposes the 23.6% Fibonacci extension at 1.0486 before making way towards a falling trendline from March.
Otherwise, clearing the key 1.0280 - 1.0331 support zone may see prices resume the downtrend towards the 2020 low.
FX_IDC:AUDNZD

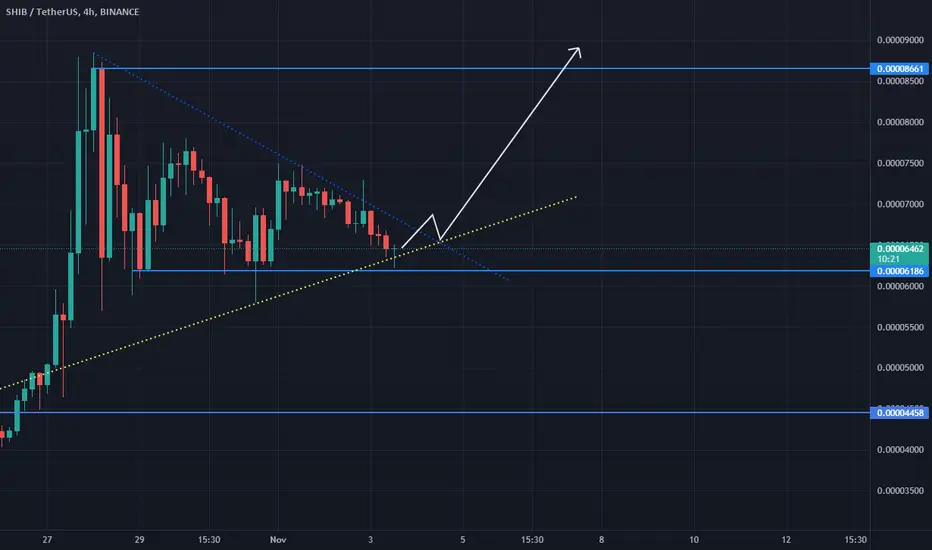
Escape From TriangleConfirmation:
1. Hammer candlestick (4h)
2. Triangle breakout
3. Major support
"It's Time To Rise Up"
AUDUSD breaks the uptrendAUDUSD pair after continuing long terms up channel we're looking The Trend reversal Candlestick Bearish Harami pattern at the top of the up channel.

DXY LONG TERM SELL • market reached a major trendline (weekly)
• for the past two days of last week price has been indecisive resulting in two reversal candlestick patterns (drawn and highlighted) which show a slow down in momentum and possible market reversal.
• so i'll be looking to sell the dollar as of now and reach that support level, but we wait and see what the market does next week and then we adapt to whatever it does and seek opportunity.
please do share your opinions and input :)

BTC bearish 4H candlestick (Bearish Harami/doji)The 4H candle on BTC closed bearish. I think a retracement of todays pump is possible. aiming for couple percent here.

AUD/NZD, Could This be the Turnaround?AUD/NZD is extending gains in the aftermath of a bullish Hammer candlestick pattern.
Prices have since taken out the 20-day Simple Moving Average, a further upside close could confirm the breakout. Such an outcome may place the focus on the 50-day SMA.
Clearing the 50-day SMA may open the door to a material turn higher. In such a case, watch the 1.0541 - 1.0564 inflection zone.
Otherwise, resuming the broader downtrend since March entails clearing the 150% Fibonacci extension at 1.0292 towards the 161.8% level at 1.0252.
FX_IDC:AUDNZD

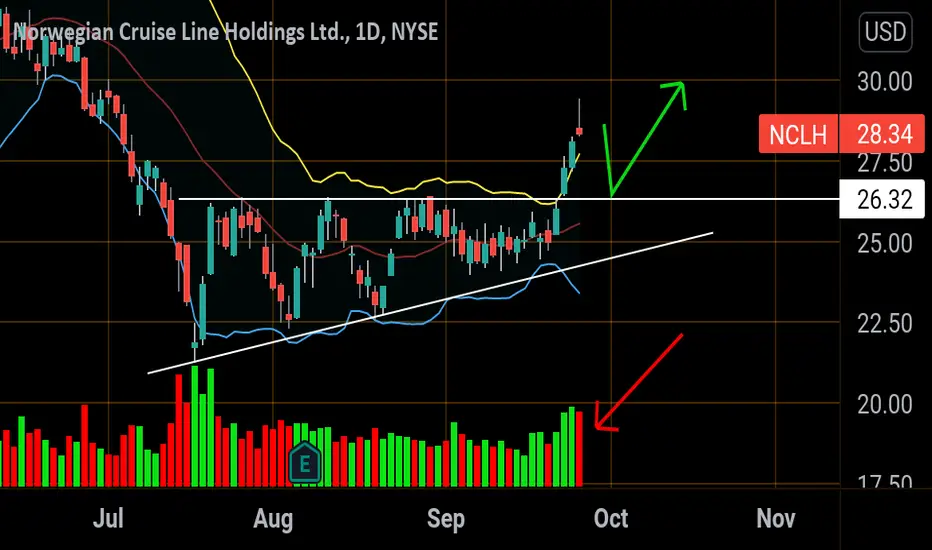
Short NCLH Reasons ?
1. Overextended on Bollingerbands
2. Shooting star candlestick
3. Selling pressure increasing
I think this is just a pullback to breakout at 26.32.. From there let's see
AMD ---- Shootng Star, Falling Gap & Upper Cross - Two Shooting Star candlestick patterns appear on Sep 13 and Sep 15. A shooting star denotes price drop is on the way, but need a confirmation that appeared on Sep 17 in this case. When Shooting Star emerge on top of the wave meaning possible price reversal, but if in the mid of the wave the fall is likely to continue but rather stop sooner.
- The Upper Cross on Sep 20 following a Falling Gap near the support at $102. Upper Cross actually is a variant of the Long Leg Star, but the opening and closing prices are on a higher level. Even though it denotes the calming of a market situation, it still clings towards an upward no matter whether on top or bottom of a wave.

short on dogecoin ifshort on dogecoin if the weekly candlestick close below the red support line, use the fibonacci retracement levels for take profit strategies
Stop loss if react the last high

Tatamotors LongTatamotors Long
Hammer pattern candlestick found at 200 day EMA
Buy at CMP- 288
SL- 268
Target- 305, 324
Disclaimer- We are not SEBI registered advisor.
Charts and views are only for educational purpose.

Candlestick bar needs to close above resistance For a continued uptrend a candlestick bar needs to close above the previous resistance .32 area.

Candlestick Analysis Only Based on this candlestick analysis will ZM return to a higher high? OR is a down trend about to start?
You are the analyst
Comment your thoughts below

Eurjpy (downtrend may continue)Looking for sell at candle close.. Doji candlestick pattern formed at trendline resistance

Bearish Three-Line Strike Candle Pattern: Bullish reversalSource & Credit: thepatternsite "My testing of the bearish three-line strike candlestick pattern shows that it acts as a bullish reversal 84% of the time instead of the bearish continuation that candle theory suggests. Unfortunately, with a frequency rank of 94, it will be difficult to find. The overall performance rank is 1, the best out of 103 candle patterns. The 8.81% average drop in a bull market is well above the 6% that I consider good. That performance also ranks first, but price only meets the target 80% of the time. The price target is the height of the candle projected upward or downward from the top or bottom of the candle pattern, respectively. Tall candle patterns have a more difficult time meeting targets than do short patterns."
So, wait to break and close above 2,040 and a possible target of 2,340.
Take care.

Waiting for Climax Bar and FakeoutHere I will wait climax bar, it is a big candlestick in the last of strong impulse after consolidation in lower time frame. Yes, the price showed consolidation in lower time frame. In the TF 240, the candle form inside bar. The price will go down for the last to break the support for fakeout. Why the price will do this, because the Institution traders need liquid area for taking their profit, and lower than the support is where a lot of stop loss is set.
To make sure, we need to check in lower time frame when the price get close with the zone. If the price show decreased momentum, the reversal surely will come. If not, don't trade, but I already set limit buy. It's worth risking to set it in the right zone.

Rising wedge. 3 black crows📈Fell through trend support of rising wedge. Candlestick pattern formed 3black crows,RSI in full nose dove, Macd death cross, OBV bearish
Wedge target is usually entry width of wedge.
Up 8 straight weeks , correction was due.
All of those high PE growth stocks will suffer the most
Nvda
Roku

OSTK (Short term bearish) longFormed a symmetrical triangle since last august. I think this the last trip to channel bottom at 74$ before a breakout that could possibly occur around earnings. I think this breakout will take us back to ATH 130+..
showing 3 black crows candlestick pattern, doubletop if it breaks that white trendline. short to 75$ , cover and go long into earnings
