OILHere my outlook on Oil is still bullish following from last year when we managed to sustain above the $45 region which acted as strong support for this commodity.
My projected target as you can see for the remaining of 2018 will firstly be -
- Target 1 $82 region
- Target 2 $95 region (Long Term)
Search in ideas for "COMMODITY"

ETHUSD 4H CCI SHORT TRADEStep #1: Wait until the CCI indicator crosses below -100 level
When we get a CCI reading below the -100 level, that shows statistically the USD gained more strength than average and therefore great for selling opportunities.
As a leading indicator, the Commodity Channel indicator can provide us with excellent great trade signals.
When the CCI crosses for the first time below the -100 level that’s the signal that a new bearish trend is about to start or at least a rally will emerge from where you can extract sound profits.
Step #2: Wait for a retracement and make sure that during that retracement the CCI indicator holds below the zero line.
Waiting for a pullback in price is a more defensive trading approach. However, you can also sell right away when the CCI crosses below -100. In this case, you need to make sure enough time has elapsed between now and the last time the CCI passed below -100.
We’re going to apply the more conservative approach and wait for a retracement and the CCI indicator to hold below the zero line during this retracement.
We want to see a weak retrace in the CCI indicator that barely goes above the -100 level, but at the same time, we need to look at the price action retracing more than the CCI did.
We want to have strength to the downside, if we’re going to sell ETH/USD we want to see continued strength in the CCI reading when the price is pulling back.
When the retracement happens, it’s important for the CCI indicator to remain below the zero line. If the CCI crosses above the zero line during the retracement, we’re no longer interested in going short ETH/USD.
This is one perfect example of how to filter bad trades from the right trades.
Note* The less the CCI turns up, the more powerful the rally should be.
Step #3: Sell after 3 or 5 candles “worth” of retracement. Or, sharp Corrections are sold at the closing price.
Now, we’re looking for short trades.
We have two options for our entry strategy.
We either sell after we have seen the market pulling back over the last 3-5 candles or we sell straight away if we have sharp corrections.
The natural ebb and flow of the market are given by these short-term pullbacks that we’re going to use to trigger our entry.
If the retrace was weak, it means the dominant energy of the market remains. The CCI indicator strategy reflects quite well what is happening behind the scene where the actual buying and selling pressure takes place.
Step #4: Place your protective Stop Loss below the most recent swing low
We’re proposing a very easy strategy to manage your stop loss. Simply place your protective stop loss below the most recent swing low.
However, it’s important to also watch the CCI indicator for further clues of weakness, and if the CCI crosses above the +100 level after you’ve entered the market, you can close the trade at the market price if your stop loss wasn’t triggered in the process.
Step #5: Take profit if CCI touches -200 or if CCI drops above the zero level. Whichever happens first.
We have two trading tactics to implement when dealing with exits.
The more profitable exit strategy is to take profits when the CCI touches the +200 level. However, since the market will only occasionally give us such big trading opportunities we need to have a backup plan.
So….
As soon as the CCI indicator turns below the zero level, we want to exit our trade. The first sign that the rally is running out of steam is when the CCI indicator crosses below the zero line.
I have also shown here 2 other options of taking profit. One is risk reward ratio (1to1, 2to1, 3to1). The second is a fib extension take profit. This trade hit the 227.2% fib.
Note** the above was an example of a SELL trade using our CCI trading strategy PDF. Use the same rules for a BUY trade – but in reverse.
PM me if you want to read the complete CCI trading strategy. Some intro information is on the update below.

GOLD XAUUSD Target Hits 1Gold finally breaks the resistance formed on the downside at 1301. I had posted the chart a month back, it was clear that gold will fall due to multiple attempts to the upside but couldnt breakthrough. We can see some minor pull back to 1301 and than another leg down towards 1275/70, I am looking at 1220 being my first target on the down side. as long as it stays below 1305, We can expect big leg downs on this commodity.

GOLD Retains Its Upside PressureGOLD: The commodity continues to hold on to its upside pressure short term leaving risk higher in the new week. On the downside, support comes in at the 1,270.00 level where a break will turn attention to the 1,260.00 level. Further down, a cut through here will open the door for a move lower towards the 1,250.00 level. Below here if seen could trigger further downside pressure targeting the 1,240.00 level. Conversely, resistance resides at the 1,290.00 level where a break will aim at the 1,300.00 level. A turn above there will expose the 1,310.00 level. Further out, resistance stands at the 1,320.00 level.
Strategy: Buy at 1,279.00, Stop loss at 1,264.00, Price target at 1,295.00 & 1.305.00

Divergence in GoldGold Divergence was found in weekly chart hence my 3rd confirmation for Gold Long for 1275.
Using Pitchfork Tool and Commodity Channel Index (CCI).

Down underAfter a trip along the side of the Bolli band, aussie seems now ready for a nice short. The shape of the last two candles and the fact that he's soon to go back to the sub-100 region of the commodity channel are factors enough to think about shorting it.
A couple of fibs converge on the price labels shown.
Like to hear your comments.

Palladium - Wedge for next movementChart shows everything but I'm on the short side of this commodity. Waiting a confirmation before entering a new position. But we could see a possible consolidation between 520 - 480

AUDUSD GREAT H4 SHORT POTENTIAL VERY TIGHT STOP GREAT CHANNEL £$Very clean detailed S/R x Fibonacci retrace analysis, 62.8% retracement occurring last 2 candles suggest bullish momentum is dying out!
This trade for me is a channel trade, I use Fibonacci and S/R to add confluence. Please zoom out and examine these areas
The diagonal channel is 3 - 4 months old and very valid and we have seen price already bounce off the top channel 4 times.
Very tight stop any violation of channel suggest full trend reversal.
Commodity channel index overbought currently heading south with break of diagonal bottom
Good luck and happy trading :)

ALN2015 Weekly Chart - SimpleSimply Aluminum is in down trend and also LME raised some customs pricing this week this will trigger more short on this commodity.
I'm sitting on short till chart shows me a reversal. Its good to take this risk.

What Are Commodity Currencies and How Do They Correlate?What Are Commodity Currencies and How Do They Correlate?
Commodity currencies are those tied to the value of a country’s key exports, such as oil, metals, or agricultural goods. Their movements are influenced by shifts in global demand, supply disruptions, and economic policies. In this article, we will explore how commodity prices impact commodity-linked currencies and what traders may need to consider.
What Is a Commodity Currency?
The commodity currency definition refers to currencies issued by countries whose economies rely heavily on exporting natural resources. Their value tends to fluctuate in line with the prices of key commodities like oil, metals, and agricultural goods. When these exports become more valuable, the national economy benefits, often leading to a stronger currency. Conversely, when commodity prices fall, these currencies tend to weaken due to declining export revenues. Several well-known commodity-based currencies fall into this category.
Canadian Dollar (CAD) – Oil and Trade with the US
Canada is one of the world’s largest crude oil exporters, making CAD highly sensitive to oil price fluctuations. A rise in oil prices typically strengthens CAD, as higher revenues improve Canada’s trade balance and economic outlook. CAD also reacts to US economic performance, given that over 75% of Canadian exports go to the US. If US demand weakens, CAD can struggle even if oil prices move in a narrow range.
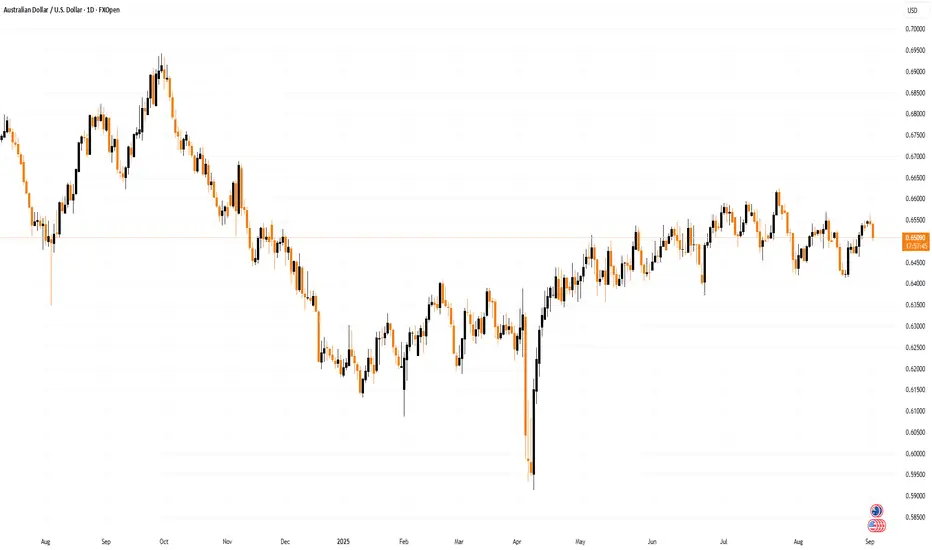
Australian Dollar (AUD) – Iron Ore, Coal, and China’s Economy
Australia is a major supplier of iron ore and coal, with China as its biggest buyer. AUD often moves in response to Chinese industrial activity and infrastructure investment. If China’s economy slows, reduced demand for raw materials can weigh on AUD. Interest rate decisions from the Reserve Bank of Australia (RBA) also play a role, particularly when rates diverge from global peers.
New Zealand Dollar (NZD) – Dairy and Agricultural Exports
New Zealand is the world’s largest dairy exporter, with milk products accounting for a significant portion of its trade. NZD tends to strengthen when global dairy prices rise, especially when demand from Asia is strong. However, because New Zealand has a smaller, more trade-dependent economy than Australia, NZD is also influenced by broader market sentiment and risk appetite.
Norwegian Krone (NOK) – Oil and Energy Markets
Like CAD, NOK moves with oil prices, but its sensitivity is heightened by Norway’s reliance on offshore oil production. Shifts in European energy policy, such as demand for alternative fuels, can also impact NOK beyond direct oil price movements.
Brazilian Real (BRL) – Agriculture and Metals
BRL is driven by Brazil’s exports of petroleum oils, iron ore, soybeans, and other agricultural products. Political stability and investor confidence in emerging markets also affect BRL, making it more volatile than some other commodity currencies.
Key Drivers of Commodity Prices
Commodities fluctuate based on a range of global economic forces, from supply and demand dynamics to geopolitical shifts and financial market activity. Understanding these factors may help traders analyse price trends and their potential impact on commodity-linked currencies.
1. Global Supply and Demand
The fundamental driver of commodity prices is the balance between production and consumption. When supply is tight due to poor harvests, mining disruptions, or oil production cuts, prices tend to rise. Conversely, oversupply—such as when oil producers flood the market—can push prices lower.
2. Economic Growth and Industrial Activity
The demand for commodities is closely tied to economic expansion. Rapid industrial growth increases demand for raw materials like iron ore, copper, and oil. China, for example, is the world’s largest commodity consumer, meaning its economic cycles have a major impact on global prices. A slowdown in Chinese manufacturing can weaken demand, driving commodities and related currencies lower.
3. Geopolitical Risks and Trade Policies
Wars, sanctions, and trade agreements can disrupt supply chains, affecting commodity availability and prices. Sanctions on oil-producing nations or conflicts in key mining regions can tighten supply, driving prices higher. On the other hand, trade agreements that reduce tariffs can boost commodity exports, influencing prices.
4. Central Bank Policy and Inflation
Higher inflation often pushes commodity prices up, as investors turn to raw materials as a hedge against currency devaluation. Central banks responding with interest rate hikes can curb inflation but may also reduce economic activity, lowering commodity demand.
5. Speculation and Market Sentiment
Commodities are heavily traded in futures markets, where speculative activity can cause price swings. Traders believing in higher future demand can drive up prices, while negative sentiment—such as recession fears—can lead to sell-offs.
How Commodity Prices Influence Commodity Currencies
Commodity currencies don’t just track export price movements—they react to broader economic shifts. Here’s how changes in commodity prices correlate with these currencies:
1. Trade Balance and Export Revenues
When commodity prices rise, exporting nations see higher revenues, improving their trade balance and strengthening their currency. Foreign buyers need to exchange their currency for AUD, CAD, or NOK to purchase commodities, increasing demand. When prices fall, the reverse happens, weakening a commodity currency.
2. Economic Growth and Investment
Higher commodity prices often stimulate economic growth in resource-rich countries, leading to increased business investment and job creation. This can improve confidence in the currency. However, if rising prices contribute to inflation, central banks may intervene, affecting currency performance.
3. Interest Rates and Inflation Control
If commodity price increases drive inflation, central banks may consider raising interest rates to stabilise the economy. These higher interest rates tend to attract investors and create buying pressure in the currency. However, if commodity prices drop sharply, central banks may lower rates to support economic growth, putting downward pressure on the currency.
4. Risk Sentiment and Capital Flows
Commodity currencies are often tied to investor risk appetite. In strong market conditions, investors seek higher yields and favour currencies like AUD, NZD, and CAD. But in times of uncertainty—such as economic downturns or geopolitical crises—investors typically move into so-called safe-haven assets, causing commodity currencies to weaken.
5. Global Supply Chain Disruptions
Natural disasters, political instability, or trade restrictions can disrupt commodity supplies. If this leads to higher commodity prices, it often strengthens commodity currencies. However, if demand falls due to economic downturns, both commodity prices and related currencies can suffer.
Implications for Traders
Understanding how commodity prices affect currencies provides traders with insights into market dynamics. For example, traders regularly track oil price reports, iron ore demand forecasts, or global agricultural market updates.
Because commodity currencies often reflect underlying shifts in global economics, traders frequently monitor economic indicators. Economic indicators from major commodity-importing nations—like China’s manufacturing data—are particularly influential, as they provide clues about future demand trends.
Additionally, commodity-linked currencies often respond strongly to shifts in risk appetite. Traders recognise that positive market sentiment typically lifts these currencies, while concerns about global growth or market instability can trigger weakness. This relationship helps traders assess broader market conditions, including when investors might favour riskier or so-called safer assets.
Interest rate differentials between commodity-exporting countries and other major economies are also closely observed. Traders believe that rising interest rates may attract capital inflows and support currency appreciation, especially if commodity prices remain firm.
The Bottom Line
Commodity currencies are closely tied to global economic trends, supply and demand shifts, and market sentiment. Awareness of these relationships may support traders in creating their forex and commodity trading strategies Monitoring commodity markets, interest rate decisions, and geopolitical events may be helpful when navigating commodity currencies.
FAQ
What Are Commodity Currency Pairs?
Commodity currency pairs consist of a commodity-linked currency traded against another currency, typically a major one like the US dollar. Examples include USD/CAD, AUD/USD, and NZD/USD, where CAD, AUD, and NZD are influenced by commodity prices.
What Is Forex and Commodity Trading?
Forex trading involves exchanging currencies, while commodity trading focuses on raw materials like oil, metals, and agricultural products. Since some currencies are tied to commodities, both markets often move together.
What Is the Most Traded Commodity Currency Pair in Forex?
USD/CAD is known as one of the most traded commodity currency pairs. Canada’s reliance on oil exports makes CAD highly responsive to crude oil prices, resulting in notable currency correlations with oil market movements.
This article represents the opinion of the Companies operating under the FXOpen brand only. It is not to be construed as an offer, solicitation, or recommendation with respect to products and services provided by the Companies operating under the FXOpen brand, nor is it to be considered financial advice.
MAG Silver – A Pure-Play Winner in the Precious Metals RallyCompany Snapshot:
AMEX:MAG Silver is uniquely positioned as a high-beta play on silver and gold, with nearly all revenue tied to precious metals exposure—making it a standout in the current macro-driven metals bull run.
Key Catalysts:
High Leverage to Silver 🌐
With almost all income derived from silver and gold sales, MAG offers direct upside as investors flock to safe-haven assets amid inflation, rate uncertainty, and geopolitical risk.
Juanicipio Growth Engine ⛏️
Operated by top-tier partner Fresnillo, the Juanicipio project continues to scale efficiently, tapping into new high-grade zones that will further boost output and margins.
Financial Strength 💰
A debt-light balance sheet and healthy cash reserves give MAG financial flexibility, minimizing dilution risk and providing insulation during volatile market cycles.
Investment Outlook:
Bullish Entry Zone: Above $18.00–$19.00
Upside Target: $28.00–$29.00, driven by silver tailwinds, project scalability, and financial discipline.
🥇 MAG Silver stands out as a low-risk, high-reward name for investors seeking direct exposure to silver’s breakout.
#SilverStocks #Gold #MAGSilver #SafeHaven #PreciousMetals #Juanicipio #Fresnillo #CommodityRally #HardAssets #MiningStocks #InflationHedge #Geopolitics #MetalBulls

Decline of the US Dollar Means Commodities Will Continue To RoarThe pound sterling, the United Kingdom’s foreign currency instrument, was the global reserve currency in the 19th century and the first half of the 20th century. For decades, the US dollar has been the world’s reserve currency, which became official in 1944 after a delegation from forty-four allied countries decided that the world’s currencies would no longer be linked to gold but pegged to the US dollar, which was linked to gold. The Bretton Woods Agreement established the authority of central banks to maintain fixed exchange rates between their foreign exchange instruments and the US dollar. In turn, the US would redeem US dollars for gold on demand. The redemption option ended in 1971 when President Richard Nixon announced that the United States would no longer convert dollars to gold at a fixed value.
The dollar’s link to commodities
Three factors that will continue to weigh on the dollar’s global role
Expect higher base prices for commodities
Long-term trends are very bullish
Buying dips is likely to be the optimal approach
For seventy-eight years, since the end of World War II, the US dollar has been the king of the currencies. On December 27, 1945, the participating countries signed the Bretton Woods Agreement. On August 15, 1971, President Nixon abandoned the gold standard. On February 4, 2022, a handshake on a “no-limits” support agreement between Chinese President Xi and Russian President Putin may go down in history as the beginning of the end of the US dollar as the leading world reserve currency. The watershed event could have far-reaching consequences for markets across all asset classes. Commodities are global assets. The end of the dollar’s reign as the monarch of money will likely lift raw material prices in dollar terms in the coming years.
The dollar’s link to commodities
As the world’s reserve currency, the dollar has been the leading global pricing mechanism for most commodities. Over the past decades, a rising dollar often weighed on commodity prices as the essentials became more expensive in other currency terms. A weak dollar encouraged buying as prices fell in different foreign exchange instruments.
While the US is the world’s leading economy, the population at around 333 million is only 4.2% of the total number of people on our planet. Therefore, the dollar’s link to commodities is financially based on the US position in the global financial markets and not on the supply and demand equations for the raw materials.
If the dollar’s role in the world declines, its link to commodity prices will diminish.
Three factors that will continue to weigh on the dollar’s global role
King dollar is facing a challenge in 2022 as world economic and political events threaten its dominance. The US dollar faces at least three issues that continue to erode its purchasing power and role in the global economy:
Inflation - The February US CPI and PPI data pointed to the highest inflation in over four decades. The March data will be even worse. The Fed began increasing short-term interest rates but remains far behind the inflationary curve. Rising inflation erodes the US dollar’s purchasing power.
Geopolitical tensions - The war in Ukraine and China’s support for Russia has dramatically changed the geopolitical landscape. In the leadup to the expansionary move, Russia reduced its US dollar reserves, increasing holdings in euros and gold. Sanctions on Russia will likely cause China to follow the same course. China is the world’s second-leading economy, and Russia is a leading commodity-producing country. As China and Russia move away from using the US currency as a reserve currency, the dollar’s global role will decline. Geopolitical tensions have accelerated the descent.
The decline of fiat currencies - The rise of cryptocurrencies is a sign of the fall of fiat currencies. Cryptos derive value from bids and offers for the currencies in an open and transparent market that transcends borders. Fiat currencies derive value from the full faith and credit in the governments that issue the legal tender. Meanwhile, rising commodity prices signify the decline in the dollar’s purchasing power.
The dollar index measures the US currency against other world currencies, but it is a bit of a mirage as when all fiat currencies lose value, it is not apparent. The dollar index measures the US currency against other world reserve currencies, including the euro, yen, pound, Canadian dollar, Swedish krona, and Swiss franc. The most significant weighting, at 57.6%, is against the euro currency. The dollar may be moving higher against the basket of currencies, but that does not mean that all of them, including the dollar, are losing value.
Expect higher base prices for commodities
The decline of the dollar and all fiat currencies makes purchasing power drop and commodity prices rise. Therefore, a strong dollar index has not weighed on many commodity prices over the past year.
The weekly chart shows that the dollar index has rallied, making higher lows and higher highs since early 2021. Over that period, most commodities have risen to multi-year and all-time highs. The strength of the dollar did nothing to restrain increasing raw material prices.
Meanwhile, higher US interest rates increase the cost of carrying commodity inventories and boost the US dollar’s value against other currencies.
The weekly chart of the US 30-Year Treasury bond futures shows the pattern of lower highs and lower lows, pushing long-term interest rates higher.
The bottom line is that a rising dollar and increasing US interest rates have not stopped commodity prices from rallying since early 2021.
Higher interest rates, rising inflation, geopolitical turmoil leading to supply chain issues, and sanctions that interfere with many raw materials supply and demand equations mean that production costs are rising. The base prices for raw materials are moving higher.
Long-term trends are very bullish
Bull markets rarely move in straight lines, and since commodities are highly volatile assets, corrections can be brutal. However, the long-term charts in four leading commodities, copper, crude oil, corn, and gold, display the same bullish patterns.
The quarterly chart of COMEX copper futures shows the bullish pattern over the past two decades.
The highly political crude oil market displays the path of least resistance of the price is higher. US energy policy and geopolitical turmoil have only exacerbated the upward trajectory of the energy commodity since April 2020.
Corn’s price path has been higher, making higher highs and higher lows for decades.
Gold’s bull market dates back over two decades. Gold may be the best example of the decline in fiat currency values as it is a hybrid between a commodity and a foreign exchange instrument.
Many other commodities display the same long-term trends. The recent strength in the US dollar means that commodity prices in other currencies have followed even more bullish price paths over the past year.
Buying dips is likely to be the optimal approach
The trend is always your best friend in markets. While short-term and medium-term traders follow technicals that depend on the market’s sentiment, long-term trends are a function of macro and microeconomic factors. The decline of fiat currency values continues to push commodity prices higher.
Over the past decades, price corrections have been long-term buying opportunities in the commodities asset class. The economic and geopolitical landscapes point to a continuation of the trend. Buying on price weakness has offered optimal results. Even if the US dollar index continues to rise, it will not mean the currency is strong. The foreign exchange market is a mirage that only measures one fiat currency’s value against another. Commodity prices are the actual value indicator, and the long-term trends reveal that currencies are all losing purchasing power.
We remain bullish on commodities. However, the higher the prices, the more vicious the corrections will become. Buying when they look the worse could be the best course of action over the coming months and years.
--
Trading advice given in this communication, if any, is based on information taken from trades and statistical services and other sources that we believe are reliable. The author does not guarantee that such information is accurate or complete and it should not be relied upon as such. Trading advice reflects the author’s good faith judgment at a specific time and is subject to change without notice. There is no guarantee that the advice the author provides will result in profitable trades. There is risk of loss in all futures and options trading. Any investment involves substantial risks, including, but not limited to, pricing volatility , inadequate liquidity, and the potential complete loss of principal. This article does not in any way constitute an offer or solicitation of an offer to buy or sell any investment, security, or commodity discussed herein, or any security in any jurisdiction in which such an offer would be unlawful under the securities laws of such jurisdiction.

Avoid Getting Burned with Commodity ETFsBefore retail investors (especially degenerate zoomers) were incinerating capital on leveraged single-stock ETFs and synthetic income products flashing double-digit yields (most of which is just return of capital), older generations were losing money on commodity ETFs.
Some of that came from making the wrong directional bets during extreme periods like March 2020, when the onset of COVID-19 pushed oil prices negative and liquidated a ton of overconfident traders. But a huge portion of losses had nothing to do with timing and everything to do with picking the wrong kind of commodity ETF and getting eaten alive by structural deficiencies.
Since the last half decade has brought new innovation to the space, it is worth revisiting the common pitfalls. Three issues in particular make some commodity ETFs unpalatable in my opinion: high fees, K-1 forms, and contango.
High Fees
Fees are straightforward. Even if a commodity ETF is not meant to be held long term, you still pay an expense ratio. It is calculated annually as a percentage of net asset value but deducted gradually in the background, silently reducing net returns.
Because this category is more specialized and often uses futures contracts, you should expect somewhat higher costs. But you can still be selective, as there are some absurdly priced products out there.
Costs can be reasonable if you take the time to look carefully. There are broad commodity ETFs like the SPDR Bloomberg Enhanced Roll Yield Commodity Strategy No K-1 ETF (CERY) at 0.28% or the iShares Bloomberg Roll Select Commodity Strategy ETF (CMDY) at 0.29%.
3rd party Ad. Not an offer or recommendation by Investing.com. See disclosure here or remove ads.
On the other hand, it can get ugly fast. The Volatility Shares 2x Wheat ETF (WHTX) and Volatility Shares 2x Corn ETF (CORX) both charge 1.85%. Even some active broad options like the PIMCO Commodity Strategy Active ETF (CMDT) come in at 1.16% (and on that note, I’m not sure why anyone would buy a commodity ETF from PIMCO, a bond specialist).
Unless you specifically want short-term trading exposure and not long-term portfolio diversification, I would avoid the overly expensive choices.
K-1 Forms
I hate these things A K-1 is a tax form issued by partnerships that reports your share of income, deductions, and credits. Many commodity funds use partnership structures, which means unitholders receive a K-1 form come end-of-year tax time.
Most investors try to avoid them. The forms tend to arrive later in the tax season, which can delay your entire filing. The information they contain is more detailed than a typical 1099, so you may need extra record-keeping or professional help just to get it entered correctly.
You can also be allocated taxable income even when you didn’t sell anything, which catches newer investors off guard. Add in the possibility of multi-state reporting if the partnership earns revenue in several jurisdictions, and the whole process becomes more work than many investors want from a simple ETF position.
Some ETF issuers have recognized this pain point and now structure their products to issue simple 1099-DIV forms. These are easier to file and avoid the partnership complications entirely.
New Crop Beans Probe Below the Teens - Did Lumber Give the Clue?Last week, the commodities sector experienced more than a speed bump after an extended period of price appreciation. As July soybeans roll to the next active month and the new crop November contract in the futures market, the price became a falling knife before recovering on Friday, June 18.
Beans tank
They were not the only commodities
A Fed hint made its transitory wish come true
Lumber continues to give clues as it moves first
The legacy of COVID-19 will live on- Bull market dips can be brutal
July beans have been in the teens for most of 2021. New crop November beans rose into the teens in April and remained there until mid-June when they briefly fell below $13 per bushel.
While the weather across the critical growing regions is the primary factor driving the price of the oilseed futures, all commodity prices fell last week. Ironically, lumber has been signaling a correction was on the horizon since mid-May. The illiquid lumber market has a habit of leading commodity prices, making it a crucial sentiment benchmark. I never trade lumber because of its limited liquidity, but I watch the price action like a hawk.
Beans tank
Nearby CBOT soybean futures reached a high of $16.6750 in May 2021.
The chart shows the rise to the highest price since September 2012 when soybean futures reached a record $17.8900 peak. Chinese demand, the weather conditions and COVID-19 in South America, and falling global inventories pushed the price to the high last month. Nearby soybean prices have been mainly in the teens throughout 2021, only dipping to a low of $12.98 in January.
The recent selling took the price down to a low of $13.2350 per bushel last week before it covered to around the $14 level. New-crop November soybeans have been trading in backwardation to the nearby July contract. Backwardation is a condition where nearby prices are higher than deferred prices. Backwardation is a sign of tight supplies or a market deficit.
The market has remained optimistic that the 2021 crop year will produce enough oilseeds to meet the growing global demand.
The chart of soybeans for delivery in July 2021 minus November 2021 shows the backwardation narrowed from a high of $2.29 per bushel in January to the 82.25 cents level at the end of last week. However, at 82.25 cents, the July beans continue to command a hefty premium to the new crop November beans.
The chart shows that the November futures contract entered the teens, with the price rising above $13 per bushel in late April and remained there until last week when it probed under the level. However, the November contract recovered, and new crop beans were still in the teens as of June 18. At $13.15, soybeans for November delivery corrected by over 11% from the June 7 high at $14.80 per bushel.
They were not the only commodities
Soybeans were not the only commodities to experience selling over the past weeks. Corn and wheat prices decline. Copper, a leading metal, fell from a record high at nearly $4.90 per pound in May to settle below $4.16 last week, a 15% decline. Palladium reached an all-time high of $3019 per ounce in May and was trading around the $2470 level on June 18, over 18% lower. Metals, industrial, and agricultural commodities fell sharply last week.
The only markets that remained near the recent highs were crude oil and natural gas. The strength in the energy sector is likely a function of the shift in US energy policy, causing tighter regulations on drilling and fracking at a time when demand is booming in the wake of the global pandemic.
A Fed hint made its transitory wish come true
The selloff in commodities began before the June 10 Fed meeting but selling accelerated in its aftermath. The Fed did not change monetary policy. The only concrete change was a slight five basis point increase in the reverse repo rate. However, the central bank shifted its rhetoric from “not thinking about thinking about” rate hikes or tapering QE. The FOMC members decided it was an excellent time to begin thinking. The May CPI data that shows inflation rising by 5% and the 3.8% rise in core inflation, excluding food and energy, was enough for the central bank to hint that rates could head higher and QE could begin to taper in 2022. The prospects of a less accommodative Fed caused a cascade of selling in markets across all asset classes.
On Friday, June 18, hawkish comments by Fed Governor James Bullard caused selling in the stock market. While the Fed continues to characterize rising inflationary pressures as “transitory,” the more hawkish comments and forecasts may have made its characterization comes true, at least in the short term. The correction in commodity prices will likely cause a decline in inflation data over the coming months if prices continue to fall or sit around the current levels.
Lumber continues to give clues as it moves first
The illiquid lumber futures market provides the commodity market with clues over the past months on the up and the downside. Before 2018, the lumber price never traded above $493.50 per 1,000 board feet, the 1993 high.
The annual chart dating back to 1972 shows the explosive move in lumber that took the price to a high of $659 in 2018, $1000 in 2020, and $1711.20 in 2021.
The weekly chart shows lumber futures rose above the 2020 high in mid-February 2021, months before other commodity prices reached record or even multi-year highs. Lumber peaked at $1711.20 during the week of May 10 and became a falling knife. The turn came before other commodity prices corrected dramatically in June.
Lumber may be an illiquid market that does not offer trading or investment opportunities, but it has been an impressive barometer for the future path of least resistance for raw material prices. I never trade lumber, but I watch the price action in the wood market like a hawk.
Last week, nearby lumber futures fell to a low of $855.10 per 1,000 board feet and settled below the $900 level on June 18. Lumber has nearly halved in price from the early May high, just six short weeks ago. Put lumber on your radar as a critical indicator of commodity market sentiment. Over the past year, lumber rallies have been a harbinger of bullish trends in the raw materials asset class. Falling lumber prices have signaled that corrections are on the horizon.
The legacy of COVID-19 will live on- Bull market dips can be brutal
Meanwhile, the correction in commodities was brutal last week, but the asset class remains in a bullish trend since the March and April 2020 lows. Even the most aggressive bull markets rarely move in straight lines. The higher prices move, the odds of brutal corrective periods rise. The cure for high prices in commodities is those high prices as producers increase output, and demand tends to decline when raw materials become too expensive for consumers.
We are still in the early days of the post-pandemic era. The tidal wave of central bank liquidity and tsunami of government stimulus continue to overwhelm the financial system. The CPI data told us that inflation is a clear and present danger. Whether it is “transitory” is a question that remains. Real estate prices are soaring; the stock market remains near its all-time high. Digital currency prices suffered severe corrections, but they remain far higher than 2020 levels. The US dollar may be bouncing against other world currencies, but that could be a mirage. Measuring the dollar’s value against other foreign exchange instruments provides an incomplete picture. If all fiat currencies are losing purchasing power, the dollar may only be the healthiest horse in the foreign exchange glue factory.
Inflationary pressures will not go away overnight. Even if the Fed begins increasing the short-term Fed Funds rate and tapers QE, the liquidity in the financial system remains at unprecedented levels. Government spending is not likely to decline under the current administration in Washington, DC.
The impact of liquidity and stimulus in 2008 drove commodity prices higher until 2011-2012. The levels in 2020 and 2021 are far higher than in 2008. As I recently wrote, Albert Einstein defined insanity as doing the same thing repeatedly and expecting a different result. Professor Einstein would likely be a buyer of commodities on the current price dip as we are still in the early days of the bullish cycle if the period from 2008-2012 is a model.
As vaccines create herd immunity to COVID-19, the virus will continue to fade into the market’s rearview mirror. However, the legacy will live on for years. I will be watching lumber for clues. When the wood price hits bottom and turns, it could provide another hint that commodity prices will reach higher lows sooner rather than later.
When it comes to the soybean and other agricultural markets, rising inflation is bullish, but Mother Nature will dictate the path of least resistance for prices. The 2021 crop will be a function of the weather conditions across the fertile plains in the US and other growing regions in the northern hemisphere over the coming weeks. Commodities remain in bull markets, despite the recent selloff on the back of the Fed’s rhetoric. Any significant shift in monetary policy remains months away. A rising dollar and higher interest rates could cause lots of turmoil in markets across all asset classes, but the damage from the liquidity and stimulus that stabilized the economy and financial system will last for years to come. I remain a commodity bull, despite the recent selloffs and view them as buying opportunities.
Picking bottoms in markets is a fool’s game, so we trade with the trends. However, the odds and fundamentals favor higher lows in the inflation-sensitive asset class.
Sign up for the free Monday Night Strategy Call using the link below!
Trading advice given in this communication, if any, is based on information taken from trades and statistical services and other sources that we believe are reliable. The author does not guarantee that such information is accurate or complete and it should not be relied upon as such. Trading advice reflects the author’s good faith judgment at a specific time and is subject to change without notice. There is no guarantee that the advice the author provides will result in profitable trades. There is risk of loss in all futures and options trading. Any investment involves substantial risks, including, but not limited to, pricing volatility , inadequate liquidity, and the potential complete loss of principal. This article does not in any way constitute an offer or solicitation of an offer to buy or sell any investment, security, or commodity discussed herein, or any security in any jurisdiction in which such an offer would be unlawful under the securities laws of such jurisdiction.

NZDUSD Daily Analysis: Slight Bullish Bias as Commodity Prices NZDUSD Daily Analysis: Slight Bullish Bias as Commodity Prices and Risk Sentiment Favor the Kiwi 03/12/2024
Introduction
NZDUSD is expected to show a slight bullish bias today, driven by strengthening commodity prices, positive risk sentiment, and a weaker U.S. dollar. As the global market outlook improves and key economic factors align in favor of the New Zealand dollar (NZD), the pair is poised to continue its upward trajectory. This article outlines the fundamental and technical factors supporting the NZDUSD bullish outlook for today.
---
Key Drivers Influencing NZDUSD
1. Commodity Price Strength
New Zealand is a major exporter of agricultural products, and the recent uptick in global commodity prices—especially dairy and meat—has provided substantial support for the NZD. This rise in commodity prices boosts New Zealand’s export revenues, supporting the strength of the kiwi.
2. Risk-On Market Sentiment
The broader market sentiment has shifted towards a risk-on mood, with global equities showing signs of recovery. The improved appetite for riskier assets tends to favor currencies like the NZD, which is considered a commodity-linked and higher-yielding currency.
3. U.S. Dollar Weakness
The U.S. dollar continues to face downward pressure amid expectations of a dovish Federal Reserve. Market participants have reduced their expectations for further rate hikes, making the USD less attractive relative to other currencies. As a result, the NZD is benefiting from this USD weakness, further supporting the bullish outlook for NZDUSD.
4. Positive Economic Data from New Zealand
Recent data out of New Zealand has shown resilience in key sectors like manufacturing and employment. These economic fundamentals provide additional backing for the NZD and suggest that New Zealand’s economy is on solid footing compared to its global counterparts.
---
Technical Analysis
Moving Averages and RSI
NZDUSD is currently trading above its 50-day moving average, which indicates a continuation of the bullish trend. The Relative Strength Index (RSI) is hovering in neutral territory, signaling that the pair has room to move higher without being overbought.
MACD and Key Levels
The MACD indicator shows a positive momentum shift, with the pair holding above key support levels. Immediate resistance is seen at 0.6350, and a breakout above this level could lead to further gains toward 0.6400. On the downside, support is at 0.6300, which could provide a cushion in case of any pullbacks.
---
Conclusion
NZDUSD is likely to experience a slight bullish bias today, supported by rising commodity prices, favorable risk sentiment, and ongoing USD weakness. Traders should watch for further signs of upward momentum, particularly if the pair breaks through key resistance levels. However, caution is warranted as market sentiment can shift quickly.
---
SEO Tags:
- #NZDUSDforecast
- #NZDUSDanalysis
- #NZDUSDtechnicalanalysis
- #ForexTradingNZDUSD
- #NewZealandDollarOutlook
- #USDWeakness
- #NZDUSDtoday
- #ForexMarketAnalysis
- #NZDUSDprediction

Invest in Invesco DB Commodity IndexWhy invest in Invesco DB Commodity Index Tracking Fund (DBC)?
The Invesco DB Commodity Index Tracking Fund (DBC) is one of the most popular exchange-traded funds (ETFs) that offer an easy and efficient way to gain exposure to commodities. This fund is designed to track the movement of a broad-based index of major commodities, making it an excellent choice for portfolio diversification.
Main advantages of DBC:
1. Risk diversification
DBC provides access to a basket of 14 different commodities, including oil, natural gas, gold, silver, corn and wheat. This means that investors are not entirely dependent on the performance of one commodity, but can benefit from a balanced spread of risk.
2. Protection against inflation
Historically, commodities have proven to maintain or increase in value during times of inflation. Investing in DBC allows investors to protect themselves against a loss of purchasing power, as commodity prices tend to rise when inflation rises.
3. Convenience and liquidity
As an exchange-traded fund, DBC offers high liquidity and easy access through a simple brokerage account. Investors can buy and sell DBC shares on the exchange at any time, without the complexity and expense of buying commodities directly.
4. Potential for growth in a global economic recovery
Raw materials are often directly related to economic activity. With increasing demand for energy resources, metals and agricultural products, DBC provides an opportunity to profit from these global trends.
5. Minimal management costs
DBC has relatively low annual management fees (around 0.85%), making it an economical vehicle for long-term exposure to commodities.
Conclusion
The Invesco DB Commodity Index Tracking Fund (DBC) is an excellent choice for investors looking for stability, inflation protection and diversified access to the commodity market. With the convenience of an exchange-traded fund and the potential for profit in the face of changing global economic factors, DBC can be a key part of a well-structured investment portfolio.

Week in a Glance: Inflation, Taxes, Commodity Markets, & CryptoThe past week was not rich in high-profile events, but you cannot call it completely calm, especially for the cryptocurrency market. The week for crypto traders began with rather pessimistic news about the mining ban in China, as well as details of the sanctions for breaking the ban (I mean information from Inner Mongolia, which is going to deprive companies found to be mining licenses, as well as state preferences). As a result, several large mining pools rushed to suspend activity in China. But China is no less than 65-70% of all world mining. To this percentage can be added another 4.5% of Iran, which banned mining in the country for 4 months.
Despite such an obvious negative, it was possible to find a conditional positive. For example, the creation of the Bitcoin Mining Council, which should solve the problem of increased energy consumption when mining bitcoin (although what is there to decide - they would switch to the proof of stake protocol instead of proof of work, and the problem would be solved by itself).
But the problems of the cryptocurrency market are actually more about conversations than about business on a global scale. Much more important from the point of view of financial markets, things are happening around inflation in the world and the United States, as well as the possible actions of the central banks in this regard.
So last week gave another cause for concern among buyers in the US stock market: the key inflation indicator (PCE) rose by 3.1 percent in April compared to last year (the largest increase in the personal consumption expenditure index in 12 months since July 1992). And this despite the fact that a number of FRS officials last week directly stated that it is time to begin to reduce the volume of the quantitative easing program in the United States.
However, the markets so far ignore all this, justifying the high inflation figures by a temporary statistical anomaly, as well as by a sharp jump in prices in commodity markets, but the latter have already begun a correction, which means that prices will inevitably fall.
By the way, let's consider the commodity markets. According to Bloomberg, 60-70% of recent price increases in commodity markets are associated not so much with changes in physical supply and demand as with speculative activity. China on this issue last week asked the country's banks to stop selling investment products tied to commodity futures to retail investors, as well as to close all client positions in such instruments. In this regard, recall our recommendation to either sell on overbought commodity markets directly or sell commodity currencies such as the Australian and Canadian dollars.
The coming week is interesting, first of all, with the data on the US labor market, the quintessence of which will be the figures for the NPP. In addition, it will be very interesting to observe the outcome of the OPEC meeting.

ExpertCrudeOil.com - An introduction on commodity derivativesWhat are commodity derivatives ?
Like value equity futures & choices, they are futures and, alternatives on prospects, on an assortment of products from sugar to gold, edible oils to silver and rubber to crude oil .
How many exchanges offer commodity trading ?
MCX offers trading on metals and energy products . NCDEX is the nation's biggest farm futures exchange and ICEX offers trading on plantation products and diamonds . BSE and NSE also recently launched product portions to their trading platforms .
Is a separate trading account needed to trade?
Your current equity trading account might be utilized to trade product prospects gave your merchant is a part on the item trades . But Clients trading on NSE and BSE will, need to get enrolled with the likes of MCX and NCDEX . You can check with your dealer as controller Sebi has permitted financial services firms to merge their commodity broking subsidiaries with their parent organizations which offer equity trading.
Is there a risk in trading?
Truly there is.Without appropriate understanding those skilled at trading equity F&O ought not venture into this portion . All things considered, crude, gold and base metals would attract trading interest in the initial stages from retail equity clients. Hedgers will likewise be quick to cover their risk on agri counters like wheat, sugar and so on.
Who are the participants?
Mainly retail and wholesale commodity traders and a couple of corporate customers other than punters crosswise over resource classes. Sebi permits class 3 interchange speculation assets to exchange and MFs would motivate endorsement to exchange proper way . Also foreign organizations with exposure to Indian products not having presence in India have been permitted to exchange recently . Banks and FPIs are as yet not permitted though former can offer broking services to their customers to trade commodity derivatives.
Reference by- economictimes
ExpertCrudeOil Provides MCX Crude Oil Tips, Crude Oil Tips, Free Crude Oil Tips in India. Expert Crude Oil is a home of experts of the Advance Tech & Fundamental Analysis in Commodity markets.
Contact us- +91 8750708780

Does the commodity bull run continue? After the crash in March 2020 we see a huge increase in the commodity market which is even outpacing the XLK ETF (tracks the technology sector) since September 2020. But is this just a transitory phenomenon or are we just at the beginning of a huge bull run in the commodity sector? When we look at the chart of the CRB-index we can see that we have a clear resistance/support-area at around 200$. Also, the downtrend line was broken in April 2021 (which is intact since 2008) and if the price closes above 200$ the downtrend would not be valid anymore. The MACD is supporting the shift in trend by indicating a positive divergence.
When we look at the fundamentals the chances of a further decreasing value of the dollar due to the broadening money supply are high which would be another tailwind for the commodity sector as the Dollar shows a significant inverse correlation with the commodity market.
Therefore, the probability of a bull run in the commodity sector is high.

EURUSD vs commodity indexThe positive correlation between EURUSD and commodity index (negative with dollar index ) can not be refuted. And as you see, often times Commodity index leads EURUSD. A lag of 1-2 days can be observed at extremums. Why so? Euro and gbp comprise 69.5 percent of Dollar index against which all commodities are measured (gold , silver , crude oil , copper etc). Any move in commodity prices is reflected in dollar index and eurusd. With globalized economy and heavy correlation, one may claim that oil and gold prices exercise more impact on euro than ECB, interest rates or eurusd's moving averages.
Now we got two 9s (TD sequential) on commodity index and the index is likely to turn up. Right now its at S4 Woodie yearly floor pivot .
Also MACD points to a reversal in commodity index.

China against Cryptocurrency and Commodity PricesThe cryptocurrency market continues to experience a fever. As a result, the HSBC head could not resist and said that his bank did not plan to launch cryptocurrency trading or offer cryptocurrencies as investments to clients. Motivation: they are too unstable and lack transparency.
In general, these are very difficult times for the cryptocurrency market. Cryptocurrency mining operators including Huobi Mall and BTC .TOP suspended their operations in China on Friday after Beijing stepped up its efforts to tackle Bitcoin mining and trading. Chinese miners account for about 70% of global mining. Rumors spread throughout the market that Chinese mining pools would start dumping their bitcoins in order to avoid a conflict with the Chinese authorities. This will naturally put pressure on the price of the already bloodless bitcoin.
In general, the Chinese authorities have become more active lately. And one cryptocurrency market is clearly not enough for them. In particular, China has stepped up its fight against soaring commodity prices with the help of a government commission that said there would be "zero tolerance" for "excessive speculation," which it said contributed to the recent rally. As a result, iron ore futures fell like a number of other commodity items. This news fell on an already rather favorable backdrop - this refers to the fears of participants in commodity markets that demand for Chinese commodities has reached a peak, as the country's central bank is gradually limiting the flow of money into the economy, and financing of infrastructure projects is slowing down.
So selling commodities may be a good trading idea, especially from the current clearly overpriced prices. Those who do not want to take unnecessary risks can trade in the foreign exchange market with commodity currencies such as the Australian and Canadian dollars. Naturally, we are talking about selling them.

FX Update: Commodity currencies play catch-upSummary: The EURUSD has retraced nearly all the way back to 1.2000 and neutralized the downside risk and more powerful momentum has now arrived in commodity-linked FX since yesterday against the big dollar, whether in G10 or in EM, the Russian ruble loudly excepted on new US sanctions incoming. More strong US data expected today, but the reaction to the CPI data earlier this week suggests that the market has already priced strong near-term numbers.
FX Trading focus: Commodity FX plays catchup, rising European yields, US data
The USD is lower again after yesterday’s action, though the action is switching to the more traditionally pro-cyclical currencies, as the G10 smalls and most EM currencies are playing some catchup in rallying against the big dollar. A huge jump in crude oil prices yesterday on a large US supplies draw has helped the commodity space and strong iron ore prices provided some offsetting support overnight for the AUD, which otherwise dipped at one point on a weak March jobs report showing that more than 100% of the net job growth on the month was in part-time positions.
As we noted on this morning’s Saxo Market Call podcast, the global Covid picture is still a concern and the global daily case count is actually not that far below its highest ever as a new wave is exploding in many populous EM’s including India, Turkey and the Philippines. But in Europe, markets seem to be looking beyond the vaccine stumbles as production and availability of the Pfizer-BioNTech vaccine looks set to expand dramatically from here. Certainly, SEK is enjoying a strong run recently on the euro’s recovery, as is its wont. EU yields are picking up as well, with the German 10-year Bund yield pulling back toward the key -25 bps yield in recent sessions. Looking at an article discussing the German Green party’s draft platform (warning: get your Google translate ready if you don’t read German) for the late September election, it is tough to over-emphasize how dramatic a development for the EU it would be to see this party in a ruling coalition, particularly if it has the Chancellorship. On everything from a more pro-EU stance and its opposition to the traditional German principle of fiscal “debt brake” austerity to the geopolitical implications for Russia (anti-NordStream2) and China (human rights concerns). The German polls are certainly on the move.
The core March US Retail Sales number today is expected to show an absurd month-on-month reading of 6%+ as the latest and largest of the US stimulus checks hit in the latter part of March. The recent past has shown how quickly the stimulus effect fades, so the market may look through this data, unless the jump is particularly high and suggests that some of the pent-up savings from the generous stimulus of 2020 and this year are being unleashed. Probably too early for that or for the market to jump to conclusions and the reaction to the hot CPI number earlier this week suggests that the bar is high for reacting to positive US data.
Chart: AUDUSD
The AUDUSD chart and many other USD charts have shown a fairly decisive leg of USD weakness, with commodity FX playing a good deal of catchup with other currencies over the last two sessions. The pair need now merely hold the 0.7650-75 area taken out on the way up to keep the sights on the 0.8000+ top and more. One development that might spoil the party for fresh bullish positions would be a renewed rise in US treasury yields. Iron ore futures in China were AUD-supportive overnight with a fresh surge, and tonight we have Chinese GDP and other data out.
Odds and ends
US to announce new sanctions against Russia. Anticipation of new sanctions against Russian individuals and entities and against US based investment in Russian sovereign-linked assets saw the ruble sharply weaker this morning. The Biden administration is assessing the sanctions on accusations of interference in the US elections and hacking of US company SolarWinds. The move arrives after earlier this week, the Biden administration seemed to be making friendly overtures on the prospects of a summit with Russian president Putin. Effectively, the whiplash has the net result that we are trading about unchanged from a week ago.
Turkey keeps rate unchanged at 19% as expected and the lira weakened slightly after a modest run of strength into today’s meeting. Not a surprise to see the reference to further rate-tightening removed from the prior statement, but also interesting to see the new statement indicating that the rate will be kept above the inflation rate, nominally TRY supportive in theory, but we have had a run of stabilization into this meeting, we know that the net reserve situation in Turkey is in bad shape, that the central bank will cut as soon as it thinks it sees daylight to do so, and Turkey is suffering an ugly new wave of Covid. I lean for USDTRY testing toward the highs of the cycle near 8.50.
John Hardy
Head of FX Strategy
Disclaimer
The Saxo Bank Group entities each provide execution-only service and access to Analysis permitting a person to view and/or use content available on or via the website. This content is not intended to and does not change or expand on the execution-only service. Such access and use are at all times subject to (i) The Terms of Use; (ii) Full Disclaimer; (iii) The Risk Warning; (iv) the Rules of Engagement and (v) Notices applying to Saxo News & Research and/or its content in addition (where relevant) to the terms governing the use of hyperlinks on the website of a member of the Saxo Bank Group by which access to Saxo News & Research is gained. Such content is therefore provided as no more than information. In particular no advice is intended to be provided or to be relied on as provided nor endorsed by any Saxo Bank Group entity; nor is it to be construed as solicitation or an incentive provided to subscribe for or sell or purchase any financial instrument. All trading or investments you make must be pursuant to your own unprompted and informed self-directed decision. As such no Saxo Bank Group entity will have or be liable for any losses that you may sustain as a result of any investment decision made in reliance on information which is available on Saxo News & Research or as a result of the use of the Saxo News & Research. Orders given and trades effected are deemed intended to be given or effected for the account of the customer with the Saxo Bank Group entity operating in the jurisdiction in which the customer resides and/or with whom the customer opened and maintains his/her trading account. Saxo News & Research does not contain (and should not be construed as containing) financial, investment, tax or trading advice or advice of any sort offered, recommended or endorsed by Saxo Bank Group and should not be construed as a record of our trading prices, or as an offer, incentive or solicitation for the subscription, sale or purchase in any financial instrument. To the extent that any content is construed as investment research, you must note and accept that the content was not intended to and has not been prepared in accordance with legal requirements designed to promote the independence of investment research and as such, would be considered as a marketing communication under relevant laws.

GOLD COMMODITY At NOW RESITANCE & BO one slanting TRENDLINEGOLD is a Commodity Trding Instrument.In india Market Open From 09.00 AM to 11.55 PM.
Demand and Consumption
India's gold demand is driven largely by:
Jewelry: Nearly 50%-60% of India's gold consumption is for jewelry.
Investment: Gold is a popular form of investment, both in physical form (coins, bars) and financial products (gold ETFs, sovereign gold bonds).
Industrial Use: A small percentage of gold is used in electronics and medical devices.
There are multiple ways to trade in gold:
Gold Futures: Contracts traded on commodity exchanges like the Multi Commodity Exchange (MCX) in India.
Gold ETFs (Exchange Traded Funds): Gold-backed securities traded on stock exchanges.
Physical Gold: Coins, bars, and jewelry.
Sovereign Gold Bonds (SGBs): Bonds issued by the government.
Digital Gold: Purchased through apps or digital platforms in small denominations.
